. 2017 Mar 9;18(3):570.
doi: 10.3390/ijms18030570.

Blockage of Glyoxalase I Inhibits Colorectal Tumorigenesis and Tumor Growth via Upregulation of STAT1, p53, and Bax and Downregulation of c-Myc and Bcl-2

Affiliations

Blockage of Glyoxalase I Inhibits Colorectal Tumorigenesis and Tumor Growth via Upregulation of STAT1, p53, and Bax and Downregulation of c-Myc and Bcl-2

Yuan Chen et al. Int J Mol Sci. .

Abstract

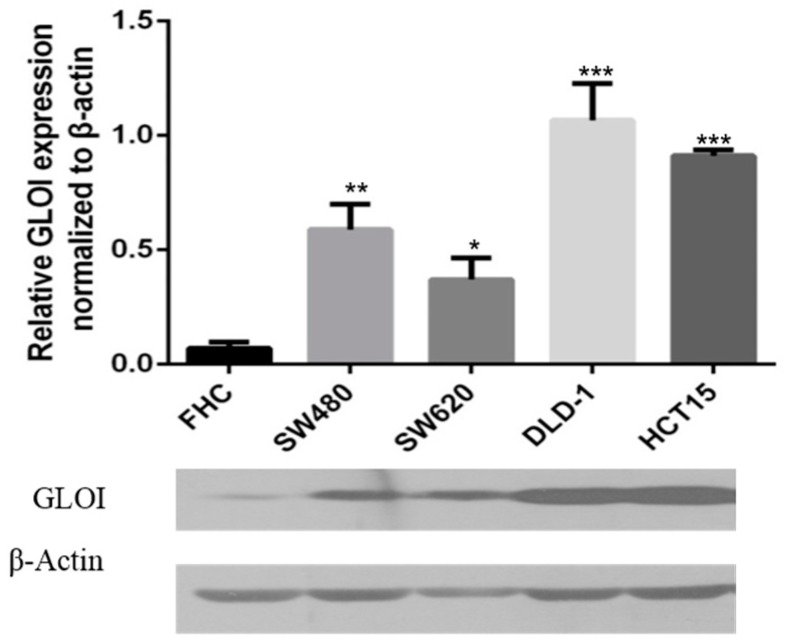
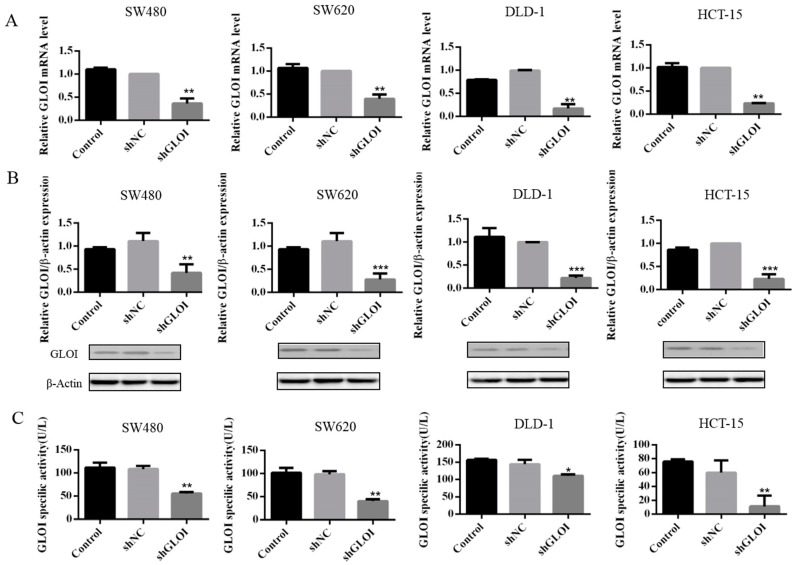
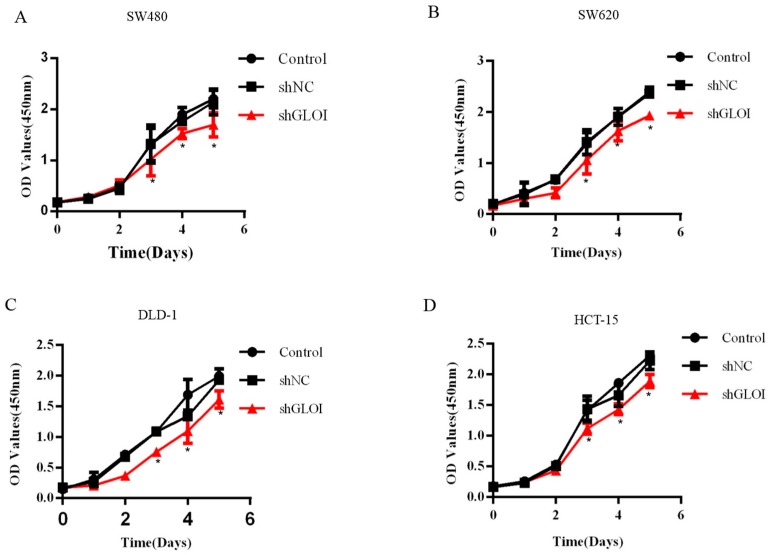
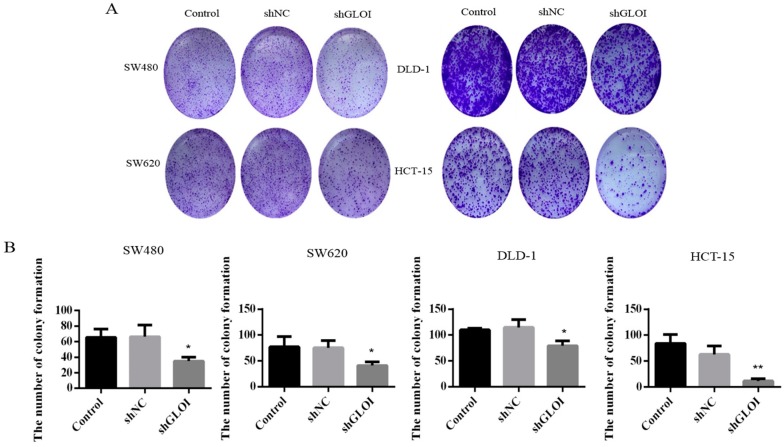
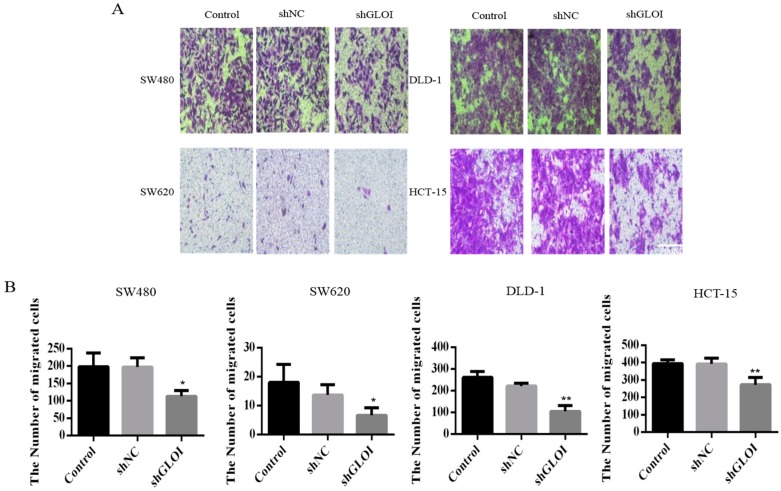
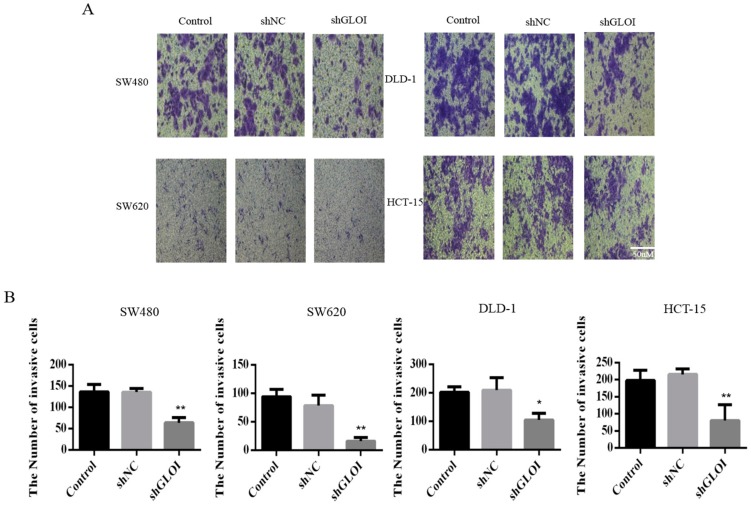
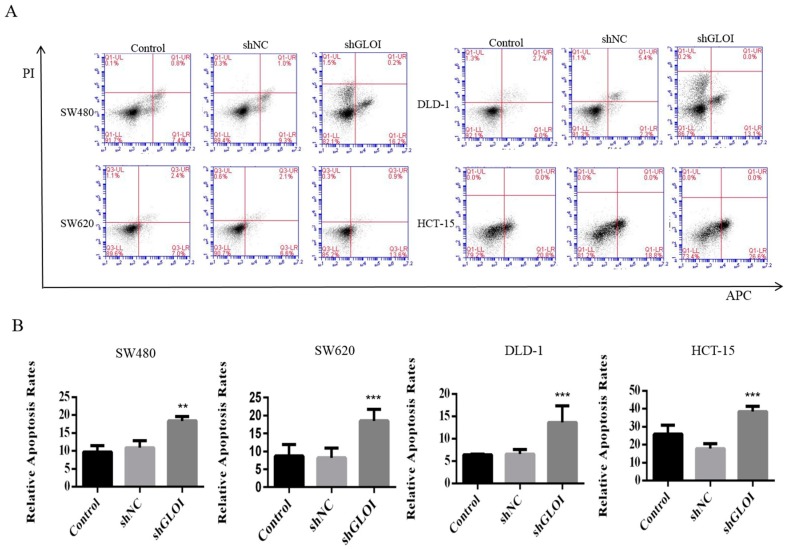
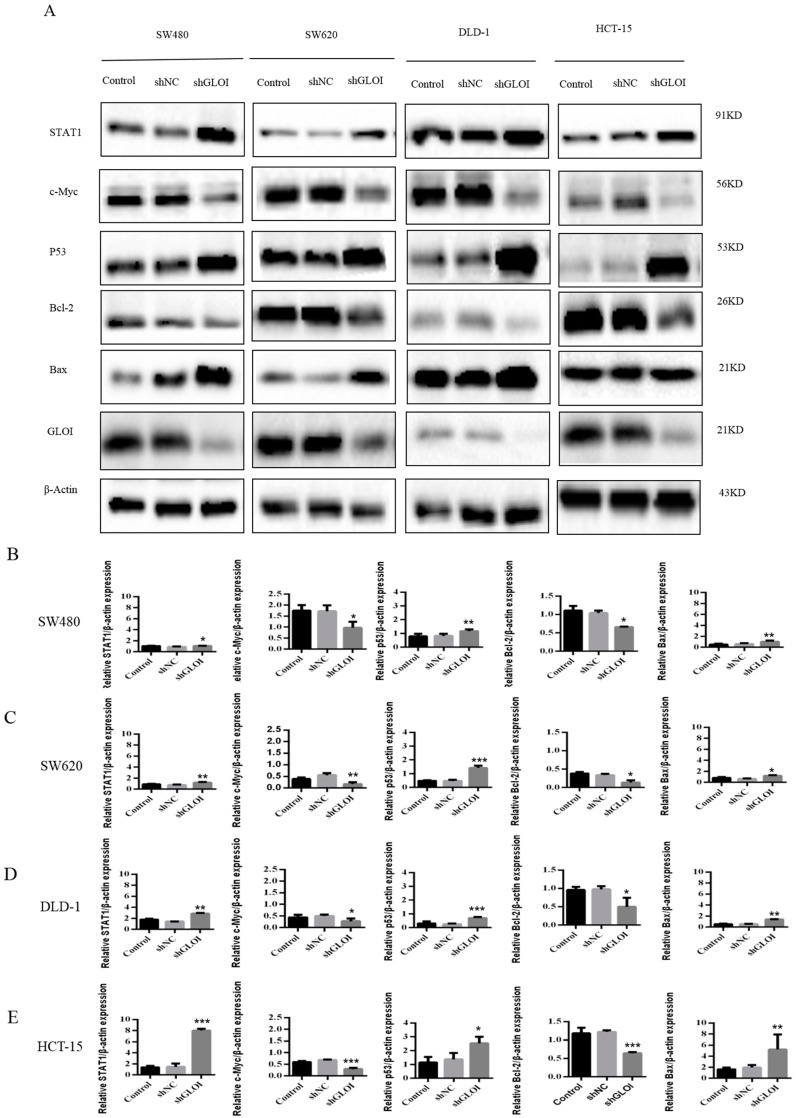
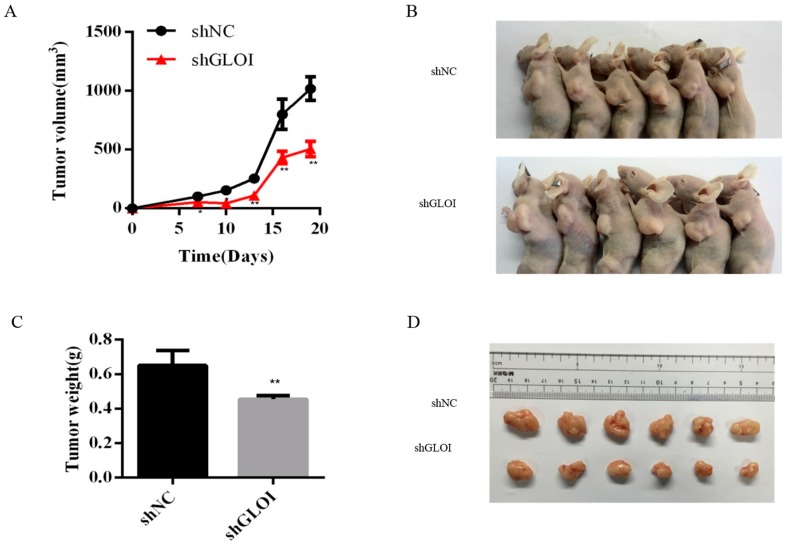
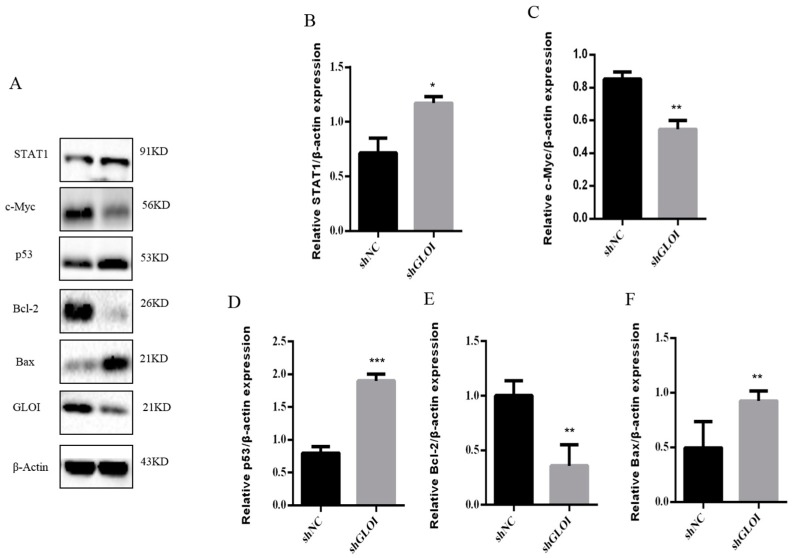
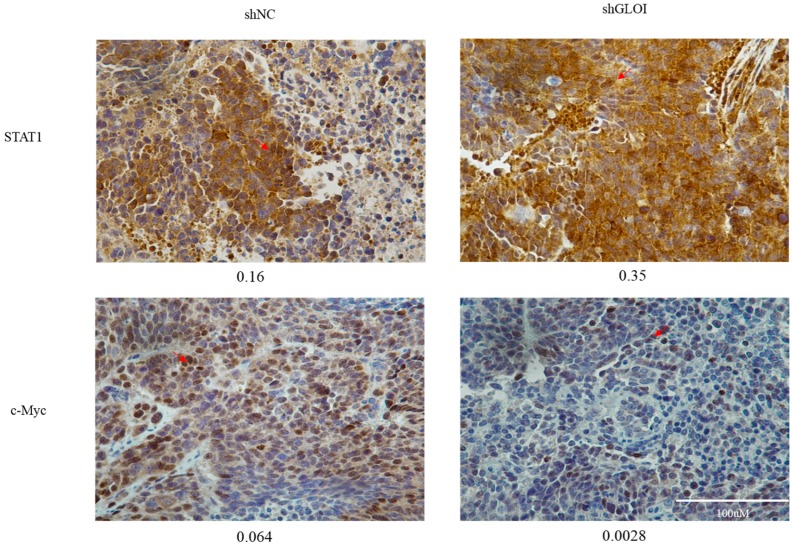
GlyoxalaseI (GLOI) is an enzyme that catalyzes methylglyoxal metabolism. Overexpression of GLOI has been documented in numerous tumor tissues, including colorectal cancer (CRC). The antitumor effects of GLOI depletion have been demonstrated in some types of cancer, but its role in CRC and the mechanisms underlying this activity remain largely unknown. Our purpose was to investigate the antitumor effects of depleted GLOI on CRC in vitro and in vivo. RNA interference was used to deplete GLOI activity in four CRC cell lines. The cells' proliferation, apoptosis, migration, and invasion were assessed by using the Cell Counting Kit-8, plate colony formation assay, flow cytometry, and transwell assays. Protein and mRNA levels were analyzed by western blot and quantitative real-time PCR (qRT-PCR), respectively. The antitumor effect of GLOI depletion in vivo was investigated in a SW620 xenograft tumor model in BALB/c nude mice. Our results show that GLOI is over-expressed in the CRC cell lines. GLOI depletion inhibited the proliferation, colony formation, migration, and invasion and induced apoptosis of all CRC cells compared with the controls. The levels of signal transducer and activator of transcription 1 (STAT1), p53, and Bcl-2 assaciated X protein (Bax) were upregulated by GLOI depletion, while cellular homologue of avian myelocytomatosis virus oncogene (c-Myc) and B cell lymphoma/lewkmia-2 (Bcl-2) were downregulated. Moreover, the growth of SW620-induced CRC tumors in BALB/c nude mice was significantly attenuated by GLOI depletion. The expression levels of STAT1, p53, and Bax were increased and those of c-Myc and Bcl-2 were decreased in the GLOI-depleted tumors. Our findings demonstrate that GLOI depletion has an antitumor effect through the STAT1 or p53 signaling pathways in CRC, suggesting that GLOI is a potential therapeutic target.

Keywords: colorectal cancer; glyoxalaseI; knockdown; p53; signal transducer and activator of transcription 1.


Conflict of interest statement

The authors declare no conflict of interest.

Figures

Figure 1
Figure 1
Glyoxalase I (GLOI) is over-expressed in colorectal cancer (CRC) cell lines. GLOI expression in normal colon cells (FHC) and CRC cell lines (SW480, SW620, DLD-1, and HCT-15) was determined by western blot. β-Actin was used as the internal control. * p < 0.05, ** p < 0.01, *** p < 0.001. All data are representative of three independent experiments (n = 3).
Figure 2
Figure 2
GLOI knockdown suppresses expression of GLOI mRNA, protein, and enzyme activity in colorectal cancer (CRC) cells. The expression of GLOI mRNA (A), GLOI protein (B), and GLOI enzyme activity (C) was lower in SW480, SW620, DLD-1, and HCT-15 CRC cells transfected with short hairpin GLOI (shGLOI) than in cells transfected with short hairpin empty vector (shNC). * p < 0.05, ** p < 0.01, *** p < 0.001. All data are representative of three independent experiments (n = 3).
Figure 3
Figure 3
GLOI knockdown inhibits colorectal cancer (CRC) cell viability. (AD) SW480, SW620, DLD-1, and HCT-15 CRC cells were transfected with shGLOI or shNC. The growth of the cells was monitored for 5 days. Optical density (OD) * p < 0.05. All data are representative of three independent experiments (n = 3).
Figure 4
Figure 4
GLOI knockdown suppresses colony formation by colorectal cancer (CRC) cells. (A) SW480, SW620, DLD-1, and HCT-15 CRC cells were transfected with shGLOI or shNC (empty vector), and colony formation was monitored. (B) Numbers of colonies formed by CRC cells were quantified for comparison. * p < 0.05, ** p < 0.01. All data are representative of three independent experiments (n = 3).
Figure 5
Figure 5
GLOI knockdown inhibits migration of colorectal cancer (CRC) cells. (A,B) SW480, SW620, DLD-1, and HCT-15 CRC cells were transfected with shGLOI or shNC (empty vector) and their migration was evaluated by their penetration of a transwell insert membrane. * p < 0.05, ** p < 0.01. All data are representative of three independent experiments (n = 3).
Figure 6
Figure 6
GLOI knockdown inhibits invasion by colorectal cancer (CRC) cells. (A,B) SW480, SW620, DLD-1, and HCT-15 CRC cells were transfected with shGLOI or shNC (empty vector) and their invasiveness evaluated by their penetration of a transwell insert membrane coated with matrigel. * p < 0.05, ** p < 0.01. All data are representative of three independent experiments (n = 3).
Figure 7
Figure 7
GLOI knockdown increases apoptosis in colorectal cancer (CRC) cells. (A) SW480, SW620, DLD-1, and HCT-15 CRC cells were transfected with shGLOI or shNC. The apoptotic cells were detected by annexin V–propidium iodide (PI) flow cytometry. (B) The apoptotic rate of each group of cells was quantified. ** p < 0.01, *** p < 0.001. All data are representative of three independent experiments (n = 3).
Figure 8
Figure 8
GLOI knockdown alters expression levels of STAT1 or p53 signal pathway proteins in colorectal cancer (CRC) cells. SW480, SW620, DLD-1, and HCT-15 CRC cells were transfected with shGLOI or shNC. The expression levels of signal transducer and activator of transcription 1 (STAT1), p53, c-Myc, Bcl-2, and Bax were determined in the CRC cells by (A) western blot and (BE) quantification of results. * p < 0.05, ** p < 0.01, *** p < 0.001. All data are representative of three independent experiments (n = 3).
Figure 9
Figure 9
GLOI knockdown reduces SW620 xenograft tumor growth in BALB/c nude mice (6 mice/group). Mice were injected subcutaneously with SW620 colorectal cancer cells transfected with shGLOI or shNC and monitored for SW620 tumor growth beginning on day 7 after injection. Tumors were measured every 3 days from that day. (A) Changes in tumor volume over time were plotted. (B) The tumor-bearing mice were killed on day 19 and their tumors dissected. (C) The weight of each dissected tumor was measured at the time of the animal’s death. All data are representative of three independent experiments (n = 6). (D) The dissected tumors are shown. ** p < 0.01.
Figure 10
Figure 10
GLOI knockdown alters expression of STAT1 or p53 signal pathway proteins in SW620 colorectal tumors. Tumors were generated by injecting BALB/c nude mice with SW620 cells transfected with shGLOI or shNC (empty vector). (A) The expression of STAT1 or p53 signal pathway proteins and GLOI in the tumors were analyzed by western blot. (BF) The expression of each protein was quantified and graphed for comparison. * p < 0.05, ** p < 0.01, *** p < 0.001. All data are representative of three independent experiments (n = 3).
Figure 11
Figure 11
GLOI knockdown alters STAT1 and c-Myc expression in SW620 colorectal xenograft tumors. STAT1 and c-Myc expression was determined by immunohistochemical staining of SW620 tumors generated by injecting BALB/c nude mice with SW620 cells transfected with shGLOI or shNC (empty vector). Representative images are shown (original magnification, ×400). The arrow is pointing at positive cells. The integrated optical density (IOD) of STAT1 and c-Myc positive cells was determined in the CRC tumor tissue and indicated under each image. The arrow pointed at STAT1 or c-Myc expression positive cells in the CRC tumor tissue.
Figure 12
Figure 12
GLOI overexpression shortened disease-free survival in a reference patient cohort from www.cbioportal.org. The red line represents GLOI overexpression levels, the blue line represents GLOI low expression levels.

References

    1. Siegel R.L., Miller K.D., Jemal A. Cancer statistics, 2016. CA Cancer J. Clin. 2016;66:7–30. doi: 10.3322/caac.21332. - DOI - PubMed
    1. Ren Y., Mu Y., Song Y., Xie J., Yu H., Gao S., Li S., Peng H., Zhou Y., Lu W. A new peptide ligand for colon cancer targeted delivery of micelles. Drug Deliv. 2016;23:1763–1772. doi: 10.3109/10717544.2015.1077293. - DOI - PubMed
    1. Barton M.K. Earlier adjuvant therapy is beneficial in patients with breast and colon cancer. CA Cancer J. Clin. 2016;66:3–5. doi: 10.3322/caac.21296. - DOI - PubMed
    1. Arias J.L. Drug targeting strategies in cancer treatment: An overview. Mini Rev. Med. Chem. 2011;11:1–17. doi: 10.2174/138955711793564024. - DOI - PubMed
    1. Gill S. Adjuvant therapy for resected high-risk colon cancer: Current standards and controversies. Indian J. Med. Paediatr. Oncol. 2014;35:197–202. doi: 10.4103/0971-5851.142032. - DOI - PMC - PubMed

MeSH terms

Substances