. 2017 Mar 10;18(1):50.
doi: 10.1186/s13059-017-1173-7.

Functional variation in allelic methylomes underscores a strong genetic contribution and reveals novel epigenetic alterations in the human epigenome

Affiliations

Functional variation in allelic methylomes underscores a strong genetic contribution and reveals novel epigenetic alterations in the human epigenome

Warren A Cheung et al. Genome Biol. .

Erratum in

Abstract

Background: The functional impact of genetic variation has been extensively surveyed, revealing that genetic changes correlated to phenotypes lie mostly in non-coding genomic regions. Studies have linked allele-specific genetic changes to gene expression, DNA methylation, and histone marks but these investigations have only been carried out in a limited set of samples.

Results: We describe a large-scale coordinated study of allelic and non-allelic effects on DNA methylation, histone mark deposition, and gene expression, detecting the interrelations between epigenetic and functional features at unprecedented resolution. We use information from whole genome and targeted bisulfite sequencing from 910 samples to perform genotype-dependent analyses of allele-specific methylation (ASM) and non-allelic methylation (mQTL). In addition, we introduce a novel genotype-independent test to detect methylation imbalance between chromosomes. Of the ~2.2 million CpGs tested for ASM, mQTL, and genotype-independent effects, we identify ~32% as being genetically regulated (ASM or mQTL) and ~14% as being putatively epigenetically regulated. We also show that epigenetically driven effects are strongly enriched in repressed regions and near transcription start sites, whereas the genetically regulated CpGs are enriched in enhancers. Known imprinted regions are enriched among epigenetically regulated loci, but we also observe several novel genomic regions (e.g., HOX genes) as being epigenetically regulated. Finally, we use our ASM datasets for functional interpretation of disease-associated loci and show the advantage of utilizing naïve T cells for understanding autoimmune diseases.

Conclusions: Our rich catalogue of haploid methylomes across multiple tissues will allow validation of epigenome association studies and exploration of new biological models for allelic exclusion in the human genome.


Figures
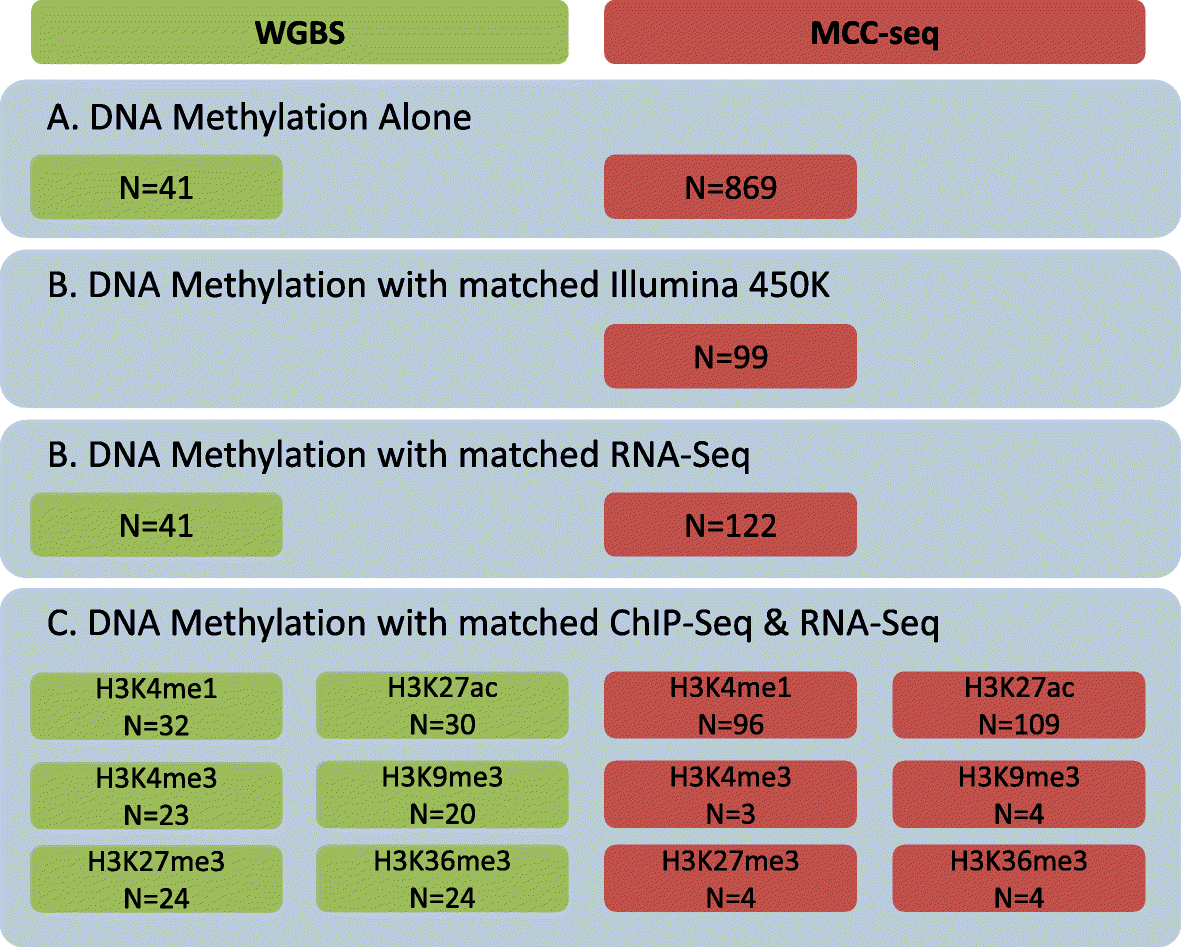
Fig. 1
Fig. 1
Samples having multiple layer of epigenetics profiles were used in this project. DNA methylation profiles were assessed for all samples using either whole genome bisulfite sequencing (WGBS; green) or targeted bisulfite sequencing (MCC-Seq; red). Listed in this figure are the number of samples used for analyses focusing on: a methylation sequencing alone (Methyl-Seq), b methylation with matched RNA-Seq from the same sample, or c methylation sequencing with matched ChIP-Seq (using six different histone marks) and matched RNA-Seq from the same sample
Fig. 2
Fig. 2
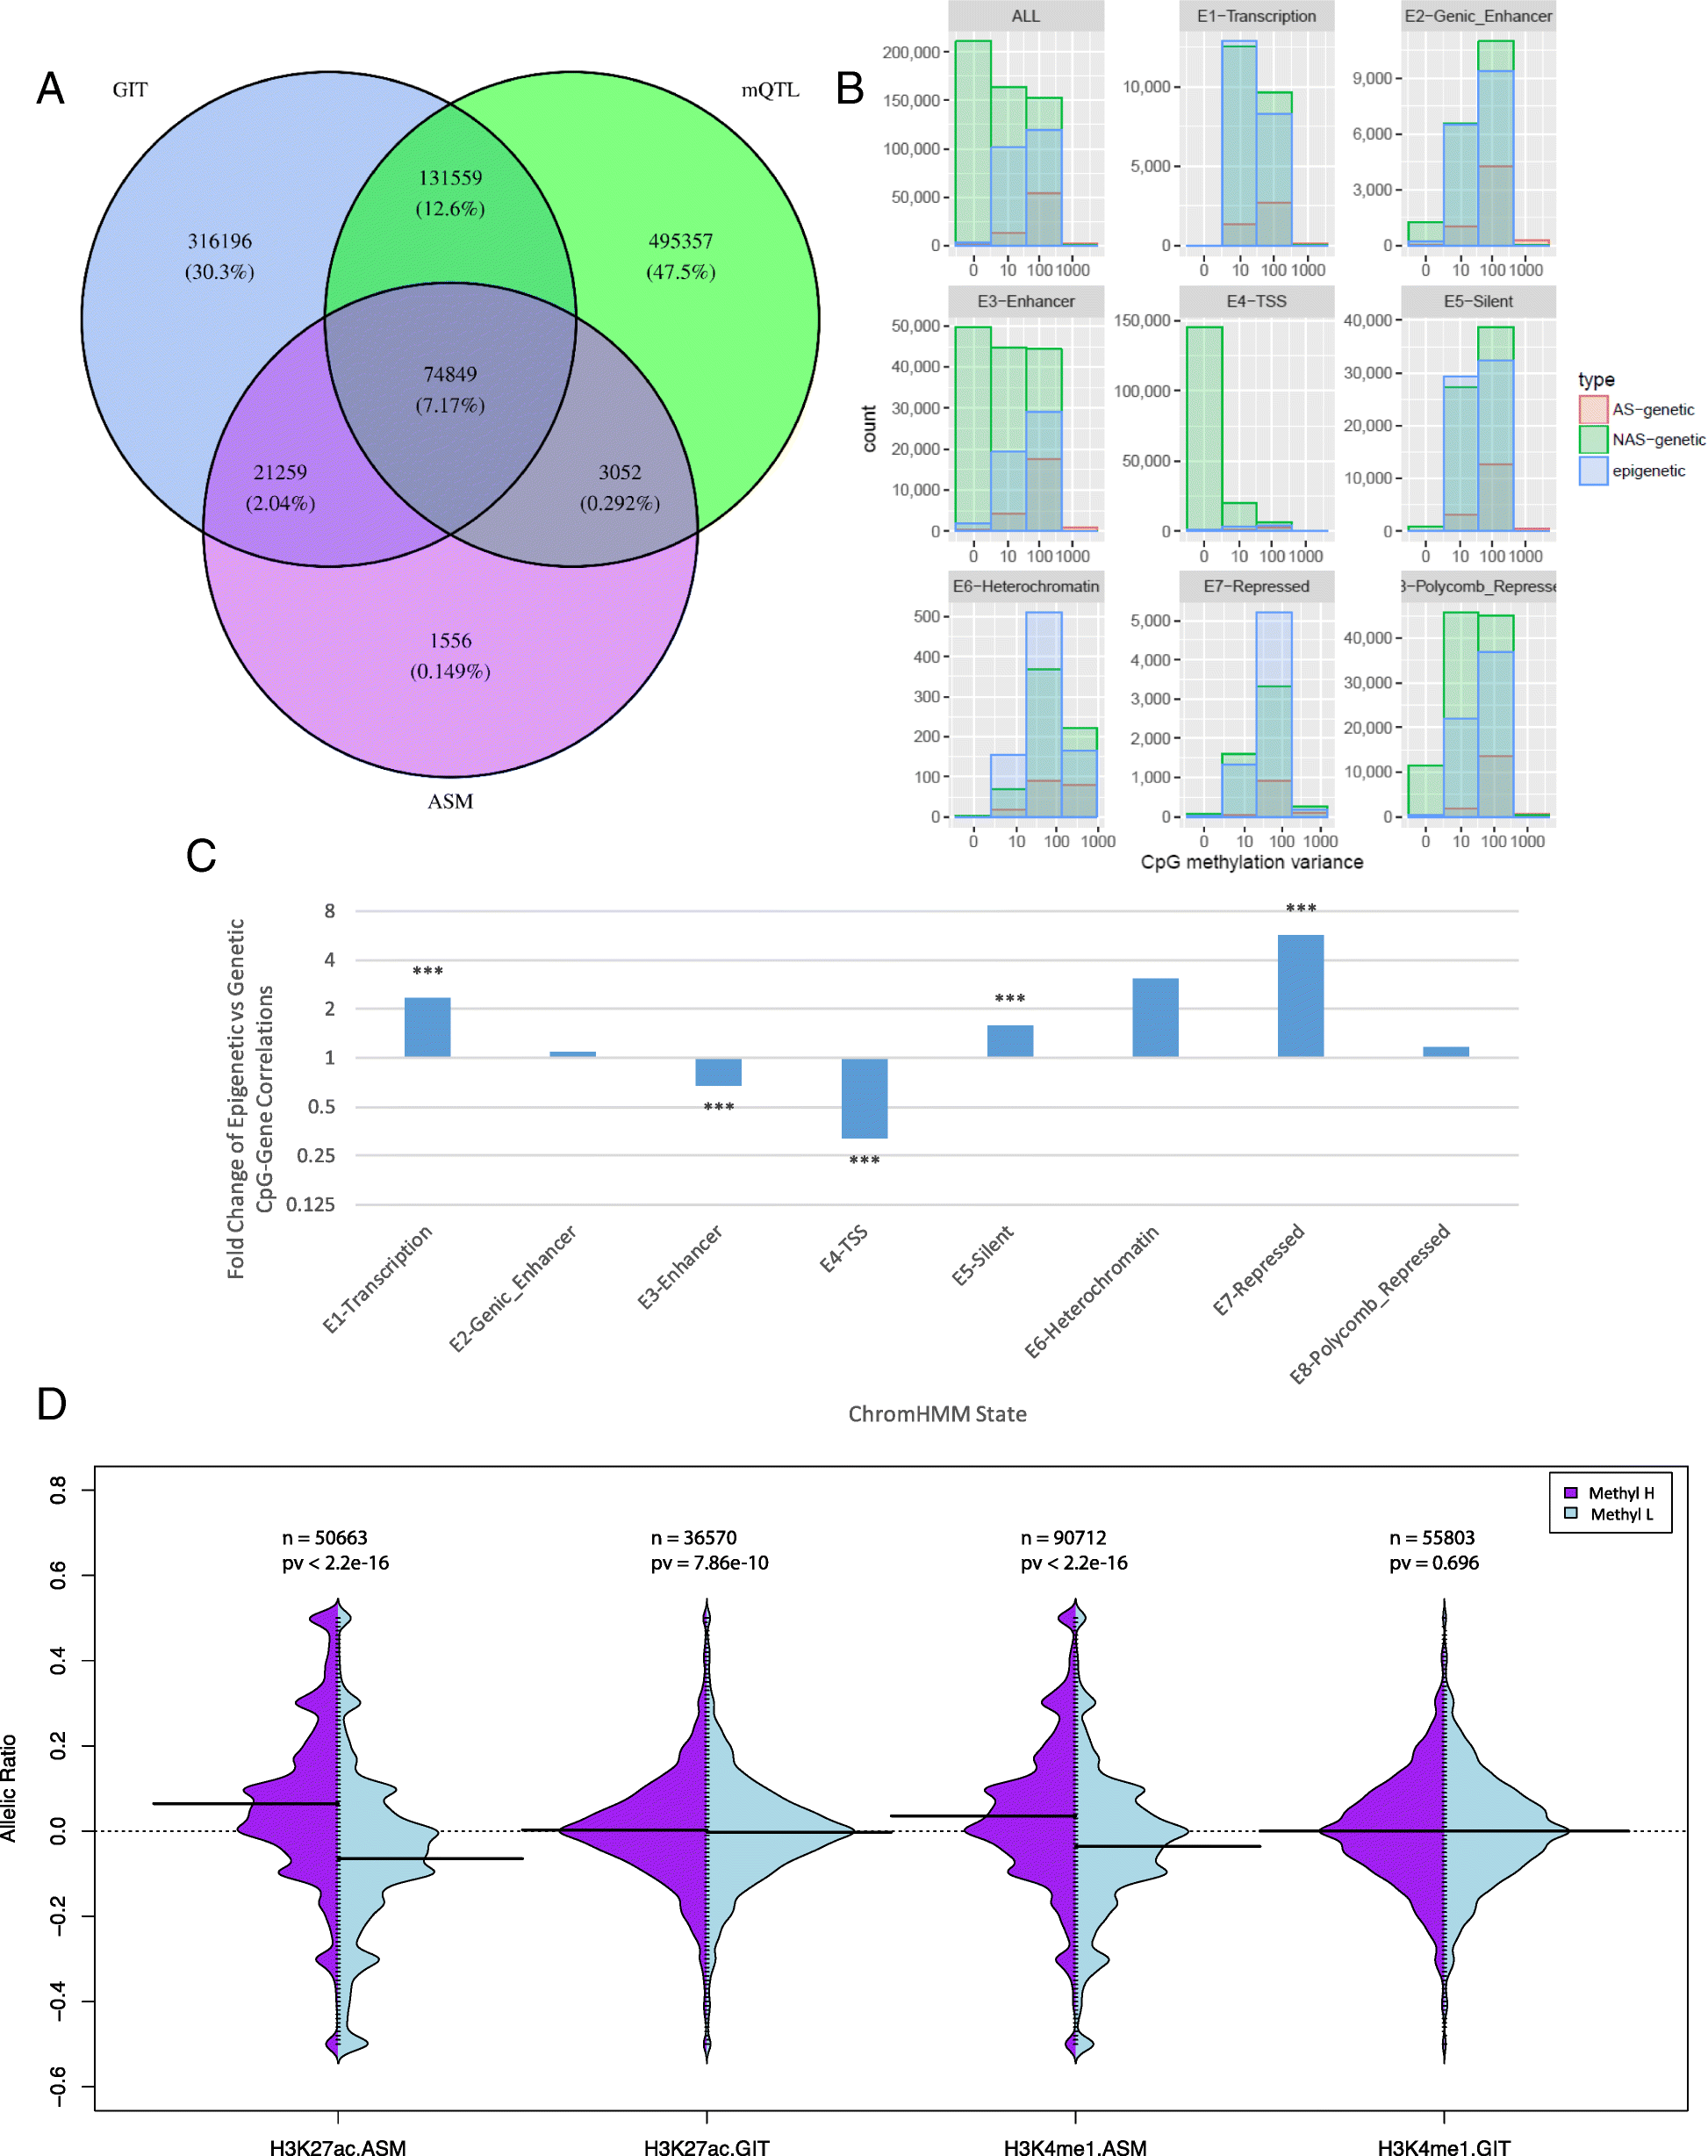
a CpGs showing significant (q < 0.01) imbalanced methylation, significant (q < 0.1) allelic methylation, and significant (q < 0.1) non-allelic methylation. Percentages indicate the proportion of the total significant CpGs found in any of these three sets (n = 962,557 of the 2,233,846 CpGs tested in all three tests). b Counts of CpGs showing allele-specific (AS)-genetic (ASM q < 0.1), non-allele-specific (NAS)-genetic (ASM q ≥ 0.1 and mQTL < 0.1), epigenetic (GIT q < 0.01, ASM and mQTL ≥ 0.1), and no (GIT q > 0.01, ASM and mQTL q ≥ 0.1) associations. Frequencies are plotted for all the CpGs, and also for CpGs in each of the ChromHMM regions. TSS transcription start site. c Fold change of the rate of putatively epigenetic (GIT q < 0.01, ASM and mQTL q ≥ 0.1) versus genetic (ASM or mQTL q < 0.1). ***Ratios with Fisher p < 0.0001; all other p values were >0.05. d Distribution of allelic ratios at significant GIT and ASM CpGs, for H3K27ac and H3K4me1 in normal T cells
Fig. 3
Fig. 3
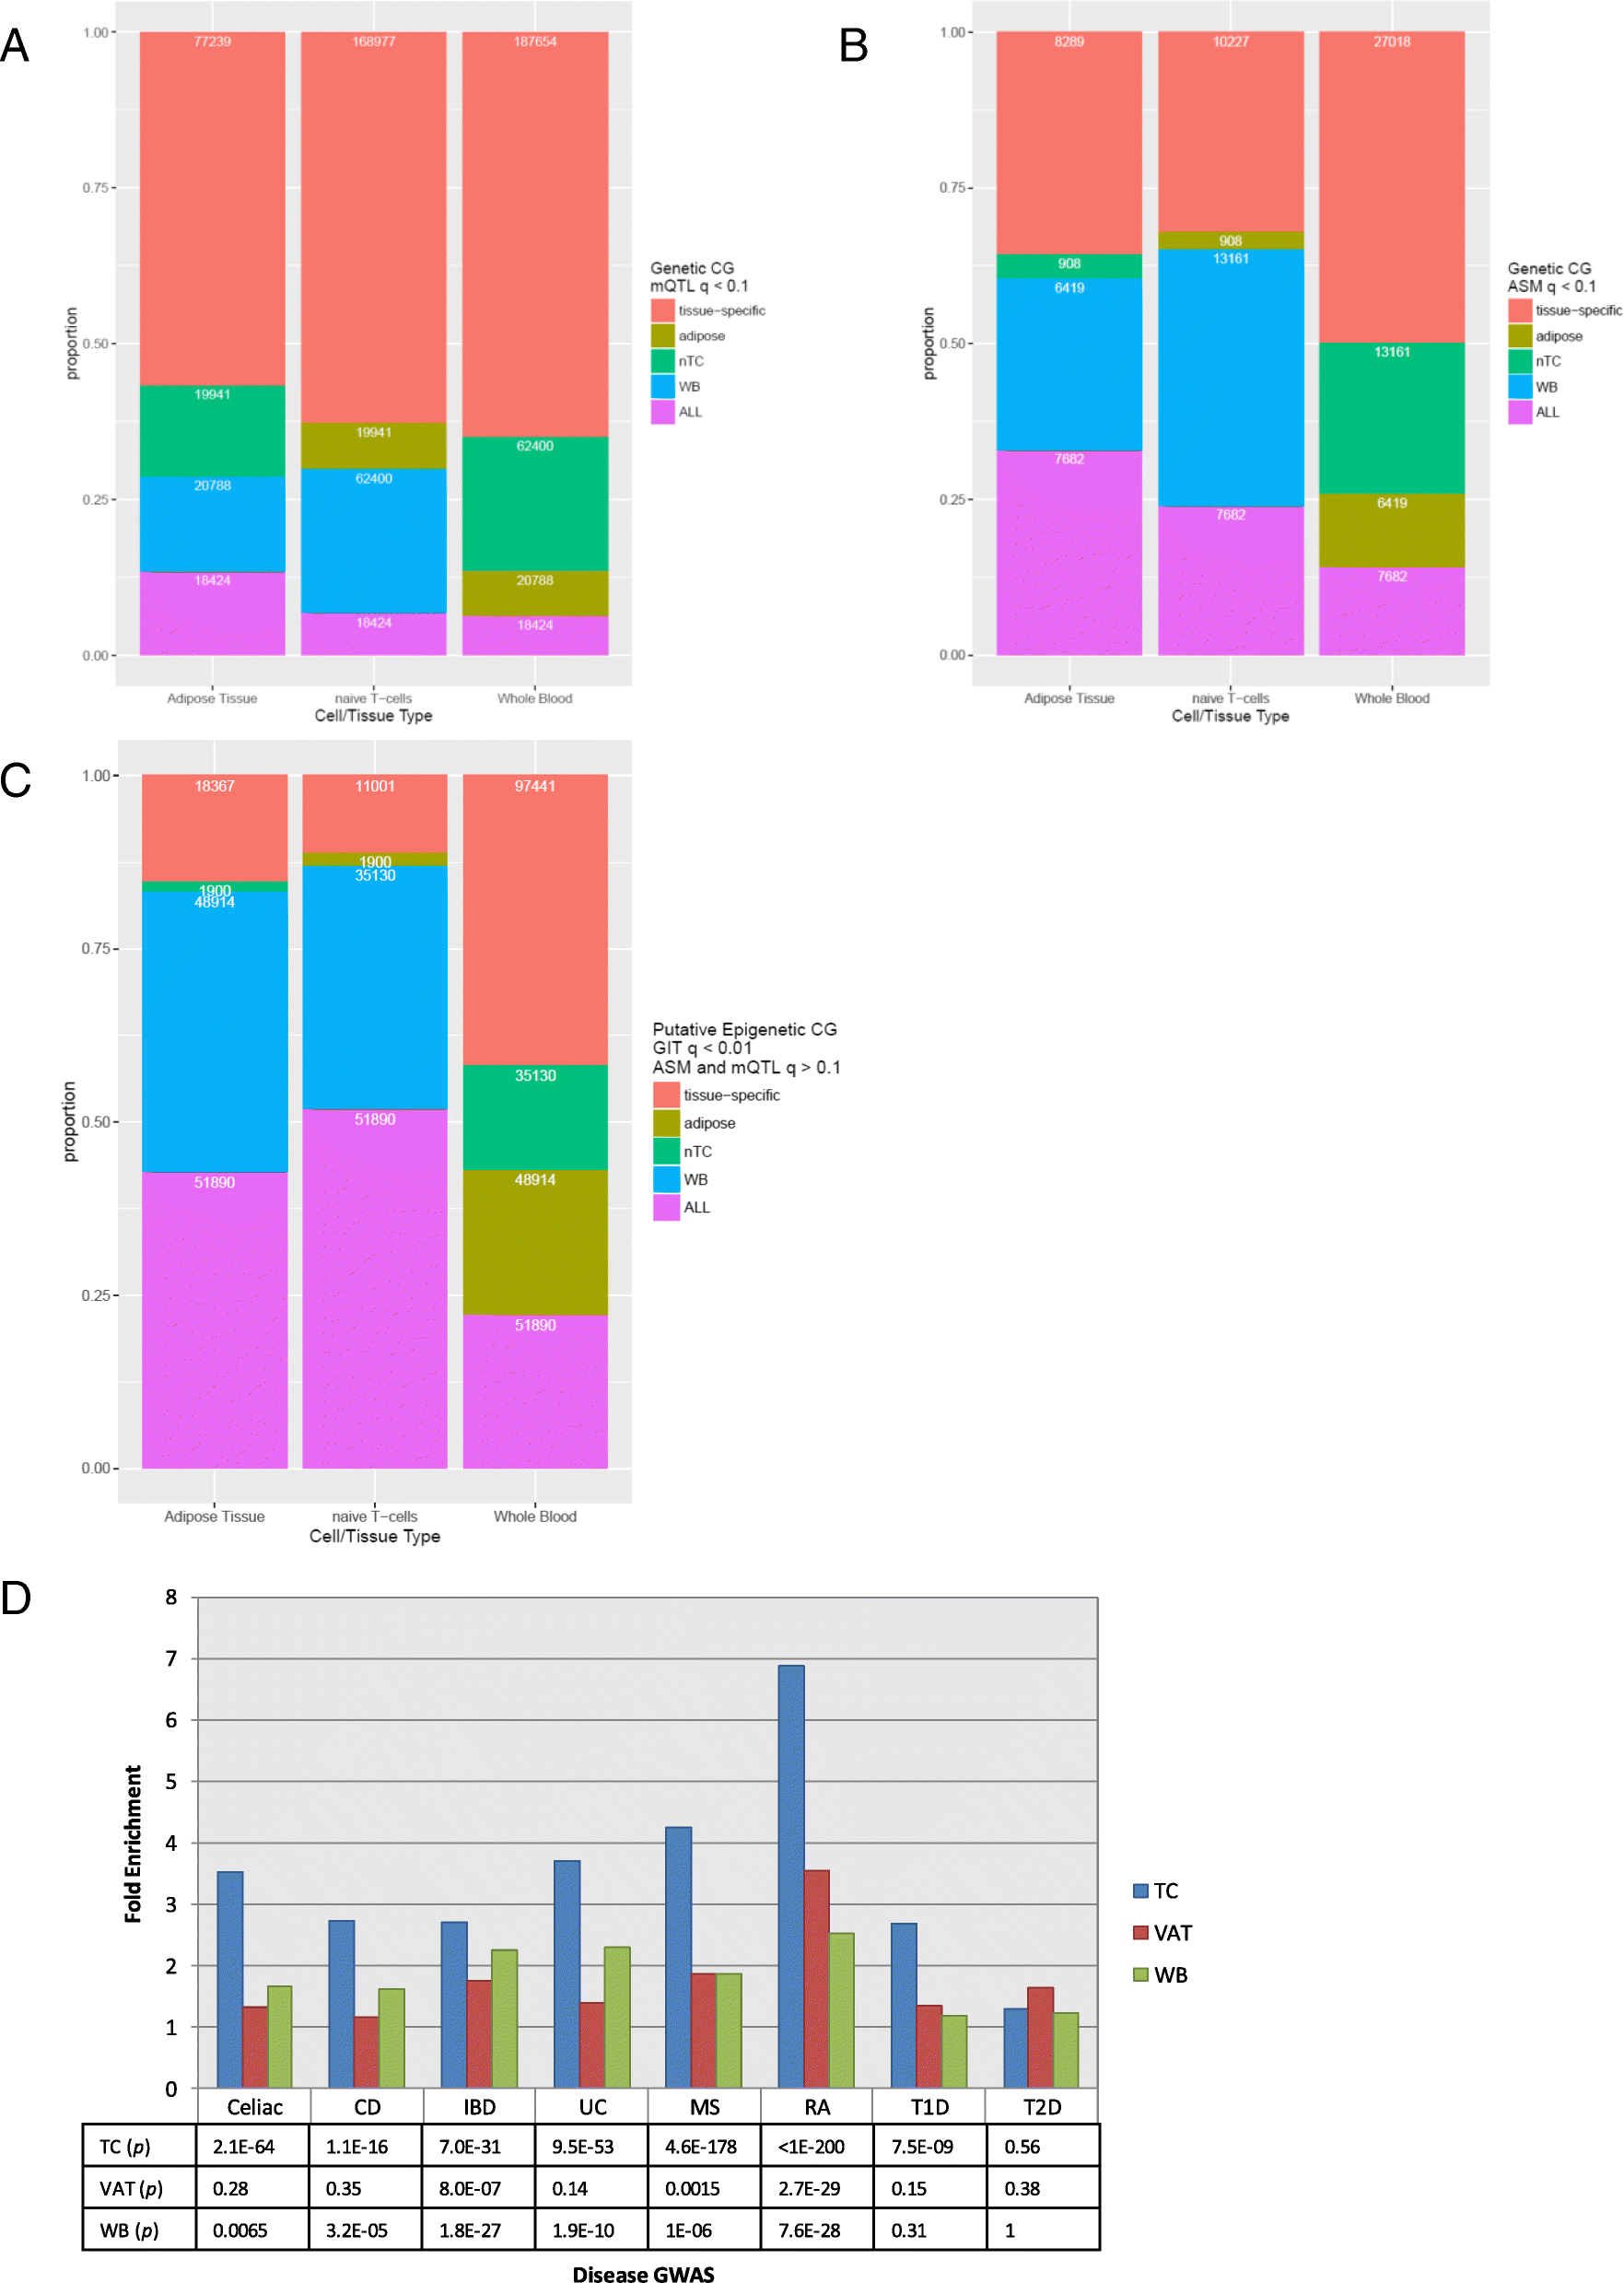
The proportion and number of sites of cell type-specific methylation in adipose tissue, naïve T cells (nTC), and whole blood (WB). The red segments at the top show the proportion of CpGs that are specific to the specific tissue, and the purple segments at the bottom show the proportion of CpGs that were found in all three cell types. The yellow, green and blue bars show CpGs that are shared between the specific cell type and adipose tissue, naïve T cells, and whole blood, respectively. Shown is the breakdown in the three cell types for a significant mQTL CpGs (q < 0.1), b significant ASM CpGs (q < 0.1), c putative epigenetic (filtered for ASM and mQTL q > 0.1) GIT CpGs (GIT q < 0.01). d Enrichment GWAS SNPs associated with significant ASM in three different tissues—naïve T cells (TC, blue), whole blood (WB, green) and visceral adipose tissue (VAT, red). We show enrichment for disease-associated loci from eight different traits (celiac disease, Crohn’s disease (CD), inflammatory bowel disease (IBD), ulcerative colitis (UC), multiple sclerosis (MS), rheumatoid arthritis (RA), type 1 diabetes (T1D), and type 2 diabetes (T2D)) and SNPs associated with ASM
Fig. 4
Fig. 4
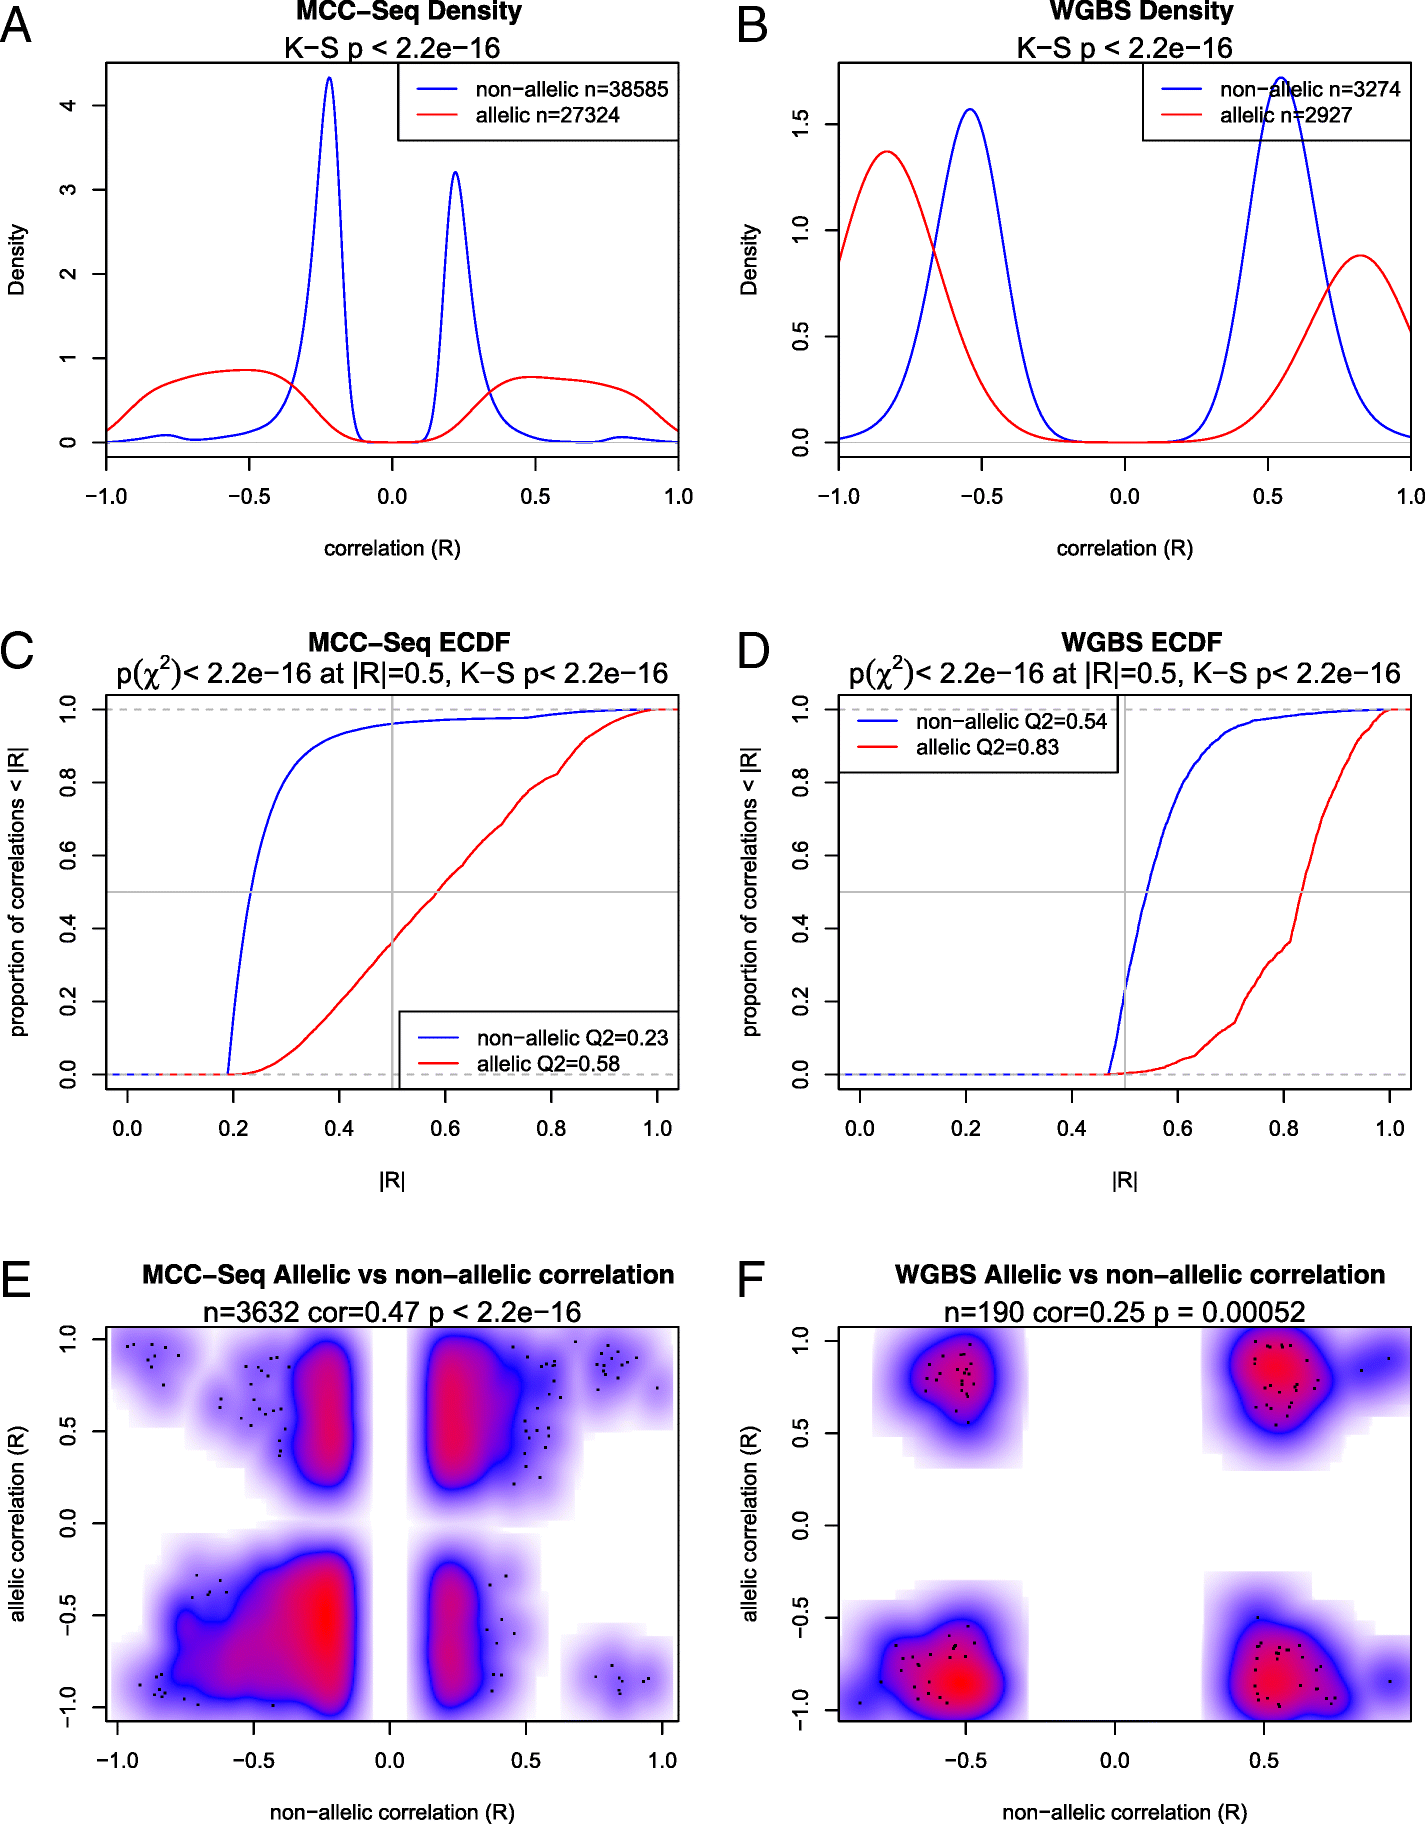
Density of allelic and non-allelic methylation versus gene expression correlation (R) and cumulative distribution of the absolute allelic and non-allelic correlation (|R|) for each dataset. a Density plot of significant (p < 0.05) correlations detected among sites (NCpG = 241,687, Ntests = 441,931) tested for allelic and non-allelic correlation for CpGs measured via MCC-Seq. b Density plot of significant correlations for sites (NCpG = 40,315, Ntests = 58,106) with methylation estimated by WGBS. c Empirical cumulative density function (ECDF) plot of the absolute correlation for sites evaluated using MCC-Seq. d ECDF for sites evaluated by WGBS. e Smoothed color density scatter plot of sites comparing significant non-allelic (x-axis) and allelic (y-axis) correlation (p < 0.05 for both correlation tests) for MCC-Seq. Red indicates high density, blue indicates low density, and white indicates no data. f Smoothed color density scatter plot of significant non-allelic versus allelic correlations for WGBS
Fig. 5
Fig. 5
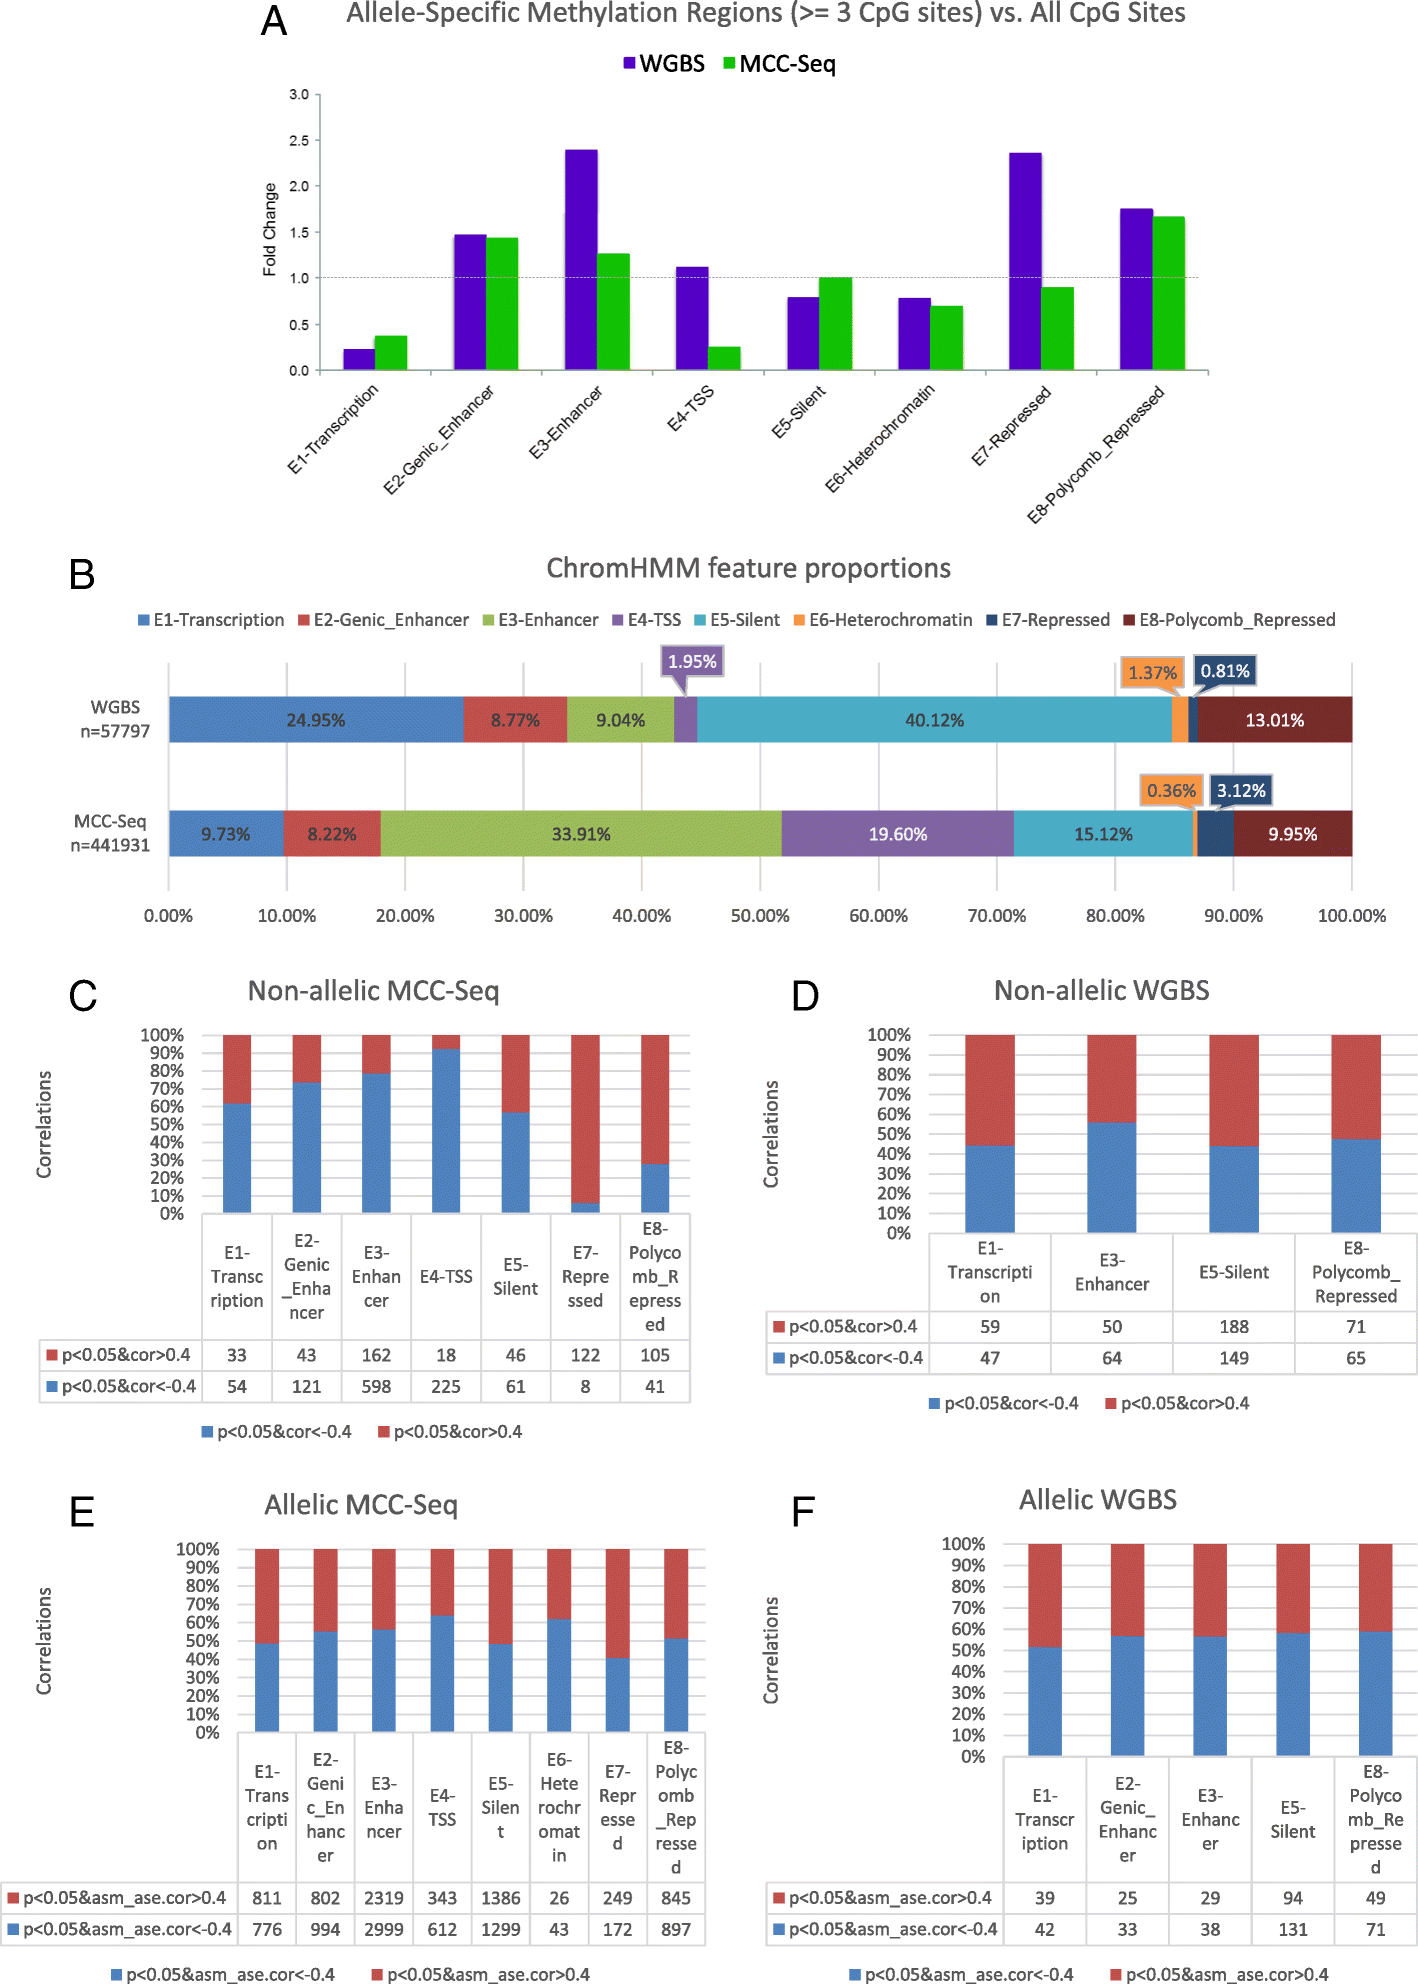
a Fold change difference in fraction of CpG regions (three or more consecutive significantly allelically differentially methylated CpGs) in ChromHMM-assigned state versus the fraction of single significantly allelically differentially methylated CpGs in the same ChromHMM state. The x-axis lists the eight ChromHMM states and each colored bar shows a different cell type/methylation interrogation technology. b Proportion of correlations tested in each ChromHMM state with CpG methylation sequenced by WGBS and MCC-Seq. c Fold-enrichment of positively correlated CpGs evaluated by MCC-Seq in each ChromHMM state. d Fold-enrichment of positive WGBS correlations. e Fold-enrichment of negatively correlated MCC-Seq CpGs per state. f Fold-enrichment of negatively correlated WGBS CpGs per state
Fig. 6
Fig. 6
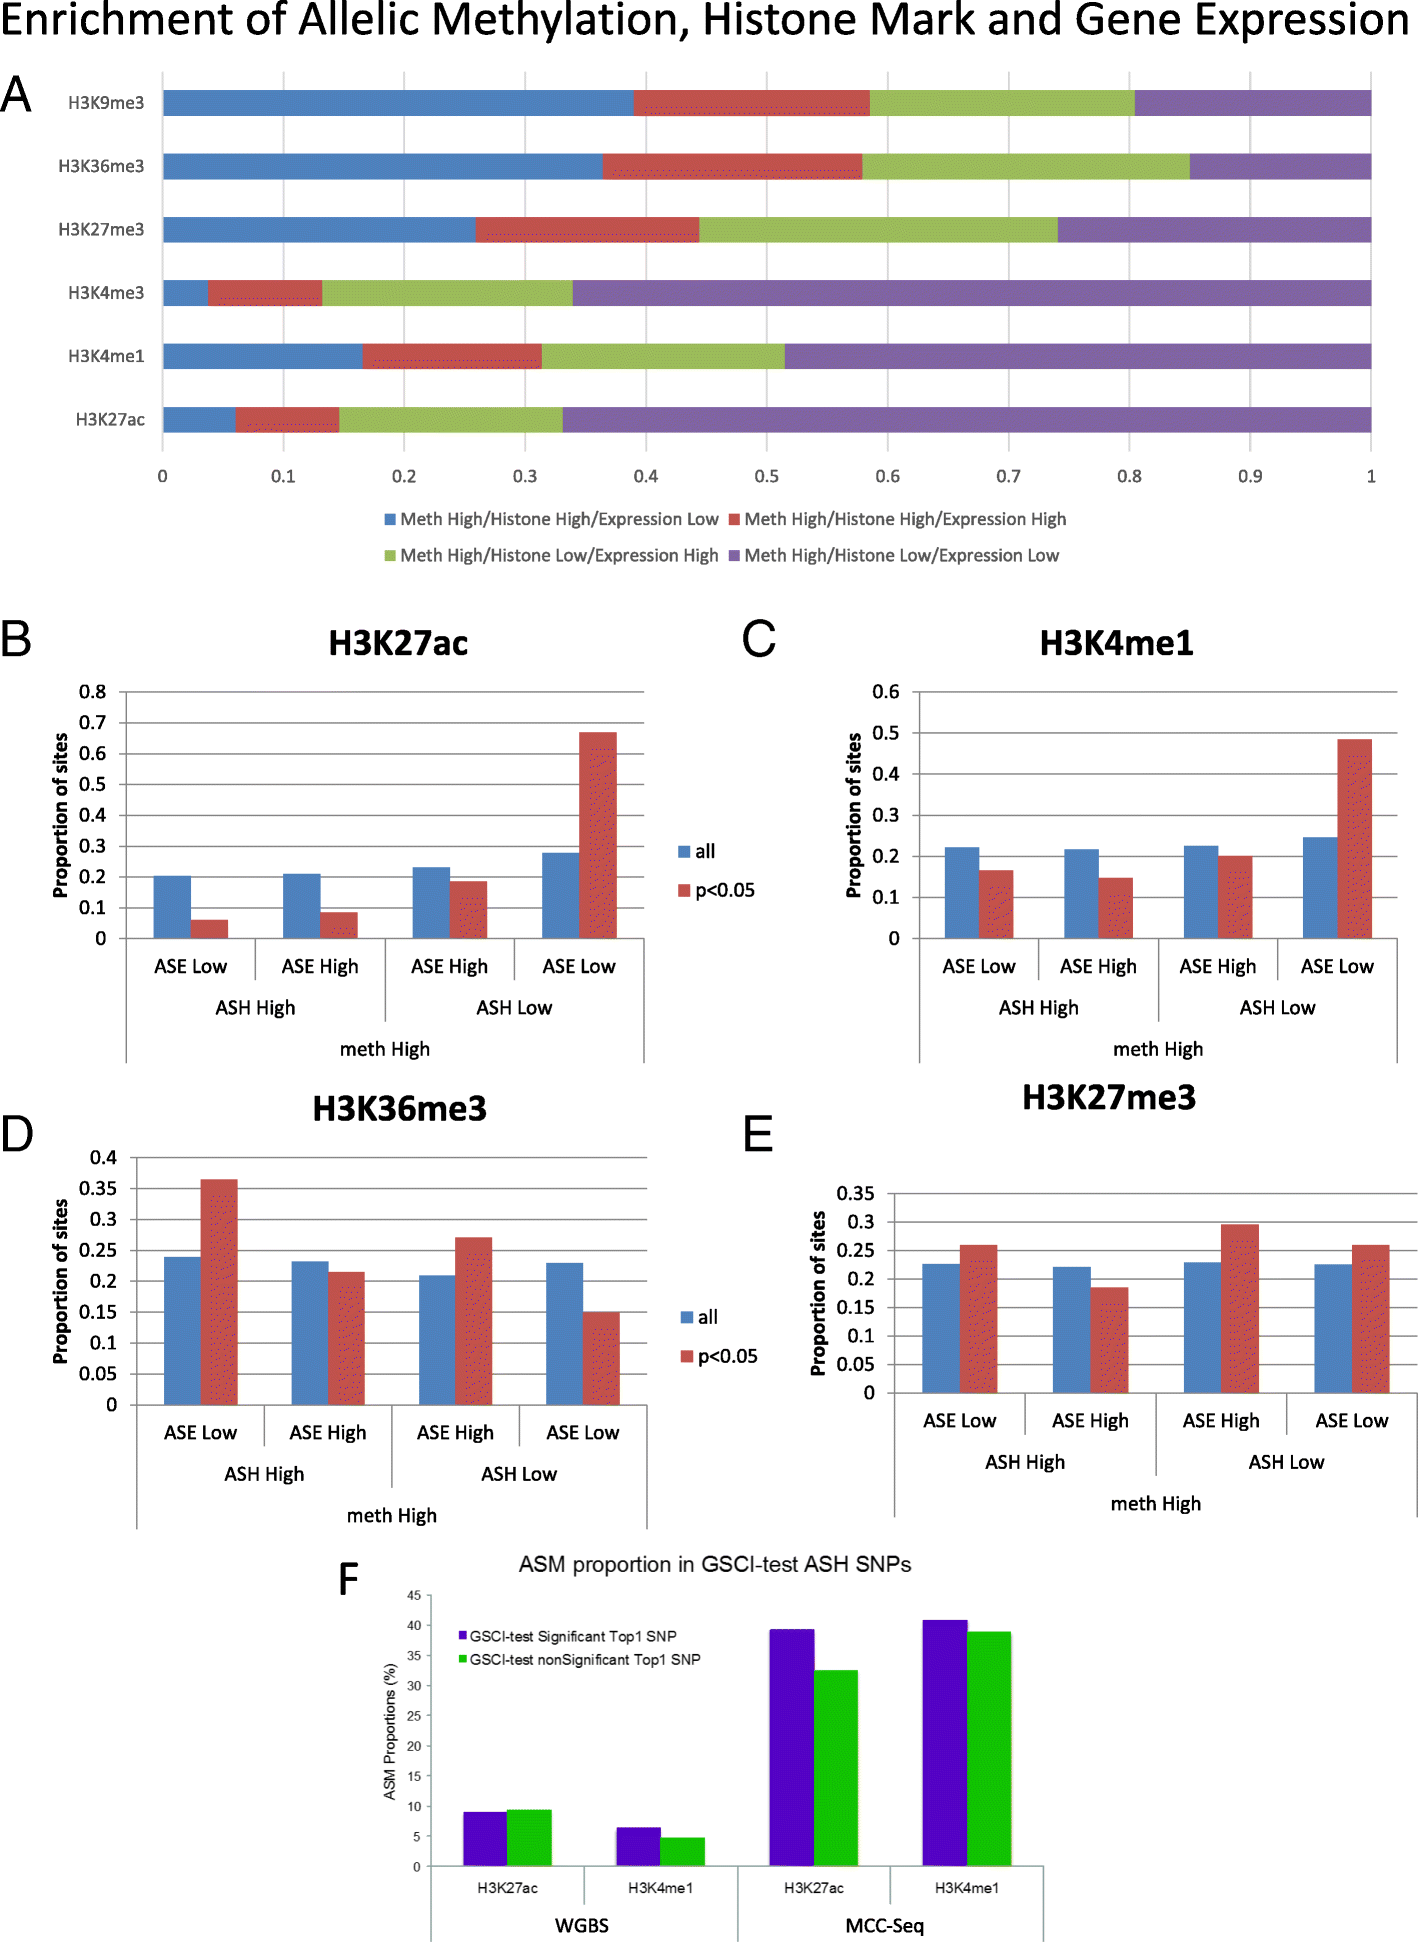
a Proportion of sites showing differential allelic methylation, histone occupancy, and gene expression. All four combinations of high and low methylation rate, histone occupancy rate, and gene expression are compared, described from the perspective of the high methylation allele, and whether this allele is the one with high or low histone occupancy, and high or low gene expression (note that high methylation allele with low histone occupancy also refers to the low methylation allele with high histone occupancy). For the histone marks b H3K27ac, c H3K4me1, d H3K36me3, and e H3K27me3, we show the proportions of all the differential allelic methylation, histone occupancy, and gene expression tested (blue), and proportions of the tested sites that passed significance p < 0.05 (red). f The percentage of allelic differentially modified histone sites as identified by GSCI that have an ASM ratio at the SNP-associated CpG in the top 1% versus the percentage of histone sites not having an allelic effect detected by GSCI but having an ASM ratio at the SNP-associated CpG in the top 1%
Fig. 7
Fig. 7
a The distribution of the mean methylation of CpGs by ChromHMM state, for CpGs in ChromHMM states where we see high correlation between gene expression and H3K27ac (left) or H3K4me1 (right) histone peaks. Bar graphs show the log2 mean allelic ratio of the methylation on the high gene expression allele versus the low gene expression allele (green; indicating p < 0.05) b Positional distribution of CpGs by distance from the center of the ChromHMM state, for all the ChromHMM states having at least 100 CpGs c Summary of log2 mean allelic methylation ratio of CpGs at each distance from the center of the ChromHMM state bin, for the high gene expression allele versus low gene expression allele

References

    1. Maurano MT, Humbert R, Rynes E, Thurman RE, Haugen E, Wang H, Reynolds AP, Sandstrom R, Qu H, Brody J, et al. Systematic localization of common disease-associated variation in regulatory DNA. Science. 2012;337:1190–5. doi: 10.1126/science.1222794. - DOI - PMC - PubMed
    1. Manolio TA, Collins FS, Cox NJ, Goldstein DB, Hindorff LA, Hunter DJ, McCarthy MI, Ramos EM, Cardon LR, Chakravarti A, et al. Finding the missing heritability of complex diseases. Nature. 2009;461:747–53. doi: 10.1038/nature08494. - DOI - PMC - PubMed
    1. Adoue V, Schiavi A, Light N, Almlof JC, Lundmark P, Ge B, Kwan T, Caron M, Ronnblom L, Wang C, et al. Allelic expression mapping across cellular lineages to establish impact of non-coding SNPs. Mol Syst Biol. 2014;10:754. doi: 10.15252/msb.20145114. - DOI - PMC - PubMed
    1. Grundberg E, Small KS, Hedman AK, Nica AC, Buil A, Keildson S, Bell JT, Yang TP, Meduri E, Barrett A, et al. Mapping cis- and trans-regulatory effects across multiple tissues in twins. Nat Genet. 2012;44:1084–9. doi: 10.1038/ng.2394. - DOI - PMC - PubMed
    1. Fairfax BP, Makino S, Radhakrishnan J, Plant K, Leslie S, Dilthey A, Ellis P, Langford C, Vannberg FO, Knight JC. Genetics of gene expression in primary immune cells identifies cell type-specific master regulators and roles of HLA alleles. Nat Genet. 2012;44:502–10. doi: 10.1038/ng.2205. - DOI - PMC - PubMed

Publication types

LinkOut - more resources