. 2017 Mar 9;168(6):1053-1064.e15.
doi: 10.1016/j.cell.2017.02.026.

Functional Selectivity in Cytokine Signaling Revealed Through a Pathogenic EPO Mutation

Affiliations

Functional Selectivity in Cytokine Signaling Revealed Through a Pathogenic EPO Mutation

Ah Ram Kim et al. Cell. .

Abstract

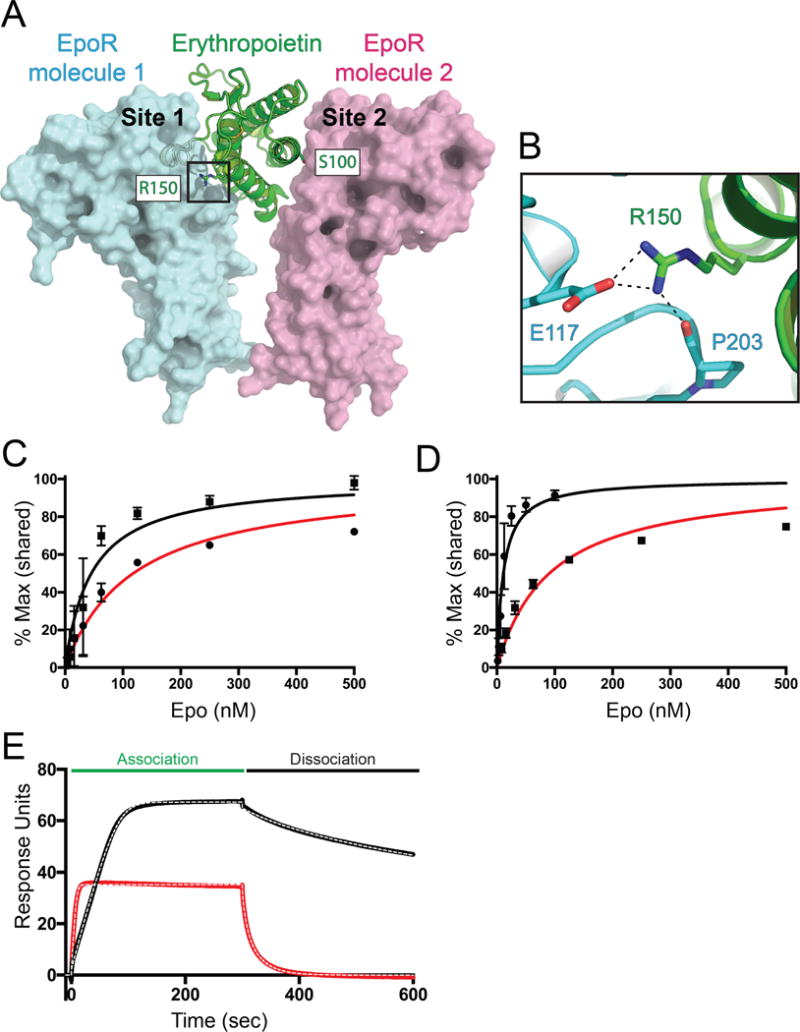
Cytokines are classically thought to stimulate downstream signaling pathways through monotonic activation of receptors. We describe a severe anemia resulting from a homozygous mutation (R150Q) in the cytokine erythropoietin (EPO). Surprisingly, the EPO R150Q mutant shows only a mild reduction in affinity for its receptor but has altered binding kinetics. The EPO mutant is less effective at stimulating erythroid cell proliferation and differentiation, even at maximally potent concentrations. While the EPO mutant can stimulate effectors such as STAT5 to a similar extent as the wild-type ligand, there is reduced JAK2-mediated phosphorylation of select downstream targets. This impairment in downstream signaling mechanistically arises from altered receptor dimerization dynamics due to extracellular binding changes. These results demonstrate how variation in a single cytokine can lead to biased downstream signaling and can thereby cause human disease. Moreover, we have defined a distinct treatable form of anemia through mutation identification and functional studies.

Keywords: JAK2; cytokine; erythropoiesis; erythropoietin; functional selectivity; hematopoiesis; receptor; signaling.


Figures

Figure 1
Figure 1. Autosomal Recessive Pure Red Cell Aplasia Resulting from a Homozygous EPO Mutation
(A) Familial segregation of an EPO mutation in a consanguineous Turkish family. All individuals had mutations confirmed by Sanger sequencing and the inheritance pattern is depicted with half filled squares or circles indicative of heterozygous carrier status. (B) Location of the R150Q EPO mutation in genomic sequence with exome read coverage shown. The mutation is highlighted with a red line in the exome coverage and by a red arrow in the sequence below. (C) Bone marrow aspirate sections showing normal myeloid, lymphoid, and megakaryocyte maturation from the proband. The microscope images of the aspirate were taken with a 100X objective.
Figure 2
Figure 2. Alteration of EPO Receptor Binding Kinetics by the R150Q Mutation
(A) The structure of the EPO receptor (EPOR) asymmetric dimer is shown with the regions on site 1 and site 2 highlighted in the structure. The R150 and S100 residues that were mutated are shown at these sites. (B) A zoomed in view of the structure shows salt bridges formed between the R150 residue on EPO and the side chains on site 1 of EPOR (show in blue). (C) Concentration dependent binding of EPO wild type (WT) and R150Q mutant to immobilized EPOR are shown in black and red, respectively. The binding was measured using surface plasmon resonance. Means ± SEM for four independent experiments are shown. (D) Concentration dependent binding of EPO wild type (WT) and R150Q mutant in the background of the site 2 S100E mutation to immobilized EPOR are shown in black and red, respectively. The binding was measured using surface plasmon resonance. Means ± SEM for two independent experiments are shown. (E) Surface plasmon resonance traces at concentrations of 50 nM for WT and 62.5 nM for R150Q EPO in the S100E mutated background are shown in black and red, respectively, with an overlying 1:1 kinetic fit shown with white dotted lines. Association and dissociation phases are indicated.
Figure 3
Figure 3. The EPO R150Q Mutant Impairs Erythroid Cell Proliferation and Differentiation
(A) Proliferation curves of UT7 cells after 3 days in culture are shown. Means ± SEM for three independent experiments are shown. Sigmoidal fit curves are shown. (B) CD34+ HSPC cell growth during erythroid differentiation is shown. Means ± SEM for 3 independent experiments are shown. **P < 0.01, ***P < 0.001 as determined by the two-tailed Student’s t-test. At Day 7, both R150Q mutant concentrations have a P < 0.001 compared to the WT. (C) Erythroid maturation at different stages assessed from cultures on day 11 of erythroid differentiation. Orthochromatic (OrthoE), polychromatic (PolyE), basophilic (BasoE), or pro-erythroblasts (ProE) were measured. Blasts and other myeloid cells were counted together. Reticulocytes were counted with OrthoEs. Means ± SEM for counts from 5 independent high power fields are shown. **P < 0.01, ***P < 0.001 as determined by the two-tailed Student’s t-test. (D) Representative cytocentrifugation images at 100X magnification are shown at day 11 of erythroid differentiation. (E) Flow cytometric assessment of erythroid differentiation with the markers CD71 and CD235a at day 7 of differentiation. Means ± SEM for 3 independent experiments are shown.
Figure 4
Figure 4. Functional Selectivity in EPO Signaling Revealed by the R150Q Mutant
(A) Percent of STAT5 phosphorylation (pSTAT5) as assessed by intracellular FACS mean fluorescence intensities (MFI) in UT7 cells stimulated for 30 minutes. Means ± SEM for 3 independent experiments are shown at each concentration. Sigmoidal fit curves are shown. (B) Time dependent representative histogram plots of pSTAT5 are shown. No significant differences in replicate samples could be identified between the mutant and WT EPO at maximally potent concentrations. (C) Signaling pathways activated (>50% fold) by either EPO WT or R150Q in UT7 cells within 30 minutes of stimulation. (D) Kernel densities of signaling across all tested pathways are shown for each time point. The unstimulated distribution (0 min) is estimated as a normal distribution with a mean of 1.0 and a SD of 0.05. P-values were determined from 20,000 permutations by randomly swapping EPO WT and R150Q labels and comparing means. (E) At 15 minutes, the top two most differentially activated residues are STAT3 Y705 and STAT1 Y701.
Figure 5
Figure 5. Biased Agonism of STAT Transcription Factors from the R150Q EPO Mutation Arises Due to Impaired JAK2 Activation
(A, B) Percent of STAT3 and STAT1 phosphorylation (pSTAT3 and pSTAT1, respectively) as assessed by intracellular FACS in UT7 cells stimulated for 30 minutes with either the R150Q or WT EPO. Mean ± SEM for 3–4 independent experiments are shown at each concentration. Sigmoidal fit curves are shown. (C) Percent of pSTAT1/3/5 in UT7 cells following treatment with NSC87877 (SHP1/2 inhibitor). Mean ± SEM for 3 independent experiments are shown at each concentration. The 100% level of phosphorylation is based on assessment of untreated samples. (D) Percent of pSTAT1/3/5 in UT7 cells following treatment with ruxolitinib (JAK2 inhibitor). Mean ± SEM for 3 independent experiments are shown at each concentration. The 100% level of phosphorylation is based on assessment of untreated samples. Sigmoidal fit curves are shown. (E) Proliferation curves of UT7 cells of with various concentrations of ruxolitinib with EPO WT (10−9M) after 3 days in culture are shown. Means ± SEM for 3 independent experiments are shown. A sigmoidal fit curve is shown. (F) Proliferation curves of UT7 cells at different concentrations of EPO WT or R150Q either in the presence of vehicle (DMSO) or ruxolitinib (Ruxo, 40 nM) after 3 days in culture are shown. Means ± SEM for 3 independent experiments are shown. Sigmoidal fit curves are shown. (G) Percent of pSTAT1/3/5 in UT7 cells treated with or without a low dose of ruxolitinib (40 nM) and with maximally potent concentrations of either the WT (10−9 M) or R150Q mutated EPO (10−7 M). Means ± SEM for 3 experiments are shown.
Figure 6
Figure 6. Dimerization of EPOR at the Cell Surface is Impaired for Mutant EPO
(A) Model of assembly and cell-surface labeling of EPOR using dye-conjugated anti-GFP nanobodies. (B) Trajectories (150 frames, ~4.8 s) of individual Rho11-labeled (red) and DY647-labeled EpoR (blue) and co-trajectories (magenta) for unstimulated cells, as well as after stimulation with indicated EPO mutants and concentrations. (C) Relative amount of co-trajectories for unstimulated EPOR and after stimulation with indicated EPO mutants and concentrations. Box plots indicate the data distribution of the second and third quartile (box), median (line), mean (open squares), and whiskers (1.5X interquartile range). A comparison between maximally potent concentrations of EPO WT and R150Q is shown. *P = 0.012.
Figure 7
Figure 7. Recombinant Cytokine Therapy in an Infant with the EPO R150Q Mutation
(A) Updated pedigree of the family examined here after the birth of an infant affected with reticulocytopenic anemia (please note that the proband has passed away of bone marrow transplant related complications prior to the birth of this child). (B) Sanger sequence traces showing the presence of the homozygous mutation in the EPO gene (chr7:100320704 G>A) in the newborn infant sibling of the proband and a control healthy donor control. Sequencing was also re-confirmed in DNA samples from all family members. (C) Time dependent changes in hemoglobin levels, RBC counts, and reticulocyte counts in the affected infant sibling of the proband (newborn). The x-axis shows the infant’s age in days. The box highlighting recombinant EPO therapy begins at day of life 153, when the first injection of this medication was given subcutaneously to the patient.

References

    1. Bunn HF. Erythropoietin. Cold Spring Harb Perspect Med. 2013;3:a011619. - PMC - PubMed
    1. Casanova JL, Conley ME, Seligman SJ, Abel L, Notarangelo LD. Guidelines for genetic studies in single patients: lessons from primary immunodeficiencies. J Exp Med. 2014;211:2137–2149. - PMC - PubMed
    1. Chen L, Sung SS, Yip ML, Lawrence HR, Ren Y, Guida WC, Sebti SM, Lawrence NJ, Wu J. Discovery of a novel shp2 protein tyrosine phosphatase inhibitor. Mol Pharmacol. 2006;70:562–570. - PubMed
    1. Chen Y, Wen R, Yang S, Schuman J, Zhang EE, Yi T, Feng GS, Wang D. Identification of Shp-2 as a Stat5A phosphatase. J Biol Chem. 2003;278:16520–16527. - PubMed
    1. Danilova N, Gazda HT. Ribosomopathies: how a common root can cause a tree of pathologies. Dis Model Mech. 2015;8:1013–1026. - PMC - PubMed

Publication types