. 2017 May 11;129(19):2657-2666.
doi: 10.1182/blood-2016-10-741207. Epub 2017 Mar 10.

Leveraging increased cytoplasmic nucleoside kinase activity to target mtDNA and oxidative phosphorylation in AML

Affiliations

Leveraging increased cytoplasmic nucleoside kinase activity to target mtDNA and oxidative phosphorylation in AML

Sanduni U Liyanage et al. Blood. .

Abstract

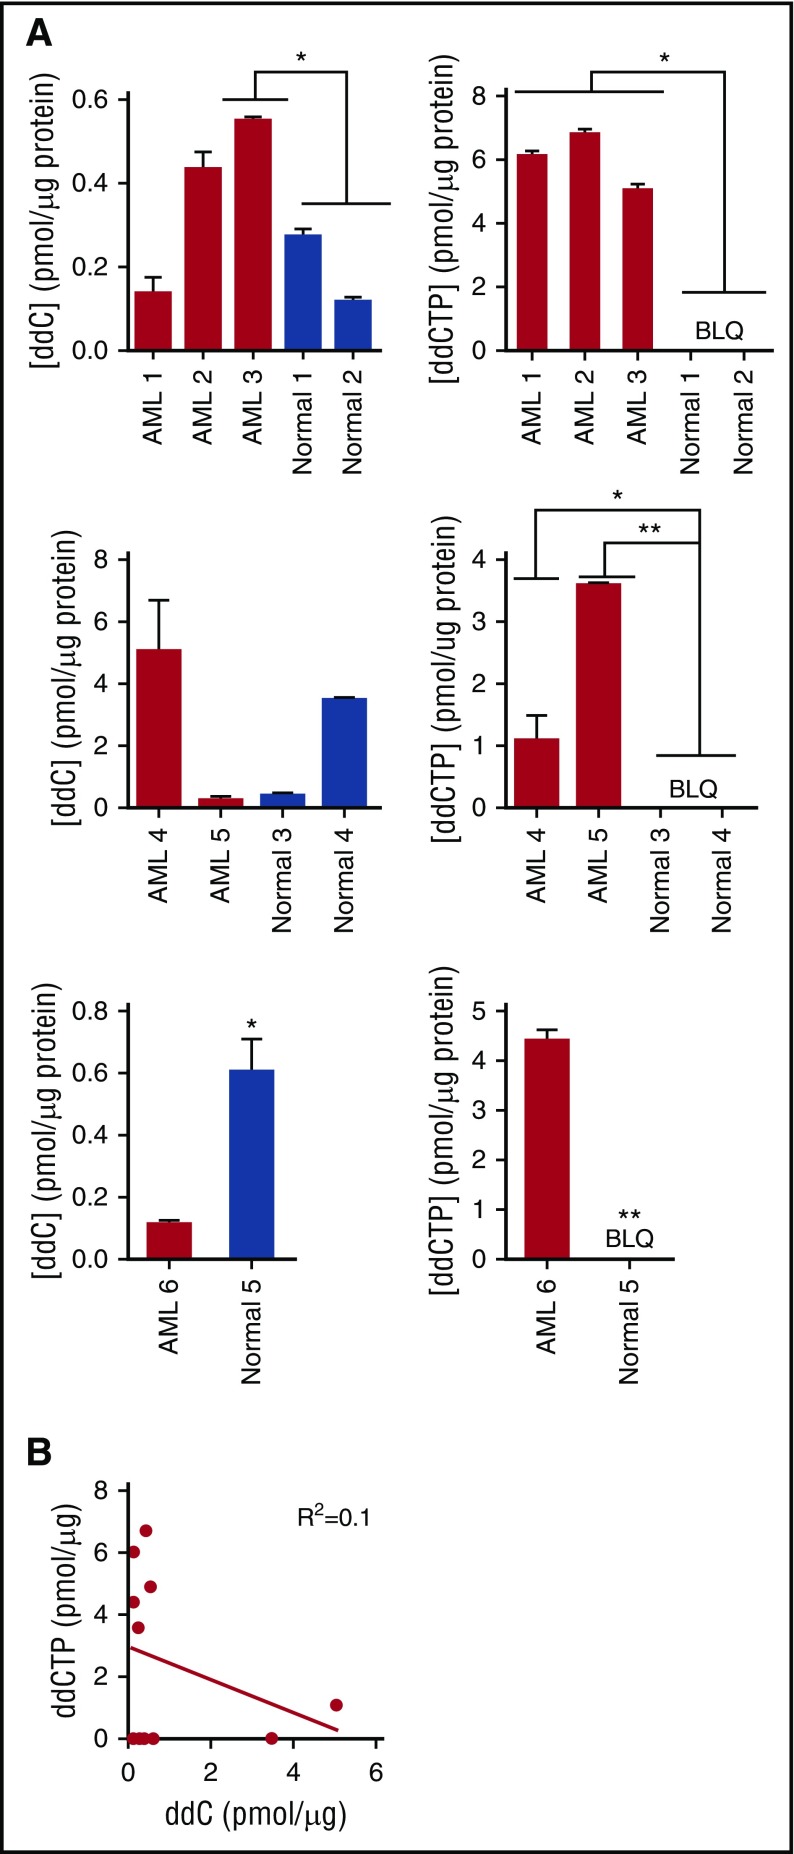
Mitochondrial DNA (mtDNA) biosynthesis requires replication factors and adequate nucleotide pools from the mitochondria and cytoplasm. We performed gene expression profiling analysis of 542 human acute myeloid leukemia (AML) samples and identified 55% with upregulated mtDNA biosynthesis pathway expression compared with normal hematopoietic cells. Genes that support mitochondrial nucleotide pools, including mitochondrial nucleotide transporters and a subset of cytoplasmic nucleoside kinases, were also increased in AML compared with normal hematopoietic samples. Knockdown of cytoplasmic nucleoside kinases reduced mtDNA levels in AML cells, demonstrating their contribution in maintaining mtDNA. To assess cytoplasmic nucleoside kinase pathway activity, we used a nucleoside analog 2'3'-dideoxycytidine (ddC), which is phosphorylated to the activated antimetabolite, 2'3'-dideoxycytidine triphosphate by cytoplasmic nucleoside kinases. ddC is a selective inhibitor of the mitochondrial DNA polymerase γ. ddC was preferentially activated in AML cells compared with normal hematopoietic progenitor cells. ddC treatment inhibited mtDNA replication, oxidative phosphorylation, and induced cytotoxicity in a panel of AML cell lines. Furthermore, ddC preferentially inhibited mtDNA replication in a subset of primary human leukemia cells and selectively targeted leukemia cells while sparing normal progenitor cells. In animal models of human AML, treatment with ddC decreased mtDNA, electron transport chain proteins, and induced tumor regression without toxicity. ddC also targeted leukemic stem cells in secondary AML xenotransplantation assays. Thus, AML cells have increased cytidine nucleoside kinase activity that regulates mtDNA biogenesis and can be leveraged to selectively target oxidative phosphorylation in AML.


Figures

Figure 1.
Figure 1.
Subsets of AML display upregulated mtDNA biosynthesis and cytoplasmic nucleoside kinase expression. (A) Expression pattern and hierarchical clustering of microarray data from 542 primary human AML and 73 normal nonleukemic and healthy bone marrow samples for 8 mtDNA biosynthesis genes. The 4 main AML mtDNA biosynthesis clusters (purple, green, red, cyan) were designated as 1, 2, 3, and 4. A red color indicates a higher expression compared with the mean of all AML and normal samples; a blue color indicates a lower expression. (B) Boxplot of scaled data distribution (z-score) of the 4 AML clusters and normal samples for each of the 8 mtDNA biosynthesis genes from panel A. Values displayed on boxplot indicate median z-score values. Two-sided t tests were applied to estimate significance of differences between AML and normal clusters. (C-D) Boxplot of scaled data distribution (z-score) of cytoplasmic nucleoside kinases CMPK1 (C) and NME1-2 (D) between the 542 primary human AML and the 73 normal samples. Two-sided t test was applied to estimate significance of differences between these 2 groups. (E) Total proteins were extracted and immunoblotted for POLG, cytoplasmic nucleoside kinases CMPK1 and NME2, and loading control glyceraldehyde-3-phosphate dehydrogenase (GAPDH) in 12 human primary AML cells (A1-A12) and 5 normal G-CSF–mobilized PBSCs.
Figure 2.
Figure 2.
Cytoplasmic nucleoside kinases regulate mtDNA levels. DCK (A), TK1 (B), CMPK1 (C), and TFAM (D) were knocked down with shRNA in TEX and OCI-AML2 cells as described in “Materials and methods.” After target knockdown, mtDNA content was assessed by quantitative reverse transcription polymerase chain reaction (qRT-PCR) using primers for mt-ND1 relative to nuclear-encoded HGB. Immunoblots are displayed in supplemental Figure 3. Data are shown as mean ± standard deviation (SD) of 3 independent experiments. *P < .05, **P < .01, ***P < .001, and ****P < .0001 using the Bonferroni posttest after 1-way ANOVA. NS, not significant.
Figure 3.
Figure 3.
Cytoplasmic nucleoside kinase activity is elevated in AML. (A) Relative quantification of total intracellular ddC and ddCTP by LC-MS/MS in primary human AML (samples B1-B6) and normal hematopoietic progenitor samples following treatment with 2 µM ddC for 6 days. ddC and ddCTP content were normalized to total protein input and represented as mean ± SD (n = 2) of technical replicates within each independent experiment. Levels of ddC and ddCTP in each panel represent semiquantitative values. Each panel represents a separate experiment. Differences between ddC or ddCTP levels in each AML sample compared with mean of normal samples within an experiment was assessed using the Bonferroni posttest after 1-way ANOVA or the Student t test. *P < .05, ***P < .001. (B) Correlation between levels of ddC and ddCTP from samples in panel A was determined using the Pearson correlation method. BLQ, below the limit of quantification.
Figure 4.
Figure 4.
DCK knockdown reduces levels of ddCTP. (A) DCK was knocked down in TEX cells using shRNA. Levels of DCK were measured in whole-cell lysates by immunoblotting 7 days posttransduction. A representative immunoblot is displayed. (B-C) Quantification of total intracellular ddC and ddCTP by LC-MS/MS in DCK knockdown or control shRNA TEX cells following treatment with 1 µM ddC for 4 days. ddC and ddCTP levels were normalized to 106 cells input. Data are shown as mean ± SD of 2 biological replicates performed at least in triplicate. NS, not significant.
Figure 5.
Figure 5.
ddC depletes mtDNA and its encoded proteins, inhibits oxidative phosphorylation, and induces preferential antileukemic effects. (A) TEX and OCI-AML2 cells were treated with ddC for 3 and 6 days. Relative mtDNA content was assessed by qRT-PCR as described in “Materials and methods.” Mean ± SD; n = 3. (B) Effect of ddC treatment on protein levels of mitochondrial COX I (mt-COX I), mt-COXII, nuclear COX IV (nu-COX IV), and β-tubulin in whole-cell extracts of TEX and OCI-AML2 cells. The immunoblot from a representative experiment is shown. (C-D) Basal OCR was assessed in TEX and OCI-AML2 cells following ddC treatment of 3 and 6 days, respectively, using the Seahorse XF96 Metabolic Flux Assay. Mean ± SD; n = 3. (E-F) Effect of ddC on cell viability and proliferation in TEX and OCI-AML2 cells. Cell viability was assessed by trypan blue exclusion staining. Mean ± SEM; n = 3. (G) Primary leukemia and normal hematopoietic progenitor cells (G-CSF–mobilized PBSCs) were treated with 2 µM ddC for 6 days. mtDNA content was assessed by qRT-PCR. Leukemia samples C1-C9 were used for analysis. (H) Normal PBSCs were treated with 2 µM ddC for 6 days and sorted for the CD34+ subpopulation using immunomagnetic selection. mtDNA content was assessed in CD34+ population by qRT-PCR. (I) Cell viability was assessed by trypan blue exclusion staining in primary AML cells and Cyquant DNA staining for PBSCs from panel G. Dotted line indicates the cutoff to stratify samples as ddC-sensitive or ddC-resistant. (J) Normal PBSCs were treated with 2 µM ddC for 6 days and cell viability was assessed by propidium iodide (PI) staining in CD34+ subpopulation by flow cytometry. For all experiments, *P < .05, **P < .01, ***P < .001, and ****P < .0001 using the Bonferroni posttest after 1-way ANOVA. The Student t test was applied to panels G-J. DMSO, dimethyl sulfoxide.
Figure 6.
Figure 6.
ddC displays efficacy in mouse models of human AML. (A-B) OCI-AML2 cells were injected subcutaneously into the flank of SCID mice. Mice were treated with ddC (35 or 75 mg/kg per day by i.p. injection) or vehicle control for 11 days (n = 8 per group). Tumor volume (A) and weight (B) were assessed from excised tumors. Mean ± SD. (C) Relative mtDNA was assessed from xenograft tumors excised from ddC or vehicle-treated mice in panel A by qRT-PCR. Mean ± SD; n = 3 per group. (D) Relative mRNA expression for mt-COX I and mt-COX II was assessed by qRT-PCR in tumors excised from mice treated with 300 mg/kg per day of ddC or vehicle control for 11 days. Mean ± SD; n = 3 per group. (E) Protein levels of mt-COX II, nu-COX IV, and VDAC from whole-cell extracts of tumors from panel A were assessed by immunoblotting. For all experiments, *P < .05, ***P < .001, ****P < .0001 using the Bonferroni posttest after 1-way ANOVA in panels A-C, and the Student t test in panel D.
Figure 7.
Figure 7.
ddC targets bulk and LSCs in vivo. (A-C) Three primary human AML cell samples were injected intrafemorally into irradiated female NOD/SCID mice. Mice were treated with 75 mg/kg per day of ddC by i.p. injection or vehicle control on day 11 for 3 weeks (n = 7 per group). Following treatment, human leukemia cell engraftment in the left femur was assessed by flow cytometry of human CD45+CD33+CD19 cells. (D) Secondary engraftment was assessed by injecting viable leukemia cells from the bone marrow of ddC-treated and vehicle mice and injected into the right femur of irradiated female NOD/SCID mice, which remained untreated. Five weeks later, human leukemia cell engraftment in the left femur was measured by flow cytometry of human CD45+CD33+CD19 cells. Line represents mean engraftment of human cells. For all experiments, *P < .05, **P < .01, ****P < .0001 using the Student t test.

Comment in

  • A mitochondrial drug to treat AML.
    Pinton P. Pinton P. Blood. 2017 May 11;129(19):2597-2599. doi: 10.1182/blood-2017-03-773200. Blood. 2017. PMID: 28495924 No abstract available.

Similar articles

Cited by

References

    1. Lagadinou ED, Sach A, Callahan K, et al. . BCL-2 inhibition targets oxidative phosphorylation and selectively eradicates quiescent human leukemia stem cells. Cell Stem Cell. 2013;12(3):329-341. - PMC - PubMed
    1. Škrtić M, Sriskanthadevan S, Jhas B, et al. . Inhibition of mitochondrial translation as a therapeutic strategy for human acute myeloid leukemia. Cancer Cell. 2011;20(5):674-688. - PMC - PubMed
    1. Sriskanthadevan S, Jeyaraju DV, Chung TE, et al. . AML cells have low spare reserve capacity in their respiratory chain that renders them susceptible to oxidative metabolic stress. Blood. 2015;125(13):2120-2130. - PMC - PubMed
    1. Nunnari J, Suomalainen A. Mitochondria: in sickness and in health. Cell. 2012;148(6):1145-1159. - PMC - PubMed
    1. Copeland WC. Defects in mitochondrial DNA replication and human disease. Crit Rev Biochem Mol Biol. 2012;47(1):64-74. - PMC - PubMed

Publication types