. 2017 Apr;76(4):740-747.
doi: 10.1136/annrheumdis-2016-209850. Epub 2016 Nov 9.

Targeting the RhoA-ROCK pathway to reverse T-cell dysfunction in SLE

Affiliations

Targeting the RhoA-ROCK pathway to reverse T-cell dysfunction in SLE

Cristina Rozo et al. Ann Rheum Dis. 2017 Apr.

Abstract

Objectives: Deregulated production of interleukin (IL)-17 and IL-21 contributes to the pathogenesis of autoimmune disorders such as systemic lupus erythematosus (SLE) and rheumatoid arthritis (RA). Production of IL-17 and IL-21 can be regulated by ROCK2, one of the two Rho kinases. Increased ROCK activation was previously observed in an SLE cohort. Here, we evaluated ROCK activity in a new SLE cohort, and an RA cohort, and assessed the ability of distinct inhibitors of the ROCK pathway to suppress production of IL-17 and IL-21 by SLE T cells or human Th17 cells.

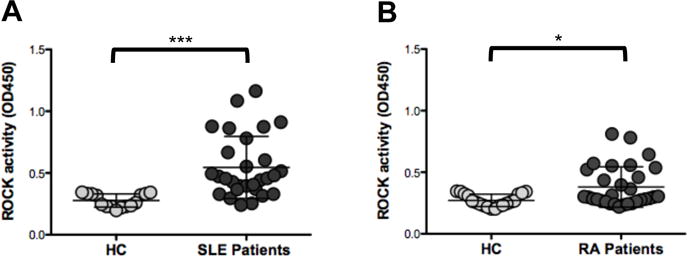
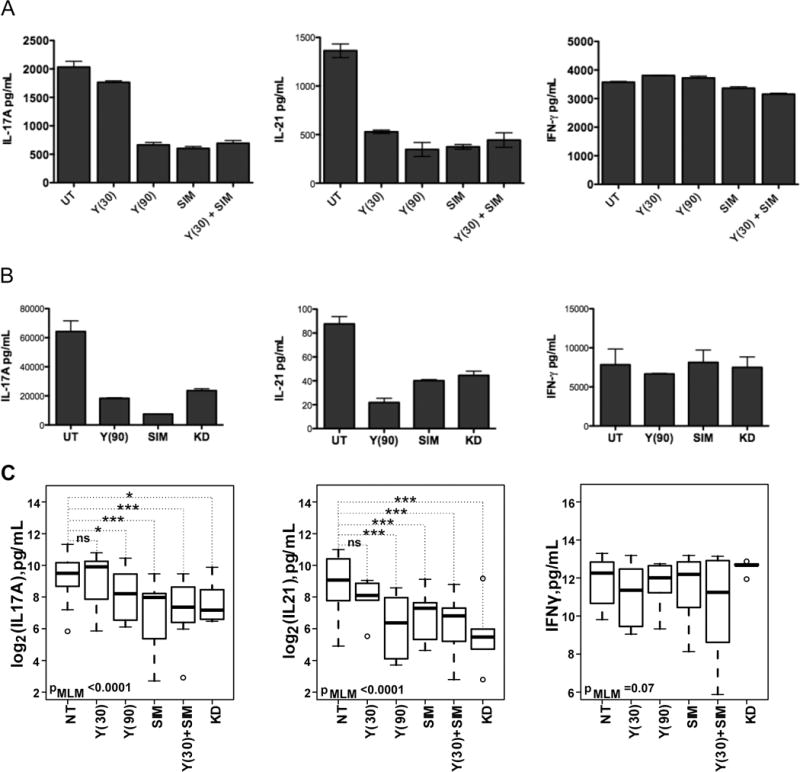
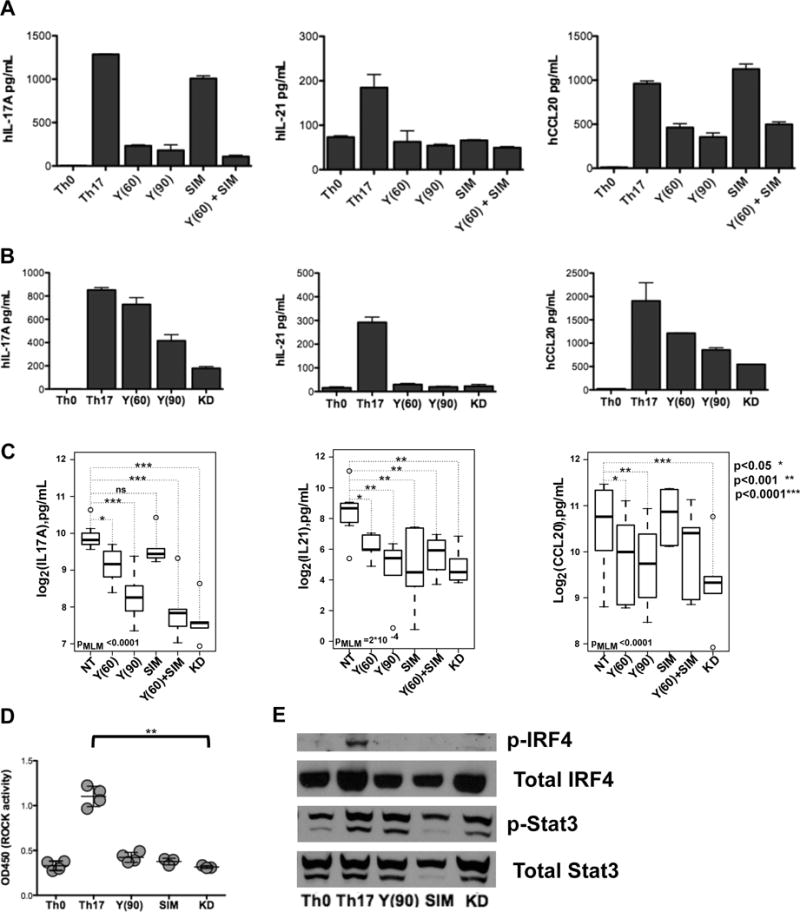
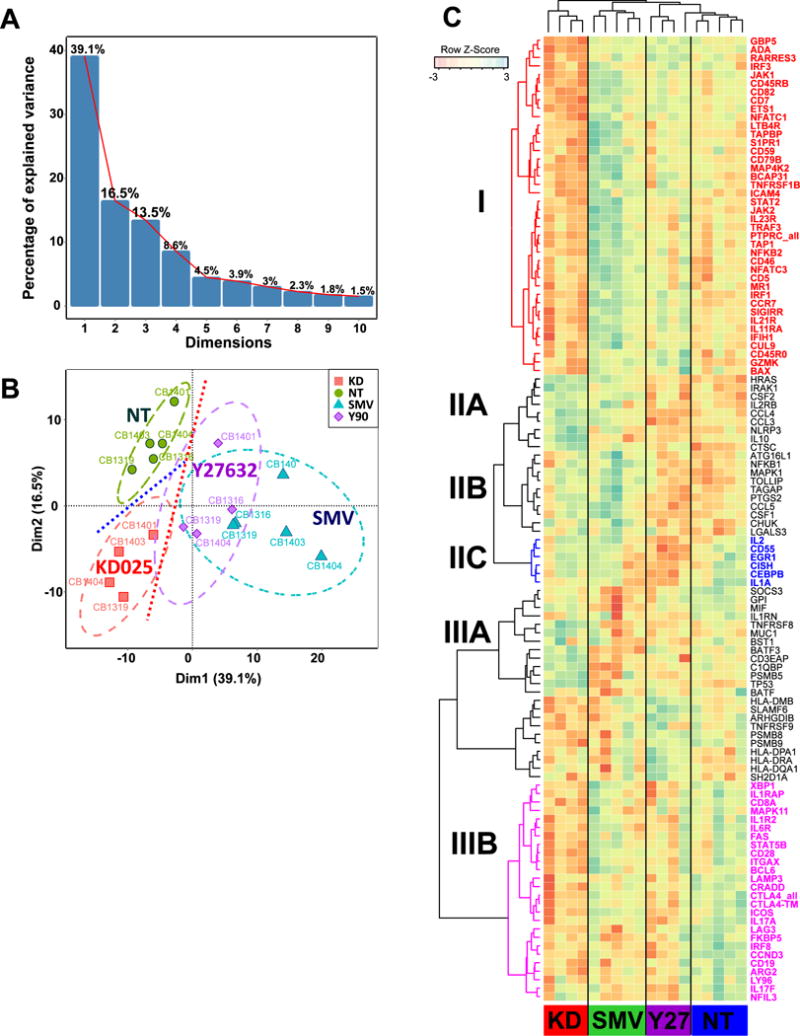
Methods: ROCK activity in peripheral blood mononuclear cells (PBMCs) from 29 patients with SLE, 31 patients with RA and 28 healthy controls was determined by ELISA. SLE T cells or in vitro-differentiated Th17 cells were treated with Y27632 (a pan-ROCK inhibitor), KD025 (a selective ROCK2 inhibitor) or simvastatin (which inhibits RhoA, a major ROCK activator). ROCK activity and IL-17 and IL-21 production were assessed. The transcriptional profile altered by ROCK inhibitors was evaluated by NanoString technology.

Results: ROCK activity levels were significantly higher in patients with SLE and RA than healthy controls. Th17 cells exhibited high ROCK activity that was inhibited by Y27632, KD025 or simvastatin; each also decreased IL-17 and IL-21 production by purified SLE T cells or Th17 cells. Immune profiling revealed both overlapping and distinct effects of the different ROCK inhibitors.

Conclusions: ROCK activity is elevated in PBMCs from patients with SLE and RA. Production of IL-17 and IL-21 by SLE T cells or Th17 cells can furthermore be inhibited by targeting the RhoA-ROCK pathway via both non-selective and selective approaches.

Keywords: Autoimmunity; Systemic Lupus Erythematosus; T Cells.


Conflict of interest statement

Competing Interests ABP and JES received an Investigator-Initiated grant from Kadmon Corporation

Figures

Figure 1
Figure 1. Increased ROCK kinase activity in SLE and RA PBMCs compared to HC PBMCs
PBMCs were isolated from heparinized blood samples of 29 SLE patients (A) and 31 RA patients (B). PBMCs f rom healthy controls of similar ethnicity/race, sex and age ± 5 years (Table 1) for each of the disease group were also assayed. Whole cell extracts were prepared and ROCK activation was assessed by an ELISA-based ROCK kinase activity assay. Active ROCK2 (1-4ng) was used a positive control. Data were analyzed by Kruskal-Wallis test (χ2 = 26.25, p<0.0001) followed by the Dunns Multiple Comparison analysis (HC vs RA p= 0.087, RA vs SLE **p<0.01, HC vs SLE ***p<0.001).
Figure 2
Figure 2. Decreased hIL-17A, hIL-21, and hIFN-γ production by SLE CD4+ T cells treated with ROCK inhibitors
CD4+ T cells were isolated from SLE PBMCs and cultured with plate-bound anti-CD3 and anti-CD28 stimulation in X-VIVO15 media. One day later, CD4+ T cells were treated with (A) Y27632, simvastatin or Y27632 plus simvastatin or (B) Y27632 or simvastatin or KD025. Supernatants and cells were collected on day 4 and super atant levels of hIL-17, hIL-21 and hIFN-γ production were assessed. Shown is one representative experiment. (C) The inhibition of hIL-17A, hIL-21 and hCCL20 production by each inhibitor and the combination thereof was fitted to a mixed linear model. P-values from the likelihood ratio test comparing the null model with only the random effect of patients with the complete model that includes all treatments is shown on each panel. The p-values for individual treatment were calculated as described in the Materials and Methods Y(30): 30μM Y-27632, Y(90): 90μM Y-27632, SIM: 0.2μM simvastatin, KD: 5.0μM KD025.
Figure 3
Figure 3. ROCK inhibitors decrease hIL-17A, hIL-21 and hCCL20 production by in vitro differentiated Th17 cells
Human umbilical cord CD4+ T cells (106 cells/well) were cultured under Th0 or Th17-polarizing conditions for two days and then treated with (A) Y27632, simvastatin or Y27632 plus simvastatin or (B) Y27632 or KD025. Supernatants and cells were collected on day 4 and supernatant levels of hIL-17A, hIL-21 and hCCL20 were assessed. Shown is one representative experiment. (C) The inhibition of hIL-17A, hIL-21 and hCCL20 production by each inhibitor and the combination thereof was fitted to a mixed linear model. P-values from the likelihood ratio test comparing the null model with only the random effect of patients with the complete model that includes all treatments is shown on each panel. The p-values for individual treatment were calculated as described in the Materials and Methods. (D) Whole cell extracts were prepared and ROCK activity was measured. Shown are 3-4 independent experiments. Data were analyzed by Kruskal-Wallis test (χ2 = 13.48, p<0.009) followed by the Dunns Multiple Comparison analysis (**p<0.01). (E) Phosphorylation of Stat3 protein was assessed by western blotting, blots were stripped and reprobed for phosphorylation of IRF4 protein, then subsequently stripped and reprobed for total Stat3, and total IRF4 respectively. Y(60): 60μM Y-27632, Y(90): 90μM Y-27632, SIM: 0.1 μM simvastatin, KD: 5.0μM KD025.
Figure 4
Figure 4. KD025 and Y27632 regulate distinct subset of immune-relevant genes
Following preliminary low-stringency NanoString screening for genes differentially expressed in Th17 cells treated with KD025, Y27632 we performed principal component analysis of independent cell samples (the sample coding is shown next to the data points) with gene expression as variables. (A) The first four principal components (PC) explain 77.7% of variance. (B) The first PC separates Y27632/SMV-treated Th17 cells from untreated (NT) and KD025-treated Th17 cells, whereas the second PC separates KD025-treated and NT cells. (C) Unsupervised hierarchical clustering were used to define the group of co-regulated genes I Th17 cells following treatments with Y27632, SMV or KD025 in comparison to not-treated cells. Genes specifically downregulated in KD025-treated cells (Cluster I) are shown in red, cluster IIC that contains a group of genes specifically downregulated by Y27632 is shown in blue, and cluster IIIB combines genes downregulated in Th17 cells treated with either Y27632 or KD025

References

    1. Craft JE. Follicular helper T cells in immunity and systemic autoimmunity. Nature reviews Rheumatology. 2012;8(6):337–47. - PMC - PubMed
    1. Crispin JC, Tsokos GC. Interleukin-17-producing T cells in lupus. Curr Opin Rheumatol. 2010;22(5):499–503. - PubMed
    1. Pernis AB. Th17 cells in rheumatoid arthritis and systemic lupus erythematosus. J Intern Med. 2009;265(6):644–52. - PubMed
    1. Burmester GR, Feist E, Dorner T. Emerging cell and cytokine targets in rheumatoid arthritis. Nat Rev Rheumatol. 2014;10(2):77–88. - PubMed
    1. Gaffen SL, Jain R, Garg AV, et al. The IL-23-IL-17 immune axis: from mechanisms to therapeutic testing. Nat Rev Immunol. 2014;14(9):585–600. - PMC - PubMed

MeSH terms