. 2017 May 1;312(5):H919-H931.
doi: 10.1152/ajpheart.00425.2016. Epub 2017 Mar 10.

Effects of β-adrenergic receptor drugs on embryonic ventricular cell proliferation and differentiation and their impact on donor cell transplantation

Affiliations

Effects of β-adrenergic receptor drugs on embryonic ventricular cell proliferation and differentiation and their impact on donor cell transplantation

Tiam Feridooni et al. Am J Physiol Heart Circ Physiol. .

Abstract

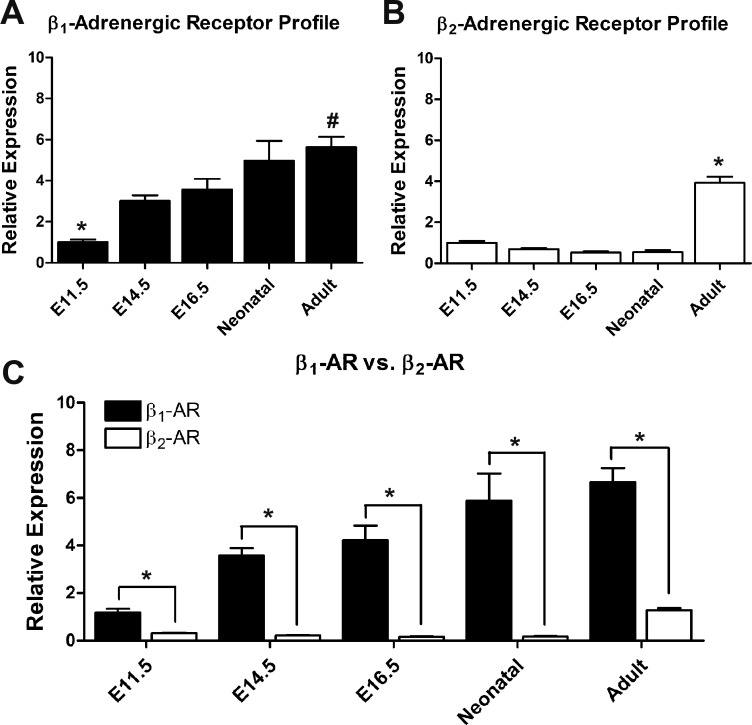
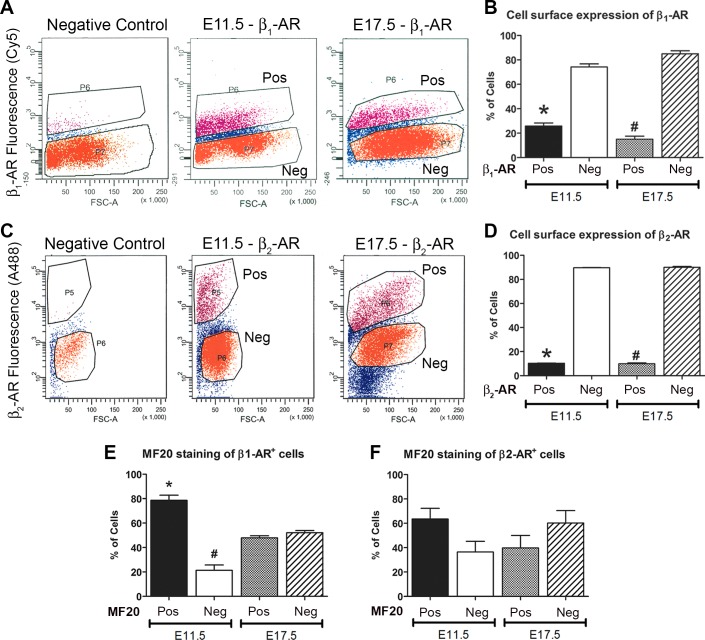
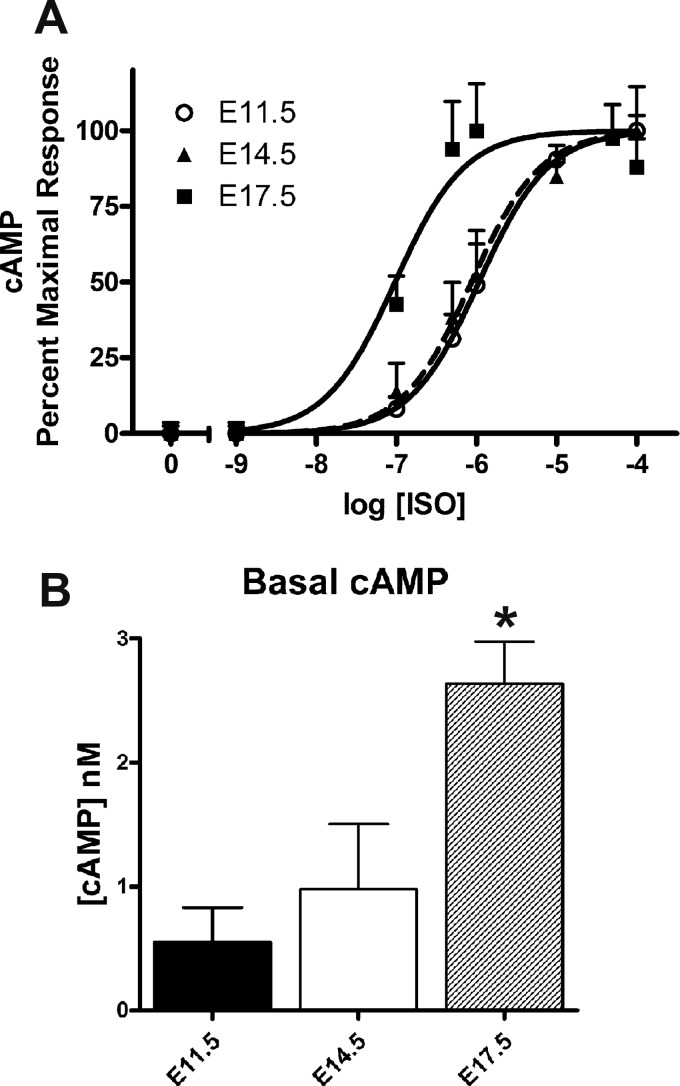
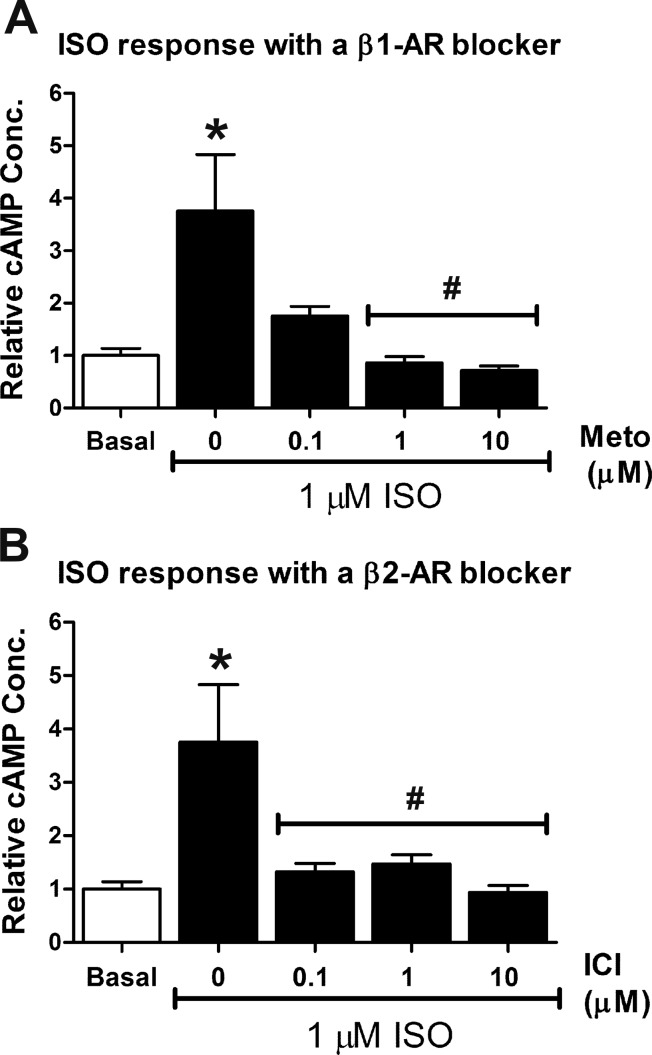
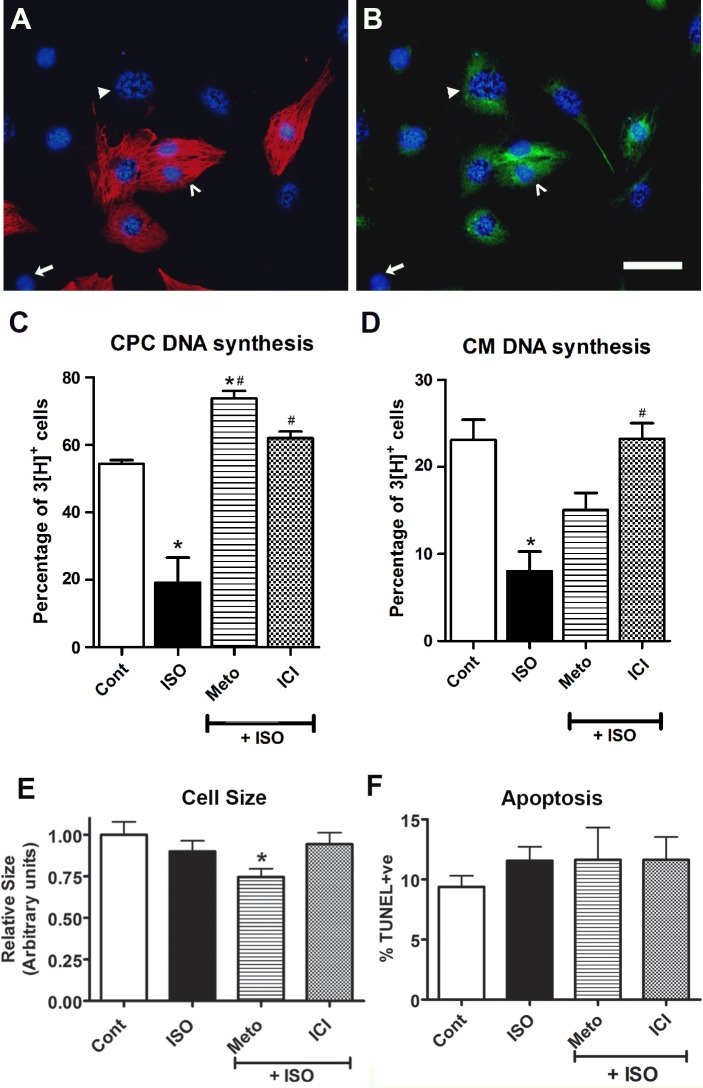
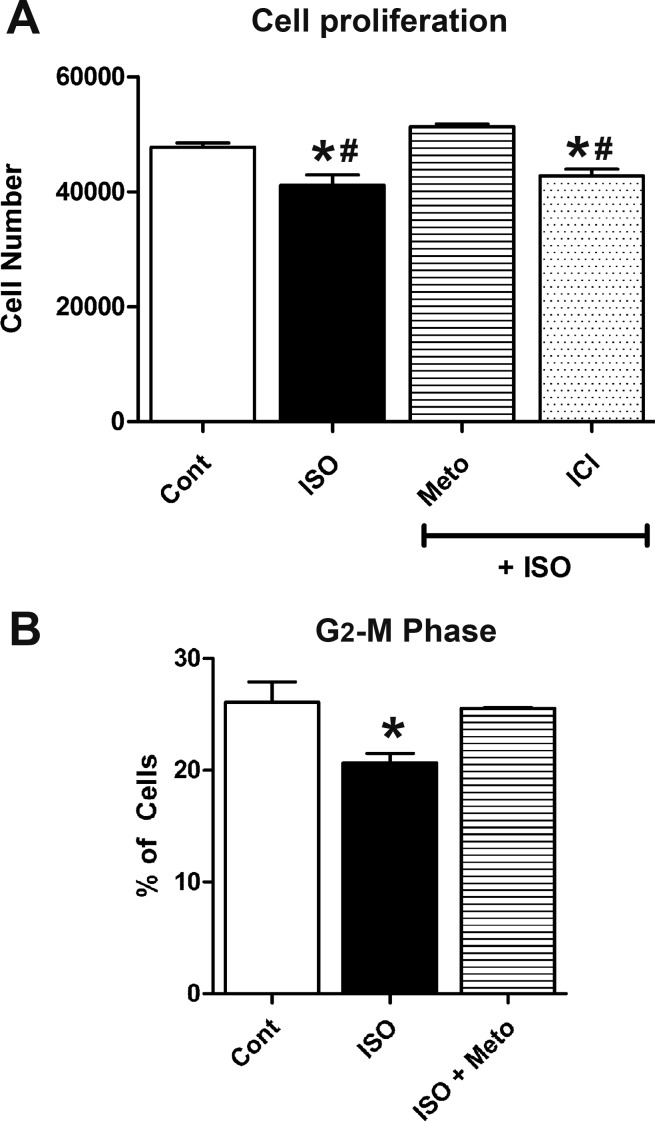
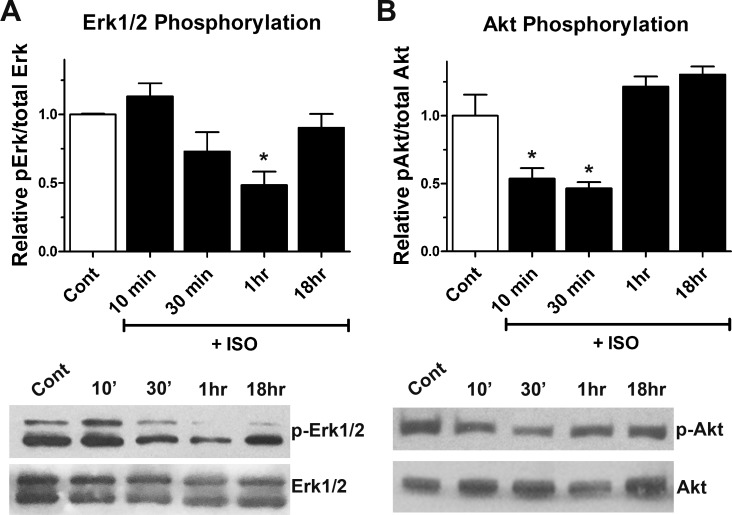
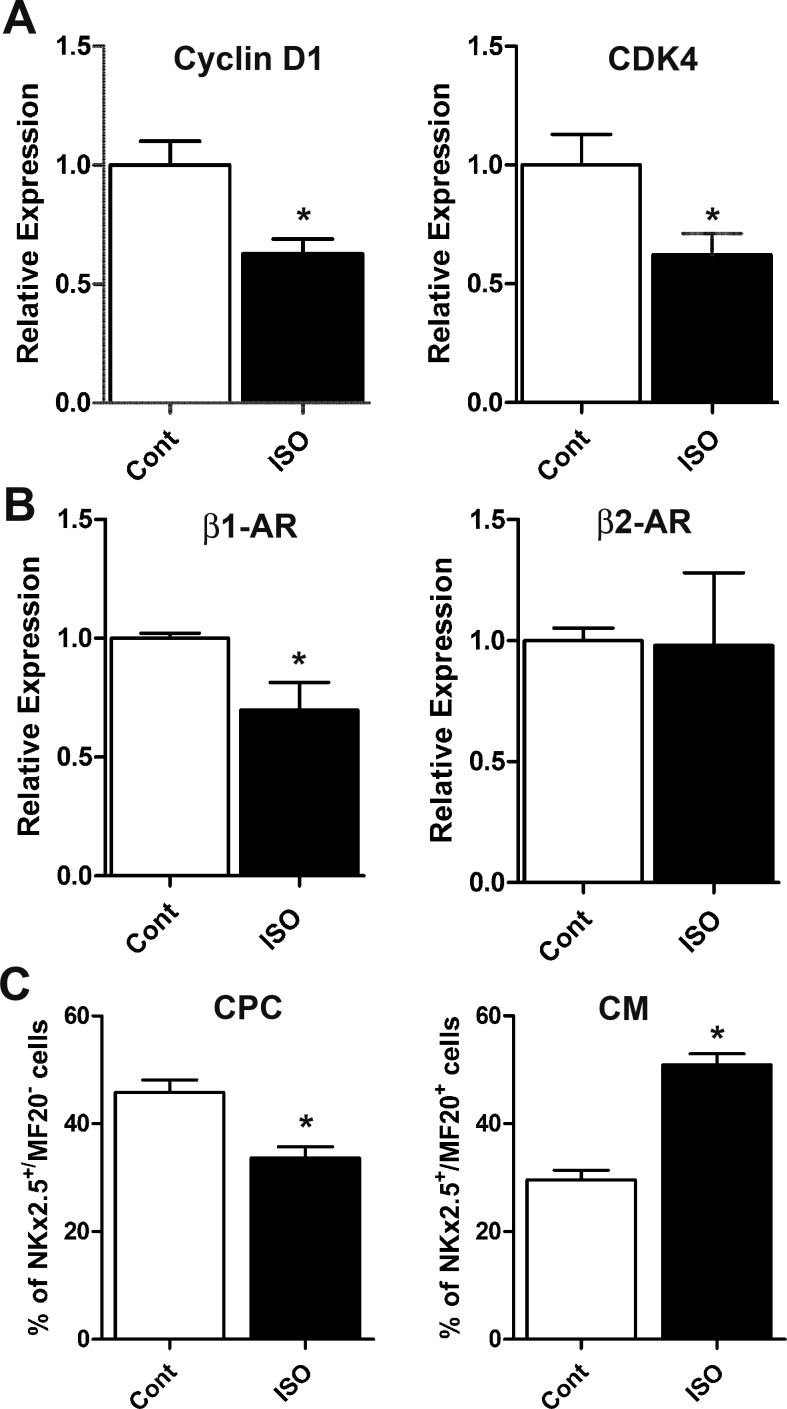
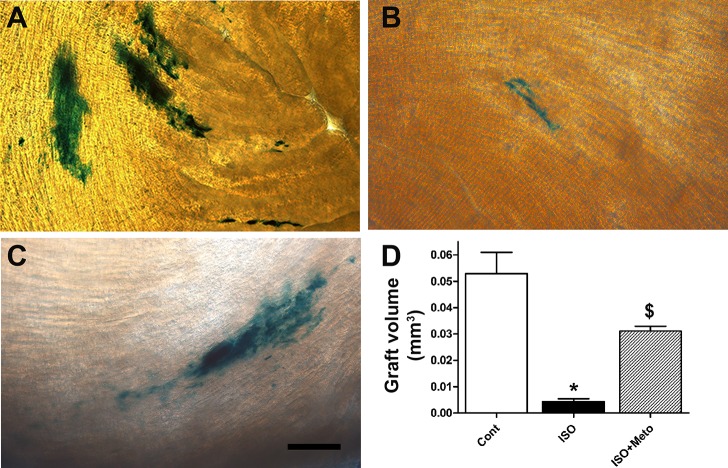
β-Adrenergic receptors (β-ARs) and catecholamines are present in rodents as early as embryonic day (E)10.5. However, it is not known whether β-AR signaling plays any role in the proliferation and differentiation of ventricular cells in the embryonic heart. Here, we characterized expression profiles of β-AR subtypes and established dose-response curves for the nonselective β-AR agonist isoproterenol (ISO) in the developing mouse ventricular cells. Furthermore, we investigated the effects of ISO on cell cycle activity and differentiation of cultured E11.5 ventricular cells. ISO treatment significantly reduced tritiated thymidine incorporation and cell proliferation rates in both cardiac progenitor cell and cardiomyocyte populations. The ISO-mediated effects on DNA synthesis could be abolished by cotreatment of E11.5 cultures with either metoprolol (a β1-AR antagonist) or ICI-118,551 (a β2-AR antagonist). In contrast, ISO-mediated effects on cell proliferation could be abolished only by metoprolol. Furthermore, ISO treatment significantly increased the percentage of differentiated cardiomyocytes compared with that in control cultures. Additional experiments revealed that β-AR stimulation leads to downregulation of Erk and Akt phosphorylation followed by significant decreases in cyclin D1 and cyclin-dependent kinase 4 levels in E11.5 ventricular cells. Consistent with in vitro results, we found that chronic stimulation of recipient mice with ISO after intracardiac cell transplantation significantly decreased graft size, whereas metoprolol protected grafts from the inhibitory effects of systemic catecholamines. Collectively, these results underscore the effects of β-AR signaling in cardiac development as well as graft expansion after cell transplantation.NEW & NOTEWORTHY β-Adrenergic receptor (β-AR) stimulation can decrease the proliferation of embryonic ventricular cells in vitro and reduce the graft size after intracardiac cell transplantation. In contrast, β1-AR antagonists can abrogate the antiproliferative effects mediated by β-AR stimulation and increase graft size. These results highlight potential interactions between adrenergic drugs and cell transplantation.

Keywords: donor cells and drug interactions; embryonic ventricular cells; intracardiac cell transplantation; proliferation and differentiation; β-adrenergic receptor drugs.


Figures

Fig. 1.
Fig. 1.
Quantification of mRNA levels of β1- and β2-adrenergic receptors (ARs) during ontogeny of cardiac ventricles. A and B: relative expression levels of β1- and β2-ARs in different developmental stages of cardiac ventricles by quantitative PCR analysis. The relative expression of β1- and β2-ARs was determined in relation to the embryonic day (E)11.5 stage. A: *P < 0.05 compared with all stages, #P < 0.05 adult vs. E11.5, E14.5 and E16.5; B: *P < 0.05 compared with all stages (one-way ANOVA, Tukey's multiple-comparisons test). C: comparison of β1- and β2-AR expression levels at each developmental stage. Expression levels were normalized to GAPDH. *P < 0.05, β1-AR vs. β2-AR by unpaired Student’s t-test. Each bar represents means ± SE, n = 3 independent RNA extractions/developmental stage, analyzed in duplicate for each extraction.
Fig. 2.
Fig. 2.
Characterization of cell surface expression of β1- and β2-ARs in embryonic ventricular cells. A and C: scatterplots of FACS-sorted E11.5 and E17.5 ventricular cells stained with extracellular domain-specific β1-AR (A) or β2-AR (C) antibodies. Negative control represents unstained E11.5 cells lacking the β1-AR antibody (A) or β2-AR antibody (C). B and D: relative distribution of β1-AR (B) or β2-AR (D) positive (Pos) and negative (Neg) cells in E11.5 and E17.5 ventricular cell preparations. B: *P < 0.005, E11.5 β1-AR Pos vs. E11.5 β1-AR Neg and E17.5 β1-AR Neg; #P < 0.005, E17.5 β2-AR Pos vs. E17.5 β2-AR Neg and E11.5 β2-AR Neg; D: *P < 0.005, E11.5 β2-AR Pos vs. E11.5 β2-AR Neg; #P < 0.005, E17.5 β2-AR Pos vs. E17.5 β2-AR Neg. E and F: relative distribution of MF20 Pos and Neg cells in β1-AR Pos (E; *P < 0.005, E11.5 β1-AR Pos/MF20 Pos vs. all other groups; #P < 0.05 E11.5 β1-AR Pos/MF20 Neg vs. all other groups) or β2-AR Pos (F) FACS-sorted cell fractions from E11.5 and E17.5 ventricular cells. In B and DF, one-way ANOVA, Tukey’s multiple-comparisons test. Each bar represents means ± SE, n = 3 independent experiments.
Fig. 3.
Fig. 3.
cAMP levels in embryonic ventricular cells treated with or without isoproterenol (ISO). A: dose-response curves of E11.5, E14.5, and E17.5 ventricular cells treated with ISO using a homogeneous time-resolved fluorescence (HTRF)-based cAMP assay. B: basal cAMP levels of E17.5 ventricular cells (untreated) were found to be significantly higher than those of E11.5 ventricular cells. *P < 0.05 vs. E11.5; one-way ANOVA, Tukey’s multiple-comparisons test. Each bar represents means ± SE; n = 3–5 independent experiments.
Fig. 4.
Fig. 4.
Effects of β-AR stimulation and inhibition on cAMP production in E11.5 ventricular cells. Basal cAMP levels in untreated cells were set to a value of 1.0 and data represent fold changes in cAMP in response to ISO with or without β-AR antagonists. A: stimulation of E11.5 ventricular cells with 1 µM ISO was associated with an approximate fourfold increase in cAMP. Cotreatment of cells with ISO and metoprolol (Meto) abolished the increase in cAMP production observed with ISO alone. B: cotreatment of E11.5 cells with ISO and ICI-118,551 (ICI) also abolished the increase in cAMP production observed with ISO alone. *P < 0.05 vs. basal; #P < 0.05 vs. ISO alone, one-way ANOVA, Tukey’s multiple-comparisons test. Each bar represents means ± SE; n = 3–5 independent experiments.
Fig. 5.
Fig. 5.
Assessment of DNA synthesis, cell size, and apoptosis levels in E11.5 ventricular cells in response to β-AR stimulation and inhibition. A and B: ventricular cells generated from double knockin embryos (Nkx2.5-Cre × Rosa-lacZ) were processed for [3H]thymidine incorporation assay. A: cells were labeled for sarcomeric myosin (MF20; red) and nuclei (Hoechst; blue). B: the same field of cells was also colabeled with β-galactosidase antibodies (β-Gal; green). Cells positive for MF20 and β-Gal (β-Gal+/MF20+) are mature cardiomyocytes (CMs; open arrowhead), whereas cells positive for β-Gal only (β-Gal+/MF20) are cardiac progenitor cells (CPCs; solid arrowhead) and cells negative for both β-Gal and MF20 (β-Gal/MF20) are noncardiomyogenic cells (arrow). The CPC indicated by the solid arrowhead is also [3H]+ based on the presence of silver grains in the nucleus. Bar = 100 µm in A and B. C and D: quantification of cells undergoing DNA synthesis in CPC (C) and CM (D) populations after treatment with the indicated drugs: ISO (1 µM), Meto (1 µM), or ICI (1 µM). *P < 0.05 vs. control (Cont); #P < 0.05 vs. ISO alone, one-way ANOVA, Tukey’s multiple-comparisons test. Each bar represents means ± SE; n = 5 independent experiments. E and F: quantification of CM cell size (E) and apoptosis (F) levels after treatment with indicated drugs. *P < 0.05 vs. control, one-way ANOVA, Tukey’s multiple-comparisons test. Bars represent means ± SE; n = 3 independent experiments.
Fig. 6.
Fig. 6.
Stimulation of β1-ARs results in decreased proliferation of E11.5 ventricular cells. A: cells were treated with ISO (1 µM) in the presence and absence of either Meto (1 µM) or ICI (1 µM), and cell proliferation was assessed using a CyQUANT assay. *P < 0.05 vs. control; #P < 0.05 vs. Meto. B: percent distribution of cells in the G2/M phase in E11.5 cultures treated with ISO in the presence or absence of Meto. *P < 0.05 vs. ISO, one-way ANOVA with Tukey’s multiple-comparisons test. Each bar represents means ± SE; n = 5 independent experiments.
Fig. 7.
Fig. 7.
Effect of β-adrenergic stimulation on phosphorylation of Akt and Erk. A and B: using Western blot analysis, levels of total and phosphorylated Erk and Akt were determined in E11.5 ventricular cells treated with ISO (1 μM) for various time periods. A: ratio of phosphorylated (p-)Erk1/2 to total Erk1/2 significantly decreased within 1 h of ISO treatment compared with untreated cultured cells. B: ratio of p-Akt to total Akt significantly decreased within 10–30 min of ISO treatment compared with the untreated E11.5 ventricular cells. *P < 0.05 vs. control (untreated), one-way ANOVA with Tukey’s multiple comparisons test. Results are means ± SE of three independent experiments/group.
Fig. 8.
Fig. 8.
Effects of ISO on expression of cell cycle regulating genes and CM differentiation. A and B: relative expression of cell cycle genes cyclin D1 and cyclin-dependent kinase (CDK)4 (A) and β-AR subtypes (B) in E11.5 ventricular cultures treated with or without ISO (1 μM). *P < 0.05 vs. control, unpaired Student’s t-test. n = 3 independent experiments/treatment group, analyzed in duplicate for each experiment. C: percent distribution of CPCs and differentiated CMs in E11.5 cultures treated with ISO. *P < 0.05 vs. control, unpaired Student’s t-test. n = 5 independent experiments/treatment group.
Fig. 9.
Fig. 9.
Quantification of graft volumes of intracardiac transplanted E11.5 ventricular cells in recipient mice treated with or without β-adrenergic agonist and antagonist drugs. AC: representative micrographs of X-Gal-stained thick sections of recipient hearts transplanted with E11.5 ventricular cells derived from double knockin embryos (Nkx2.5-Cre × Rosa-lacZ). Bar = 100 µm. Recipient mice were either untreated (A), treated with ISO (B), or treated with ISO + Meto (C). D: quantification of graft volume of intracardiac transplanted embryonic ventricular cells. *P < 0.005 vs. control; $P < 0.05 vs. control and ISO, one-way ANOVA with Tukey’s multiple-comparisons test. Results are means ± SE of 3–4 experiments/group.

References

    1. Baguma-Nibasheka M, Li AW, Murphy PR. The fibroblast growth factor-2 antisense gene inhibits nuclear accumulation of FGF-2 and delays cell cycle progression in C6 glioma cells. Mol Cell Endocrinol 267: 127–136, 2007. doi:10.1016/j.mce.2007.01.008. - DOI - PubMed
    1. Chen F, Klitzner TS, Weiss JN. Autonomic regulation of calcium cycling in developing embryonic mouse hearts. Cell Calcium 39: 375–385, 2006. doi:10.1016/j.ceca.2005.12.004. - DOI - PubMed
    1. Chen FM, Yamamura HI, Roeske WR. Ontogeny of mammalian myocardial beta-adrenergic receptors. Eur J Pharmacol 58: 255–264, 1979. doi:10.1016/0014-2999(79)90474-6. - DOI - PubMed
    1. Dowell JD, Rubart M, Pasumarthi KB, Soonpaa MH, Field LJ. Myocyte and myogenic stem cell transplantation in the heart. Cardiovasc Res 58: 336–350, 2003. doi:10.1016/S0008-6363(03)00254-2. - DOI - PubMed
    1. Evans SM, Yelon D, Conlon FL, Kirby ML. Myocardial lineage development. Circ Res 107: 1428–1444, 2010. doi:10.1161/CIRCRESAHA.110.227405. - DOI - PMC - PubMed

MeSH terms

LinkOut - more resources