. 2017 Apr 5;37(14):3813-3823.
doi: 10.1523/JNEUROSCI.3221-16.2017. Epub 2017 Mar 10.

Electrophysiological Evidence for Hyperfocusing of Spatial Attention in Schizophrenia

Affiliations

Electrophysiological Evidence for Hyperfocusing of Spatial Attention in Schizophrenia

Johanna Kreither et al. J Neurosci. .

Abstract

A recently proposed hyperfocusing hypothesis of cognitive dysfunction in schizophrenia proposes that people with schizophrenia (PSZ) tend to concentrate processing resources more narrowly but more intensely than healthy control subjects (HCS). The present study tests a key prediction of this hypothesis, namely, that PSZ will hyperfocus on information presented at the center of gaze. This should lead to greater filtering of peripheral stimuli when the task requires focusing centrally but reduced filtering of central stimuli when the task requires attending broadly in the periphery. These predictions were tested in a double oddball paradigm, in which frequent standard stimuli and rare oddball stimuli were presented at central and peripheral locations while event-related potentials were recorded. Participants were instructed to discriminate between the standard and oddball stimuli at either the central location or at the peripheral locations. PSZ and HCS showed opposite patterns of spatial bias at the level of early sensory processing, as assessed with the P1 component: PSZ exhibited stronger sensory suppression of peripheral stimuli when the task required attending narrowly to the central location, whereas HCS exhibited stronger sensory suppression of central stimuli when the task required attending broadly to the peripheral locations. Moreover, PSZ exhibited a stronger stimulus categorization response than HCS, as assessed with the P3b component, for central stimuli when the task required attending to the peripheral region. These results provide strong evidence of hyperfocusing in PSZ, which may provide a unified mechanistic account of multiple aspects of cognitive dysfunction in schizophrenia.SIGNIFICANCE STATEMENT Schizophrenia clearly involves impaired attention, but attention is complex, and delineating the precise nature of attentional dysfunction in schizophrenia has been difficult. The present study tests a new hyperfocusing hypothesis, which proposes that people with schizophrenia (PSZ) tend to concentrate processing resources more intensely but more narrowly than healthy control subjects (HCS). Using electrophysiological measures of sensory and cognitive processing, we found that PSZ were actually superior to HCS in focusing attention at the point of gaze and filtering out peripheral distractors when the task required a narrow focusing of attention. This finding of superior filtering in PSZ supports the hyperfocusing hypothesis, which may provide the mechanism underlying a broad range of cognitive impairments in schizophrenia.

Keywords: attention; event-related potential; hyperfocusing; p300; schizophrenia.


Figures

Figure 1.
Figure 1.
A, Example stimulus sequence from the double oddball task. The stimuli were colored squares (90% blue and 10% yellow or vice versa) presented at the central location on 50% of trials and at one of the four peripheral locations on the remaining 50%. Participants attended to the inner region in some trial blocks and to the outer region in other trial blocks. They were instructed to press one button for blue stimuli in the attended region, to press another button for yellow stimuli in the attended region, and to make no response for stimuli in the unattended region. B, Enlarged view of the attentional reminder stimulus that was present in the middle of the display to ensure that participants knew at all times which region should be attended. C, Diagram of the inner and outer stimulus regions. D, Example stimuli from the divided attention condition of the UFOV task. The target display was presented for a given period of time and then immediately followed by the noise mask. Participants reported whether the central stimulus was a car or truck and then clicked on one of eight locations on the screen to report the position of the peripheral target. The duration of the target display was adjusted with an adaptive staircase to determine the duration that would lead to an accuracy level of 75% correct.
Figure 2.
Figure 2.
Behavioral performance in the double oddball task. A, B, Percentage of trials on which participants responded to inner and outer stimuli in the attended region (A) and the unattended region (B), regardless of whether the response was correct for the stimulus color. This reflects the extent to which participants attended to the correct region. C, D, Discrimination accuracy for responses to stimuli presented in the attended region (C) and the reaction time for correct responses (D). Error bars show the SEM.
Figure 3.
Figure 3.
ERP data collapsed across standards and oddballs and the occipital electrode sites (Oz, O1, and O2) to show the P1 wave for stimuli in the attended and unattended regions. A, Waveforms for stimuli in the inner region. B, Waveforms for stimuli in the outer region. C, Mean P1 amplitudes measured from the waveforms shown in A and B. Error bars show the SEM. Asterisks indicate attention effects that were significantly different from zero (as indicated by one-sample t tests). For stimuli in the outer region, PSZ showed a strong and significant suppression of the P1 wave when the inner region was attended to compared to when the outer region was attended to (B, left), whereas HCS did not (B, right). For stimuli in the inner region, HCS showed a strong and significant suppression of the P1 wave when the outer region was attended to compared to when the inner region was attended to (A, right), whereas PSZ did not (A, left).
Figure 4.
Figure 4.
Grand average ERP waveforms, separated for standards and oddballs and collapsed across parietal electrode sites (Pz, P1, and P2) to show the P3b probability effect. A, Waveforms for stimuli presented in the attended region. B, Waveforms for stimuli presented in the unattended region.
Figure 5.
Figure 5.
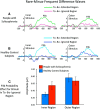
A–C, Grand average rare-minus-frequent difference waves collapsed across parietal electrode sites (Pz, P1, and P2) in people with schizophrenia (A) and healthy control subjects (B), along with mean rare-minus-frequent difference scores for the to-be-ignored stimuli (C). Error bars show the SEM.
Figure 6.
Figure 6.
Scatter plot of the relationship between threshold in the UFOV task and the P1 central bias score in people with schizophrenia (left) and healthy control subjects (right). Note that higher thresholds in the UFOV task reflect worse performance.

References

    1. Andreasen NC. (1984) Scale for the assessment of negatives symptoms (SANS). Iowa City, IA: University of Iowa.
    1. Andreasen NC, Pressler M, Nopoulos P, Miller D, Ho BC (2010) Antipsychotic dose equivalents and dose-years: a standardized method for comparing exposure to different drugs. Biol Psychiatry 67:255–262. 10.1016/j.biopsych.2009.08.040 - DOI - PMC - PubMed
    1. Ball K, Owsley C (1993) The useful field of view test: a new technique for evaluating age-related declines in visual function. J Am Optom Assoc 64:71–79. - PubMed
    1. Ball K, Roenker DL (1998) UFOV useful field of view manual. San Antonio, TX: Psychological Corporation.
    1. Brooks JL, Zoumpoulaki A, Bowman H (2017) Data-driven region-of-interest selection without inflating Type I error rate. Psychophysiology 54:100–113. 10.1111/psyp.12682 - DOI - PubMed

Publication types