. 2017 Apr;19(2):175-190.
doi: 10.1007/s10126-017-9741-0. Epub 2017 Mar 10.

Nitrogen Metabolism Genes from Temperate Marine Sediments

Affiliations

Nitrogen Metabolism Genes from Temperate Marine Sediments

Carolina Reyes et al. Mar Biotechnol (NY). 2017 Apr.

Abstract

In this study, we analysed metagenomes along with biogeochemical profiles from Skagerrak (SK) and Bothnian Bay (BB) sediments, to trace the prevailing nitrogen pathways. NO3- was present in the top 5 cm below the sediment-water interface at both sites. NH4+ increased with depth below 5 cm where it overlapped with the NO3- zone. Steady-state modelling of NO3- and NH4+ porewater profiles indicates zones of net nitrogen species transformations. Bacterial protease and hydratase genes appeared to make up the bulk of total ammonification genes. Genes involved in ammonia oxidation (amo, hao), denitrification (nir, nor), dissimilatory NO3- reduction to NH4+ (nfr and otr) and in both of the latter two pathways (nar, nap) were also present. Results show ammonia-oxidizing bacteria (AOB) and ammonia-oxidizing archaea (AOA) are similarly abundant in both sediments. Also, denitrification genes appeared more abundant than DNRA genes. 16S rRNA gene analysis showed that the relative abundance of the nitrifying group Nitrosopumilales and other groups involved in nitrification and denitrification (Nitrobacter, Nitrosomonas, Nitrospira, Nitrosococcus and Nitrosomonas) appeared less abundant in SK sediments compared to BB sediments. Beggiatoa and Thiothrix 16S rRNA genes were also present, suggesting chemolithoautotrophic NO3- reduction to NO2- or NH4+ as a possible pathway. Our results show the metabolic potential for ammonification, nitrification, DNRA and denitrification activities in North Sea and Baltic Sea sediments.

Keywords: Marine; Metagenome; Nitrogen; Sediments.


Figures
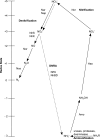
Fig. 1
Fig. 1
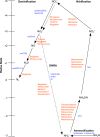
Ammonification, DNRA, nitrification and denitrification pathways and the enzymes involved in those pathways (Figure modified after Cabello et al. (2009)
Fig. 2
Fig. 2
(a) Map of the Baltic Sea (b) showing locations of the two sampling Sites Geo 2a and At4. c The Skagerrak showing the locations of Site Geo2a with respect to the locations of Sites S1 through S9 of the transect studied by Canfield et al. (1993)
Fig. 3
Fig. 3
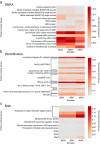
Heat map showing normalized protein-coding gene abundances predicted to be involved in various metabolic pathways detected in SK and BB metagenomes. The most abundant genes (red) and least abundant genes (grey). BB34 refers to sample 3–4 cmbsf (centimetre below sea-floor), BB67 refers to sample 6–7 cmbsf and SK68 refers to sample 6–8 cmbsf. Values for samples were scaled from 0 (minimum value) to 1 (maximum value) using a uniform scaling method implemented in the MG-RAST pipeline. Forward and reverse abundances were averaged and a single value is reported per sample
Fig. 4
Fig. 4
Ammonification, DNRA, nitrification and denitrification pathways based on protein-coding genes detected in SK and BB samples. Enzymes (blue) and taxa (orange) that could potentially be involved in each pathway are written next to each arrow. Question marks indicate uncertainty in the organism’s involvement in the pathway despite detection. Figure modified after Cabello et al. (2009)
Fig. 5
Fig. 5
Model based on porewater concentrations showing predicted rates of NO3 and NH4 + production and consumption in sediments. Porewater concentrations and predicted rates of NO3 production and consumption in SK samples (a) and in BB samples (b). Red lines (PROFILE model), blue lines (REC model)
Fig. 6
Fig. 6
Heat map showing normalized protein-coding gene abundances predicted to be involved in ammonification metabolism detected in SK and BB metagenomes. The most abundant genes (red) and least abundant genes (grey). BB34 refers to sample 3–4 cmbsf (centimetre below sea-floor), BB67 refers to sample 6–7 cmbsf and SK68 refers to sample 6–8 cmbsf). Numbers on the y-axis correspond to the genes listed in Table 1. Values for samples were scaled from 0 (minimum value) to 1 (maximum value) using a uniform scaling method implemented in the MG-RAST pipeline. Forward and reverse abundances were averaged and a single value is reported per sample
Fig. 7
Fig. 7
Normalized 16S rRNA gene abundances of microorganisms detected in SK and BB samples. Bar charts showing normalized 16S rRNA gene abundances of microorganisms able to perform a nitrification, b denitrification and DNRA. BB34 refers to sample 3–4 cmbsf (centimetre below sea-floor), BB67 refers to sample 6–7 cmbsf and SK68 refers to sample 6–8 cmbsf). Values for samples were scaled from 0 (minimum value) to 1 (maximum value) using a uniform scaling method implemented in the MG-RAST pipeline. Forward and reverse scaled abundances were averaged and a single value is reported per sample along with its standard deviation. The bar charts were generated using the MD5NR database, a maximum e value cut-off of 1e-05, minimum identity cut-off of 60% and a minimum alignment length cut-off 15
Fig. 8
Fig. 8
Heat maps showing normalized putative protein-coding gene abundances predicted to be involved in a DNRA, b denitrification or c both, detected in SK and BB metagenomes. BB34 refers to sample 3–4 cmbsf (centimetre below sea-floor), BB67 refers to sample 6–7 cmbsf and SK68 refers to sample 6–8 cmbsf. Values for samples were scaled from 0 (minimum value) to 1 (maximum value) using a uniform scaling method implemented in the MG-RAST pipeline. Forward and reverse abundances were averaged and a single value is reported per sample
Fig. 9
Fig. 9
Heat map showing normalized protein-coding gene abundances predicted to be involved in sulphur oxidation metabolism detected in SK and BB metagenomes. BB34 refers to sample 3–4 cmbsf (centimetre below sea-floor), BB67 refers to sample 6–7 cmbsf and SK68 refers to sample 6–8 cmbsf. Values for samples were scaled from 0 (minimum value) to 1 (maximum value) using a uniform scaling method implemented in the MG-RAST pipeline. Forward and reverse abundances were averaged and a single value is reported per sample
Fig. 10
Fig. 10
3-D charts showing the normalized abundances of genes predicted to be involved in denitrification and DNRA pathways (referred to as both), only in the denitrification pathway and only in the DNRA pathway in a SK and b BB samples

Similar articles

Cited by

References

    1. Algar CK, Vallino JJ. Predicting microbial nitrate reduction pathways in coastal sediments. Aquat Microb Ecol. 2014;71:223–238. doi: 10.3354/ame01678. - DOI
    1. Atkinson SJ, Moat CG, Reid GA, Chapman SK. An octaheme c-type cytochrome from Shewanella oneidensis can reduce nitrate and hydroxylamine. FEBS Lett. 2007;581:3805–3808. doi: 10.1016/j.febslet.2007.07.005. - DOI - PubMed
    1. Baggs E, Phillipot L (2011) Nitrous oxide production in the terrestrial environment. In: Moir JWB (ed) Nitrogen cycling in bacteria: molecular analysis. Caister Academic Press, Norfolk
    1. Bale NJ, Villanueva L, Hopmans EC, Schouten S, Sinninghe Damsté JS. Different seasonality of pelagic and benthic Thaumarchaeota in the North Sea. Biogeosciences. 2013;10:7195–7206. doi: 10.5194/bg-10-7195-2013. - DOI
    1. Beman JM, Bertics VJ, Braunschweiler T, Wilson JM. Quantification of ammonia oxidation rates and the distribution of ammonia-oxidizing Archaea and Bacteria in marine sediment depth profiles from Catalina Island, California. Front Microbiol. 2012;3:263. - PMC - PubMed

LinkOut - more resources