Review
. 2017 Dec;4(1):14.
doi: 10.1186/s40658-017-0181-8. Epub 2017 Mar 11.

Cerenkov luminescence imaging: physics principles and potential applications in biomedical sciences

Affiliations
Review

Cerenkov luminescence imaging: physics principles and potential applications in biomedical sciences

Esther Ciarrocchi et al. EJNMMI Phys. 2017 Dec.

Abstract

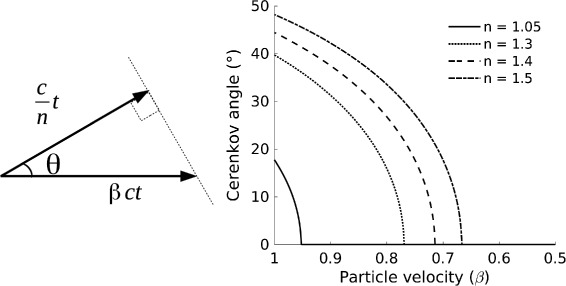
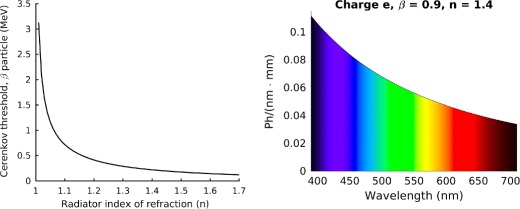
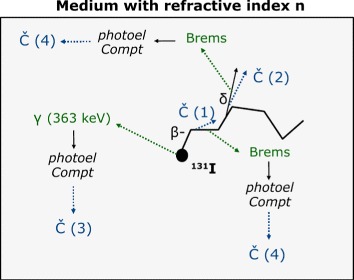
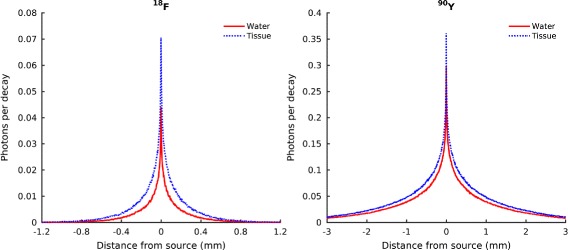
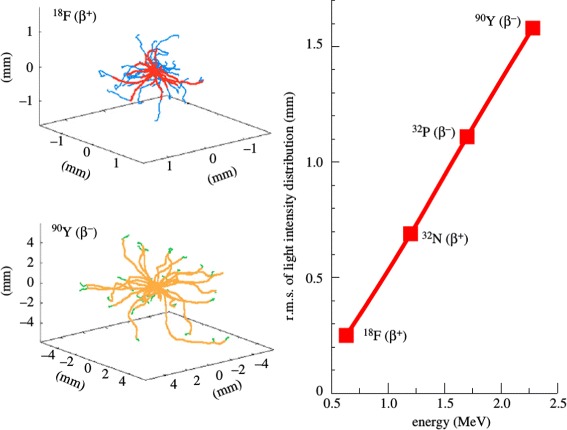
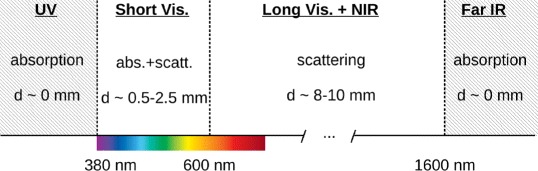
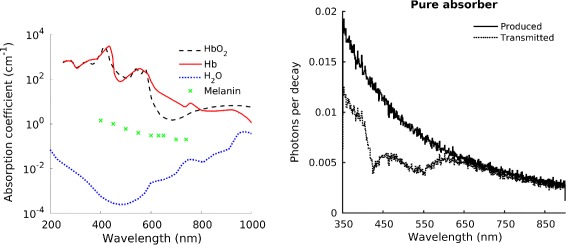
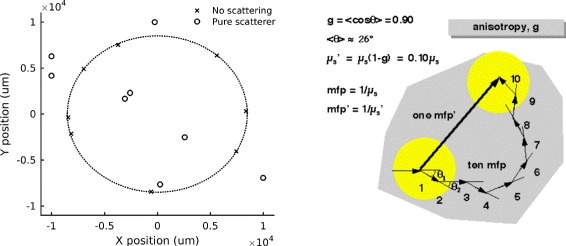
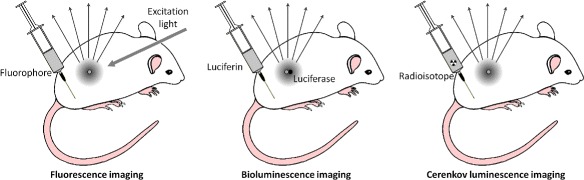
Cerenkov luminescence imaging (CLI) is a novel imaging modality to study charged particles with optical methods by detecting the Cerenkov luminescence produced in tissue. This paper first describes the physical processes that govern the production and transport in tissue of Cerenkov luminescence. The detectors used for CLI and their most relevant specifications to optimize the acquisition of the Cerenkov signal are then presented, and CLI is compared with the other optical imaging modalities sharing the same data acquisition and processing methods. Finally, the scientific work related to CLI and the applications for which CLI has been proposed are reviewed. The paper ends with some considerations about further perspectives for this novel imaging modality.

Keywords: Cerenkov luminescence imaging; Nuclear medicine; Optical imaging.


Figures

Fig. 1
Fig. 1
Left: Pictorial description of the Cerenkov emission. Right: Cerenkov angle as a function of the particle velocity, for different values of refractive index
Fig. 2
Fig. 2
Left: Cerenkov threshold as a function of the refractive index of the radiator for a β particle (m 0 c 2=0.511 MeV). Right: Number of Cerenkov photons emitted per unit path length and per unit wavelength by a particle with charge e and β=0.9 in a medium with n(λ)=1.4
Fig. 3
Fig. 3
Pictorial description of the different processes that can lead to Cerenkov emission. Abbreviations: Brems = Bremsstrahlung, photoel = photoelectron, δ = δ ray, C̆ = Cerenkov radiation. Adapted from [69]
Fig. 4
Fig. 4
Cerenkov emission range, defining the CLI intrinsic limit to the spatial correlation between the source position and the position of production of the Cerenkov radiation, much like the positron range for positron emission tomography. Simulated results were obtained including all the contributions to Cerenkov light production (1–4) of Fig. 3
Fig. 5
Fig. 5
Left: Cerenkov production range simulated by [32], considering only the contribution of the primary β particles (1) in Fig. 3. Right: simulated spread in the Cerenkov light production as a function of the β-particle endpoint energy, for a few radionuclides (both with permission by [32])
Fig. 6
Fig. 6
Summary of the behavior in tissue of optical radiation of different wavelength, from data in [42]. The penetration depth is indicated as d
Fig. 7
Fig. 7
Left: Absorption spectra of tissue components. Data for both oxygenated and deoxygenated hemoglobin were taken from [44], water data by [45] and melanin data by [46]. Right: Monte Carlo simulation of the modification of the Cerenkov spectrum in 1 cm of a typical tissue-like pure absorber (dotted line), with the original Cerenkov emission spectrum as a reference
Fig. 8
Fig. 8
Left: Monte Carlo simulation of the effect of pure scattering on the transmitted light distribution: positions of the Cerenkov photons belonging to the same vertex after traversing 1 cm of either a non-scattering material (crosses, producing the Cerenkov cone indicated by the dashed circle) or a tissue-like scattering material (circles). Right: Difference between the scattering and the reduced scattering coefficients (with permission from www.omlc.org, accessed on 21/12/2016)
Fig. 9
Fig. 9
Overview of optical imaging modalities: fluorescence imaging (left), bioluminescence imaging (center) and Cerenkov luminescence imaging (right). This figure was conceived taking inspiration from both [70, 132]
Fig. 10
Fig. 10
Examples of preclinical CLI and CLT. a Tumor treatment monitoring over time in a vehicle group and in a group treated with an anti-tumor agent [93] (with permission). b Reconstruction of the activity distribution with Cerenkov luminescence tomography (green, top) and with PET (red, bottom) as done by [96] (with permission). c Reconstructed msCLT trans-axial slice co-registered with MRI from [54] (with permission). The reconstructed slice position is highlighted in green in the bottom part of the figure
Fig. 11
Fig. 11
Examples of quantitative CLI. Top: Quantitative analysis of CLI and PET signals [2] (with permission). Bottom left: Decay in time of the count rate due to 18F measured by the PDPC, before and after data correction [27]. Bottom right: Linearity of the Cerenkov count rate in the PDPC with the 18F activity level, adapted from [69]
Fig. 12
Fig. 12
Left: Relative comparison of measured and simulated Cerenkov light yield for a few radionuclides in water [58] (with permission). Right: Simulated over measured Cerenkov count rate with different acquisition settings (top) and as a function of activity, for two combinations of acquisition settings (bottom); both figures were adapted from [125]
Fig. 13
Fig. 13
Examples of clinical CLI. a First human CLI image of a thyroid suffering from hyperthyroidism treated with 550 MBq of 131I-iodide, 24 h after administration [59] (with permission). b CLI endoscopy (ECLI) of cancerous (left) and normal tissue (right), by [20] (with permission). c Ex-vivo CLI of human brain tumor removed during neurosurgery, by [130] (with permission). d Real-time CLI of human breast external radiation therapy, by [91] (with permission): beam’s eye view of treatment (left), corresponding skin projection (center) and Cerenkov emission image (right)

Similar articles

Cited by

References

    1. Robertson R, Germanos M, Li C, Mitchell G, Cherry S, Silva M. Optical imaging of Cerenkov light generation from positron-emitting radiotracers. Phys Med Biol. 2009;54(16):N355. doi: 10.1088/0031-9155/54/16/N01. - DOI - PMC - PubMed
    1. Ruggiero A, Holland J, Lewis J, Grimm J. Cerenkov luminescence imaging of medical isotopes. J Nucl Med. 2010;51(7):1123–30. doi: 10.2967/jnumed.110.076521. - DOI - PMC - PubMed
    1. Spinelli A, D’Ambrosio D, Calderan L, Marengo M, Sbarbati A, Boschi F. Cerenkov radiation allows in vivo optical imaging of positron emitting radiotracers. Phys Med Biol. 2010;55(2):483. doi: 10.1088/0031-9155/55/2/010. - DOI - PubMed
    1. Shen S, DeNardo G, DeNardo S. Quantitative Bremsstrahlung imaging of Yttrium-90 using a Wiener filter. Med Phys. 1994;21(9):1409–17. doi: 10.1118/1.597198. - DOI - PubMed
    1. Walrand S, Flux G, Konijnenberg M, Valkema R, Krenning E, Lhommel R, Pauwels S, Jamar F. Dosimetry of Yttrium-labelled radiopharmaceuticals for internal therapy: 86Y or 90Y imaging? Eur J Nuclear Med Mol Imaging. 2011;38(1):57–68. doi: 10.1007/s00259-011-1771-7. - DOI - PubMed

LinkOut - more resources