. 2017 Jun:179:25-39.
doi: 10.1016/j.clim.2017.03.002. Epub 2017 Mar 9.

Human IL-6RhiTIGIT- CD4+CD127lowCD25+ T cells display potent in vitro suppressive capacity and a distinct Th17 profile

Affiliations

Human IL-6RhiTIGIT- CD4+CD127lowCD25+ T cells display potent in vitro suppressive capacity and a distinct Th17 profile

Ricardo C Ferreira et al. Clin Immunol. 2017 Jun.

Abstract

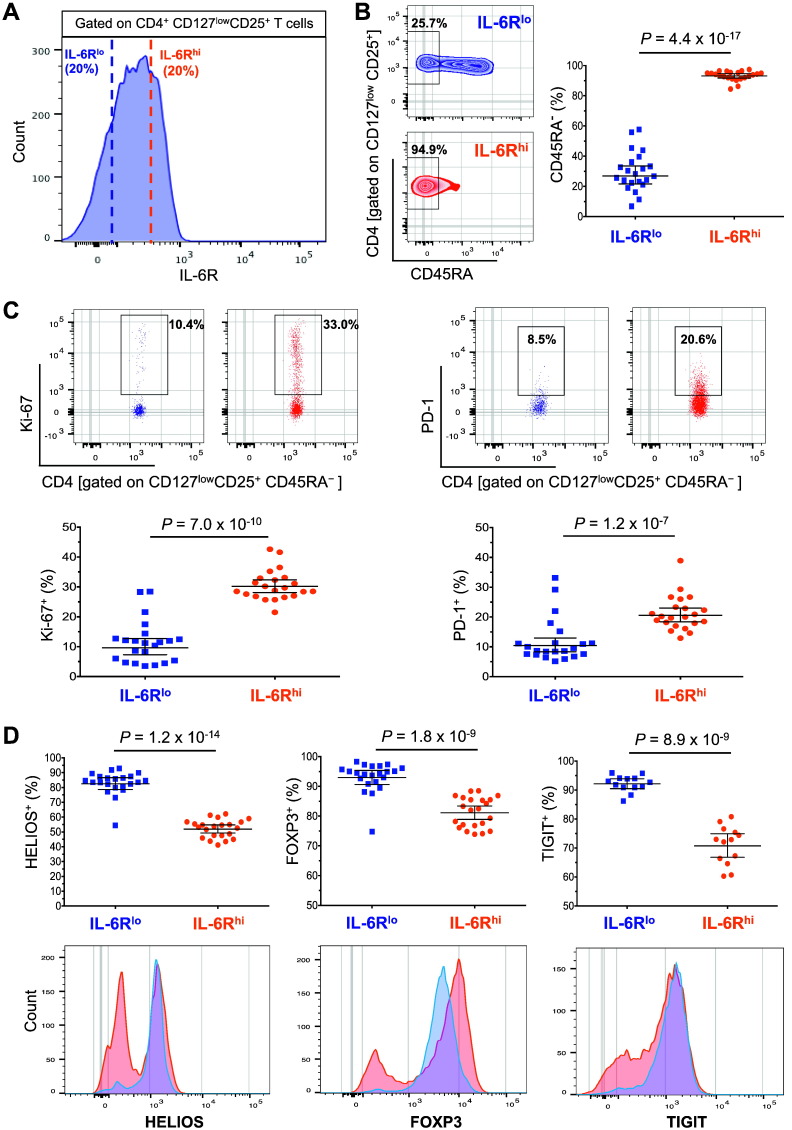
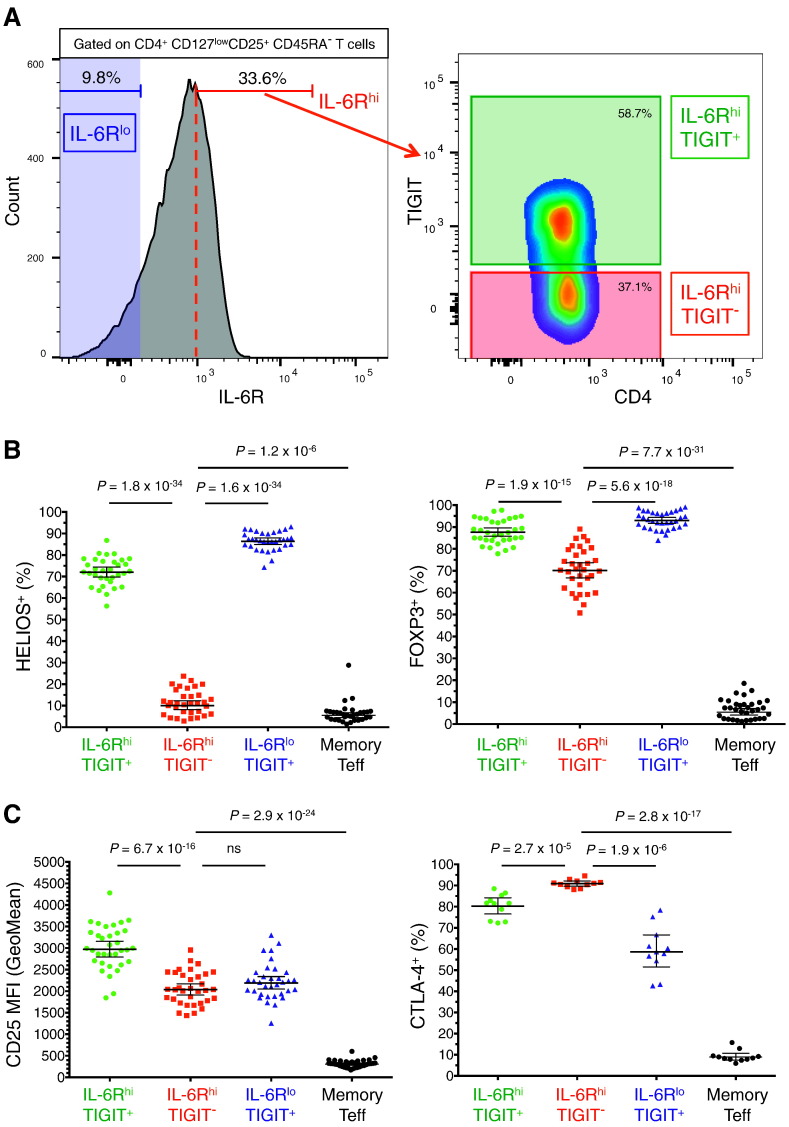
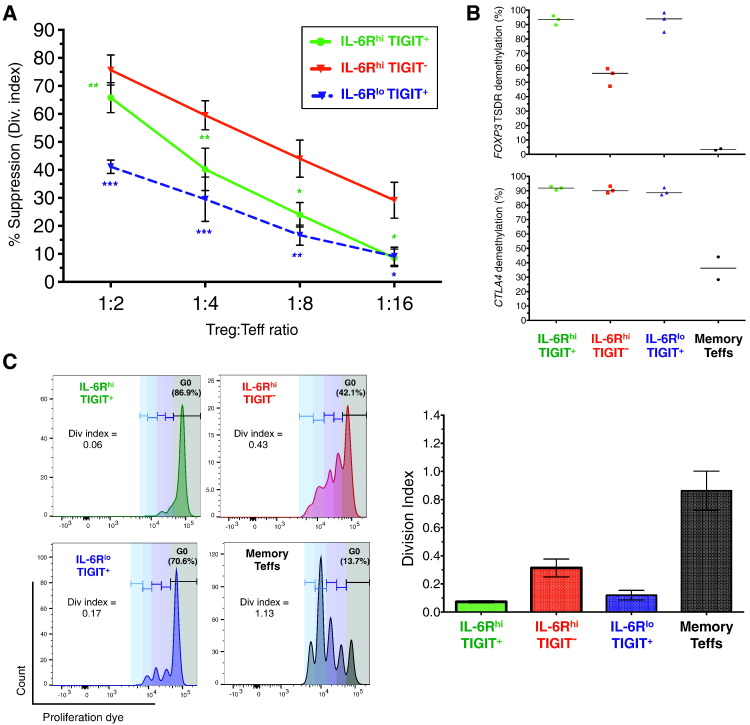
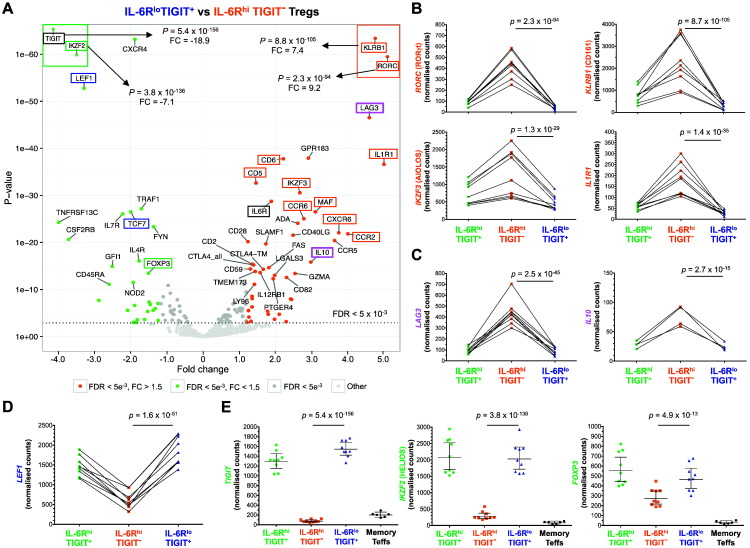
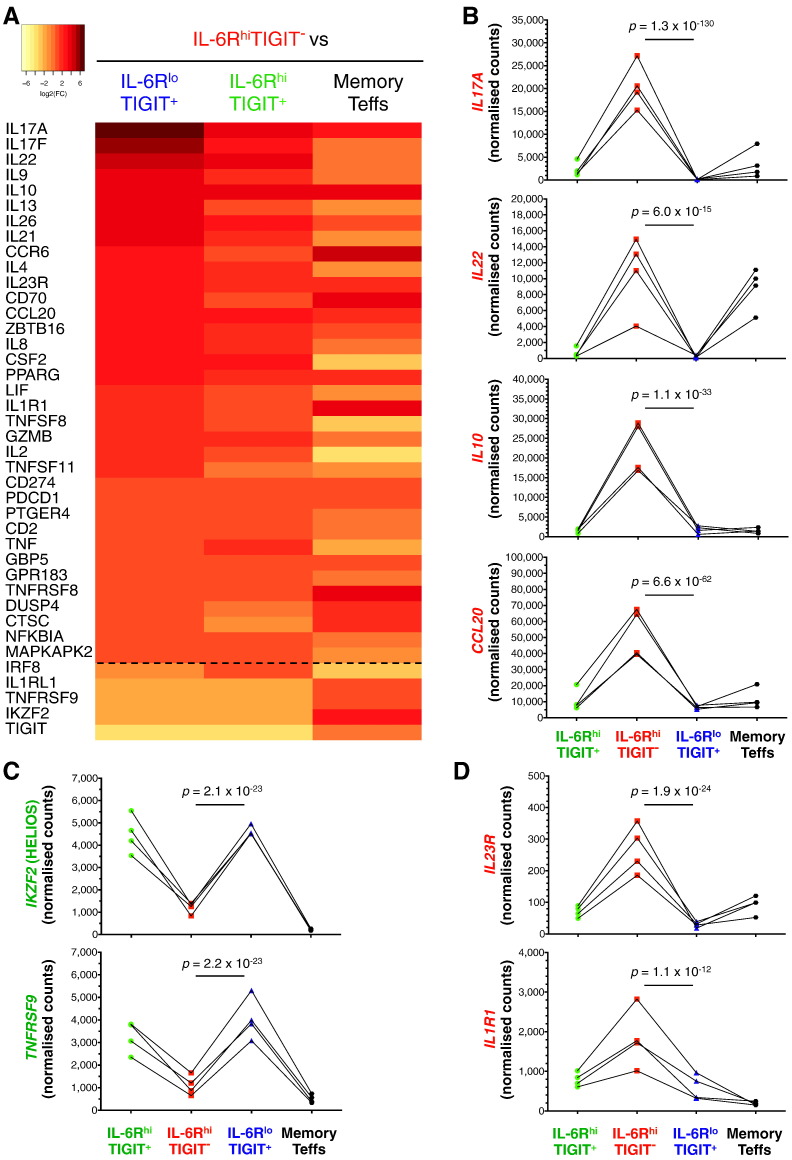
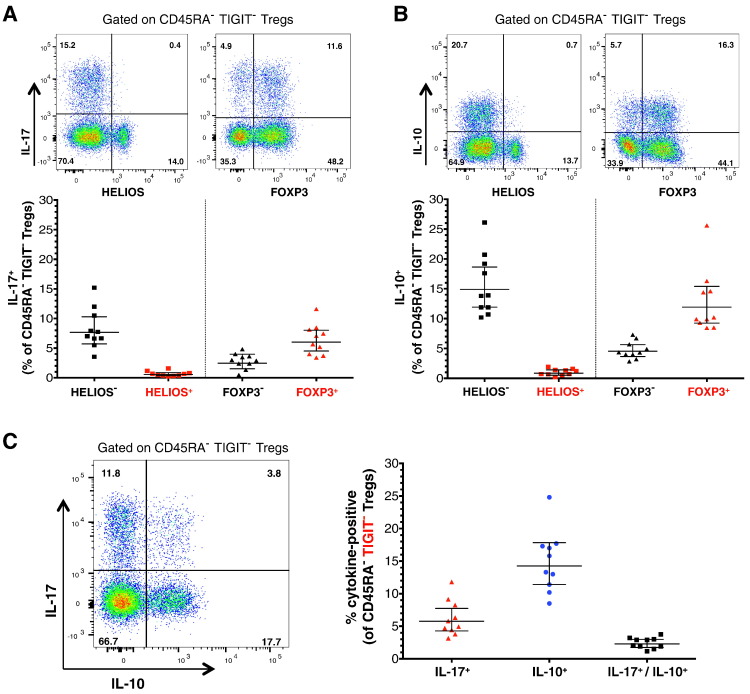
To date many clinical studies aim to increase the number and/or fitness of CD4+CD127lowCD25+ regulatory T cells (Tregs) in vivo to harness their regulatory potential in the context of treating autoimmune disease. Here, we sought to define the phenotype and function of Tregs expressing the highest levels of IL-6 receptor (IL-6R). We have identified a population of CD4+CD127lowCD25+ TIGIT- T cells distinguished by their elevated IL-6R expression that lacked expression of HELIOS, showed higher CTLA-4 expression, and displayed increased suppressive capacity compared to IL-6RhiTIGIT+ Tregs. IL-6RhiTIGIT- CD127lowCD25+ T cells contained a majority of cells demethylated at FOXP3 and displayed a Th17 transcriptional signature, including RORC (RORγt) and the capacity of producing both pro- and anti-inflammatory cytokines, such as IL-17, IL-22 and IL-10. We propose that in vivo, in the presence of IL-6-associated inflammation, the suppressive function of CD4+CD127lowCD25+ FOXP3+IL-6RhiTIGIT- T cells is temporarily disarmed allowing further activation of the effector functions and potential pathogenic tissue damage.


Figures

Fig. 1
Fig. 1
Single dose of IL-2 transiently increases the frequency of IL-6Rhi Tregs in vivo. (A) Data depict the variation (Mean ± SEM) of the frequency of IL-6Rhi CD127lowCD25+ Tregs at each visit following IL-2 treatment compared to pre-treatment baseline (median = 20.0%; range: 19.0–21.1%) in 22 T1D patients enrolled in the “Adaptive study of IL-2 dose on regulatory T cells in type 1 diabetes” (DILT1D). The IL-6Rhi mean fluorescence intensity (MFI) threshold was defined on each donor at the first pre-treatment timepoints as the upper 20th percentile of the IL-6R MFI distribution in total CD127lowCD25+ Tregs, and applied to each subsequent visit. Patients were stratified according to whether they received (i) the lower IL-2 doses of 0.04–0.045 × 106 U/ml (N = 8; depicted in black); or (ii) the higher IL-2 doses of 0.16–0.737 × 106 U/ml (N = 14; depicted in red). (B) Histograms depict an illustrative example of the IL-2-induced increase (58%) in the frequency of IL-6Rhi Tregs after 24 h of treatment with a single dose of 0.445 × 106 U/ml IL-2, compared to the pre-treatment baseline. (C) Data depict the variation (Mean ± SEM) of the frequency of (i) IL-6Rhi Tregs (left panel) and (ii) CD127+ CD25 Tregs (right panel) among total CD4+ T cells following IL-2 treatment in the same cohort of patients. Median pre-treatment baseline frequencies were 1.45% (range: 0.75–2.08%) and 7.75% (range: 3.96–10.64%) for CD4+ IL-6Rhi Tregs and total CD4+ CD127lowCD25+ Tregs, respectively. The maximum increases over the baseline pre-treatment frequencies achieved during the course of the study are indicated for each IL-2 dosing group. P values for the maximum increase in the frequency of the assessed parameter in response to a single dose of IL-2 was calculated using a two-tailed paired non-parametric Wilcoxon signed rank test comparing the frequencies observed at the timepoint where the maximal increase was achieved with the respective baseline pre-treatment frequencies. P values for the IL-2 dose-dependent effects were calculated using a two-tailed non-parametric Mann-Whitney test comparing the frequency of IL-6Rhi cells between the two dose groups at each timepoint. *P < 0.05; **P < 0.01; ns = not significant.
Fig. 2
Fig. 2
IL-6Rhi Tregs are activated antigen-experienced cells and show reduced expression of FOXP3, HELIOS and CD25. (A) Gating strategy for the delineation of circulating IL-6Rlo (depicted in blue) and IL-6Rhi (depicted in red) Tregs in healthy donors (N = 22). (B) Plot depicts the frequency (GeoMean ± 95% CI) of the CD45RA memory compartment in IL-6Rlo and IL-6Rhi Tregs. (C) Data shown depicts the frequencies (GeoMean ± 95% CI) of the proliferation marker Ki-67 and the activation marker PD-1 in CD45RA IL-6Rlo and IL-6Rhi mTregs. (D) Data depict the frequency of three Treg markers, HELIOS, FOXP3 and TIGIT in CD45RA IL-6Rlo and IL-6Rhi mTregs. Histograms depict the distribution of the Mean Fluorescence Intensity (MFI) of the assessed markers in the two subsets from one illustrative donor. P values were calculated using a two-tailed paired non-parametric Wilcoxon signed rank test, comparing the frequency of the assessed immune phenotypes between the IL-6Rlo and IL-6Rhi Treg subsets.
Fig. 3
Fig. 3
Reduction of Treg markers is restricted to the IL-6RhiTIGIT subset. (A) Gating strategy for the delineation of the three assessed mTreg subsets: IL-6Rlo (depicted in blue), IL-6RhiTIGIT+ (depicted in green) and IL-6RhiTIGIT (depicted in red). (B, C) Frequencies within the Treg subsets (GeoMean ± 95% CI) of the Treg markers HELIOS and FOXP3 (B), and CD25 and CTLA-4 (C) were assessed by flow cytometry in freshly isolated PBMCs from 33 healthy donors. P values were calculated using a two-tailed paired non-parametric Wilcoxon signed rank test.
Fig. 4
Fig. 4
IL-6RhiTIGIT mTregs are highly suppressive in vitro and display a Treg epigenetic profile. (A) Suppressive capacity of the three mTreg subsets was assessed by the ability to supress the proliferation of autologous CD45RA Teff cells in vitro. Data shown depict the suppressive capacity (mean ± SEM) of the assessed mTreg subsets at diluting Treg:Teff ratios, and was obtained from sorted cells from six independent donors. P values were calculated using a two-tailed paired t-test comparing the suppressive capacity of IL-6RhiTIGIT to the IL-6RloTIGIT+ and IL-6RhiTIGIT+ counterparts. *P < 0.05; **P < 0.01; ***P < 0.001. (B) Data depict the frequency of reads demethylated at eight or nine of the nine interrogated CpG sites in the FOXP3 Treg-specific demethylation region (TSDR) or at seven out of seven CpG sites in the CTLA4 locus. The data were obtained from sorted cells from three independent healthy male donors. Horizontal bars depict the median of the demethylated reads in each group. (C) Proliferative capacity of sorted (i) IL-6RhiTIGIT+ (depicted in green), (ii) IL-6RhiTIGIT (depicted in red), (iii) IL-6RloTIGIT+ (depicted in blue) mTregs, and (iv) CD127+ CD25 CD45RA Teff cells (depicted in black) was assessed in response to in vitro stimulation with α-CD3/CD28 beads and 100 U/ml exogenous IL-2. Data (mean ± SEM) were obtained from cells sorted from three independent donors. Proliferation and suppressive capacity were calculated using the Division Index in FlowJo, setting 0% suppression as the condition with the respective Teffs cultured in the absence of Tregs.
Fig. 5
Fig. 5
Ex vivo IL-6RhiTIGIT mTregs show a distinct Th17 transcriptional profile compared to conventional IL-6RloTIGIT+ mTregs. (A) Volcano plot depicts the differential expression of 579 immune genes in IL-6RhiTIGIT and IL-6RloTIGIT+ mTregs sorted ex vivo from nine healthy donors using NanoString. (B–D) Illustrative examples depicting the expression (GeoMean ± 95% CI) of (i) Th17 signature genes (marked in red), including RORC (RORγt), KLRB1 (CD161), IL1R1, IKZF3 (AIOLOS), and CCR6 (B); (ii) Tr1 signature genes LAG3 and IL10 (marked in purple) (C); (iii) the transcription factors LEF1 and TCF7 (TCF1) (marked in blue), involved in the suppression of Th17 differentiation; and (iv) Treg signature genes (marked in green), including TIGIT, HELIOS and FOXP3 (D), which were most differentially expressed in IL-6RhiTIGIT mTregs compared to their IL-6RloTIGIT+ counterparts. Sorting markers used for the flow-sort purification of the assessed Treg subsets are marked in black. P values were calculated using two-tailed paired non-parametric Wilcoxon signed rank tests, comparing the normalised NanoString read counts between IL-6RhiTIGIT and IL-6RloTIGIT+ mTregs.
Fig. 6
Fig. 6
IL-6RhiTIGIT Tregs display a significant cytokine-producing potential upon in vitro activation. (A) Heatmap depicts the differential expression of 40 selected genes between sorted IL-6RhiTIGIT mTregs and: (i) IL-6RloTIGIT+ mTregs; (ii) IL-6RhiTIGIT+ mTregs; or (iii) memory Teff cells from four healthy donors, upon in vitro activation with PMA + ionomycin. The genes shown in the figure represent the subset of 40 genes that were both: (i) significantly upregulated (adjusted P < 10− 5) in IL-6RhiTIGIT mTregs upon in vitro simulation; and (ii) differentially expressed (adjusted P < 10− 4) between activated IL-6RhiTIGIT and IL-6RloTIGIT+ mTregs. (B) Illustrative examples of cytokine genes upregulated in activated IL-6RhiTIGIT mTregs, including both pro- (IL-17A, IL-22 and CCL20) and anti-inflammatory (IL-10) cytokines. (C) Illustrative examples depicting downregulated Treg signature genes in activated IL-6RhiTIGIT Tregs, including IKZF2 (encoding for HELIOS) and TNFRSF9. (D) The expression of the IL-23 and IL-1 receptor genes (IL23R and IL1R1) were also specifically upregulated in activated IL-6RhiTIGIT mTregs.
Fig. 7
Fig. 7
IL-17 and IL-10 are not produced by the same cells. (A,B) Data shown depict the frequency (GeoMean ± 95%CI) of IL-17+ (A) and IL-10+ (B) cells among CD45RA TIGIT mTregs, stratified by the expression of HELIOS and FOXP3. IL-17 and IL-10 production was assessed by intracellular flow cytometry in freshly isolated PBMCs from 10 healthy donors, following in vitro activation with PMA + ionomycin. (C) Data depict the frequency (GeoMean ± 95%CI) of IL-17 and IL-10 single-producers as well as IL-17/IL-10 double producers among the CD45RA TIGIT Treg subset.

References

    1. Kitagawa Y., Ohkura N., Sakaguchi S. Epigenetic control of thymic Treg-cell development. Eur. J. Immunol. 2015;45:11–16. - PubMed
    1. Kitagawa Y., Ohkura N., Sakaguchi S. Molecular determinants of regulatory T cell development: the essential roles of epigenetic changes. Front. Immunol. 2013;4:106. - PMC - PubMed
    1. Huehn J., Polansky J.K., Hamann A. Epigenetic control of FOXP3 expression: the key to a stable regulatory T-cell lineage? Nat. Rev. Immunol. 2009;9:83–89. - PubMed
    1. Baine I., Basu S., Ames R., Sellers R.S., Macian F. Helios induces epigenetic silencing of Il2 gene expression in regulatory T cells. J. Immunol. 2013;190:1008–1016. - PMC - PubMed
    1. Yamanouchi J., Rainbow D., Serra P., Howlett S., Hunter K., Garner V.E.S., Gonzalez-Munoz A., Clark J., Veijola R., Cubbon R., Chen S.-L., Rosa R., Cumiskey A.M., Serreze D.V., Gregory S., Rogers J., Lyons P.A., Healy B., Smink L.J., Todd J.A., Peterson L.B., Wicker L.S., Santamaria P. Interleukin-2 gene variation impairs regulatory T cell function and causes autoimmunity. Nat Genet. 2007;39:329–337. - PMC - PubMed

Publication types