. 2017 Mar 22;93(6):1436-1450.e8.
doi: 10.1016/j.neuron.2017.02.029. Epub 2017 Mar 9.

Dynamic Nigrostriatal Dopamine Biases Action Selection

Affiliations

Dynamic Nigrostriatal Dopamine Biases Action Selection

Christopher D Howard et al. Neuron. .

Abstract

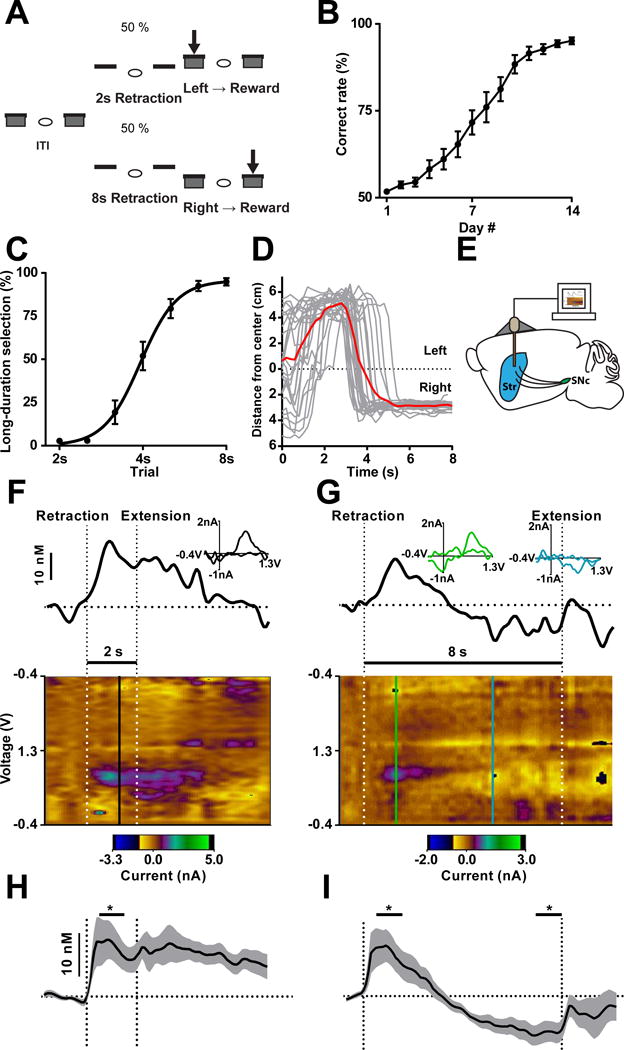
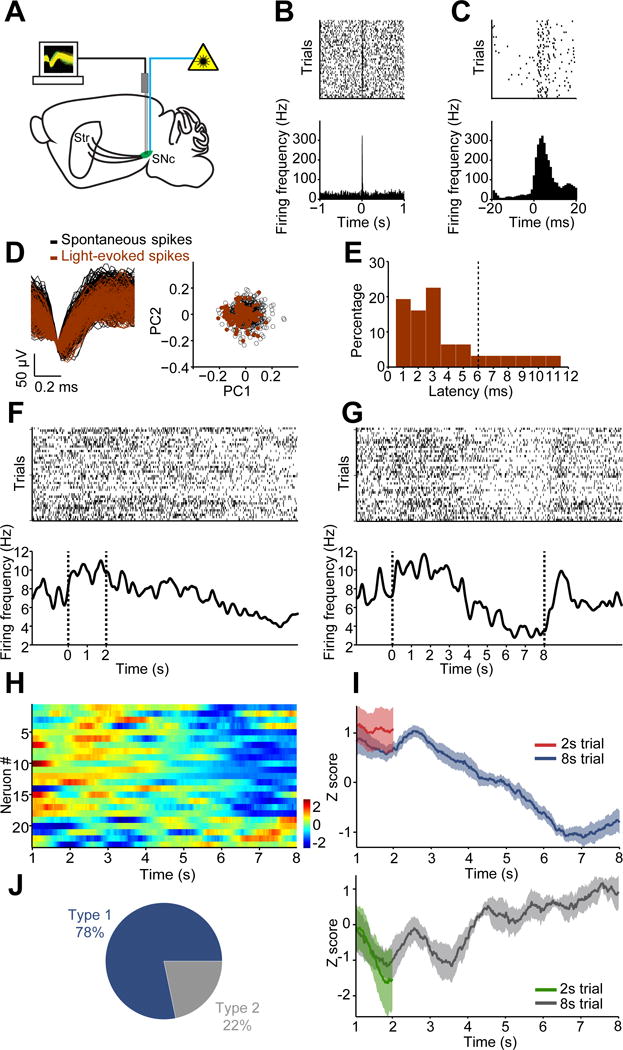
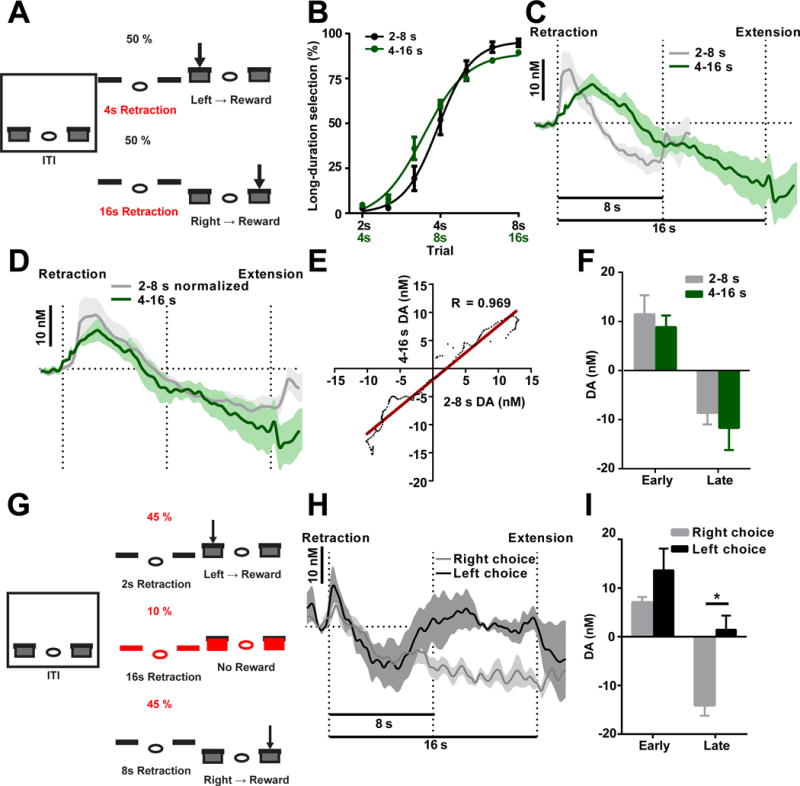
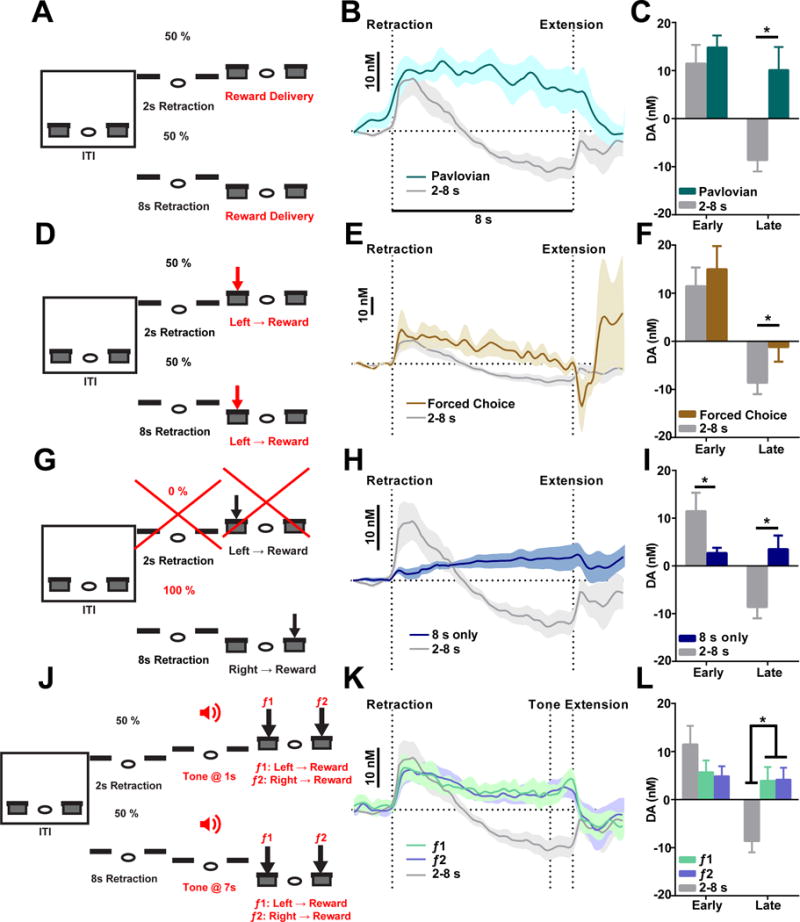
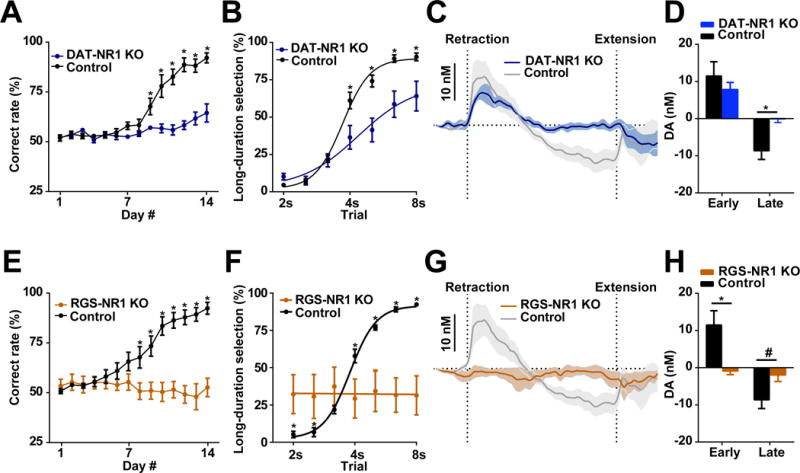
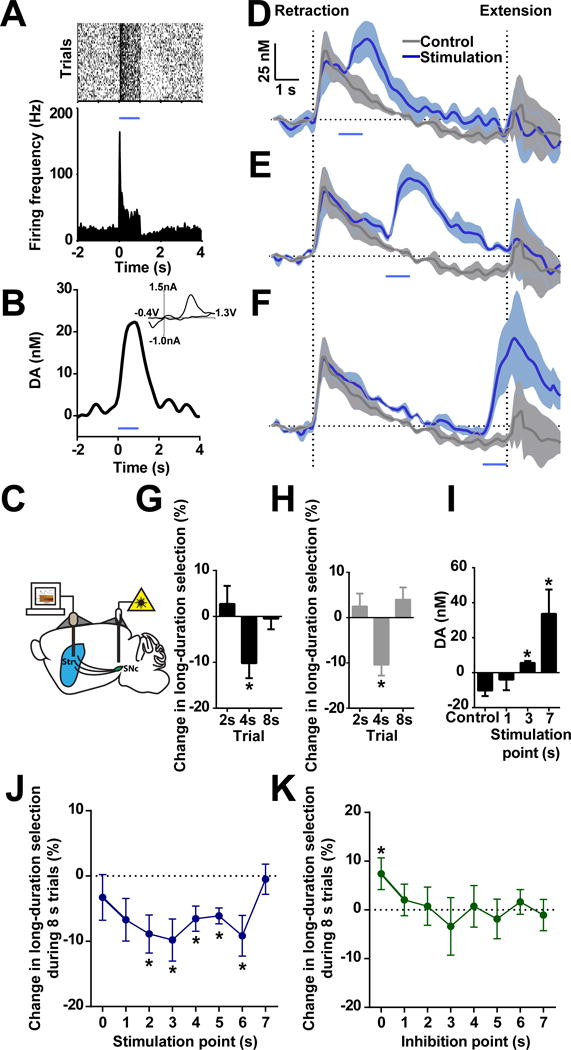
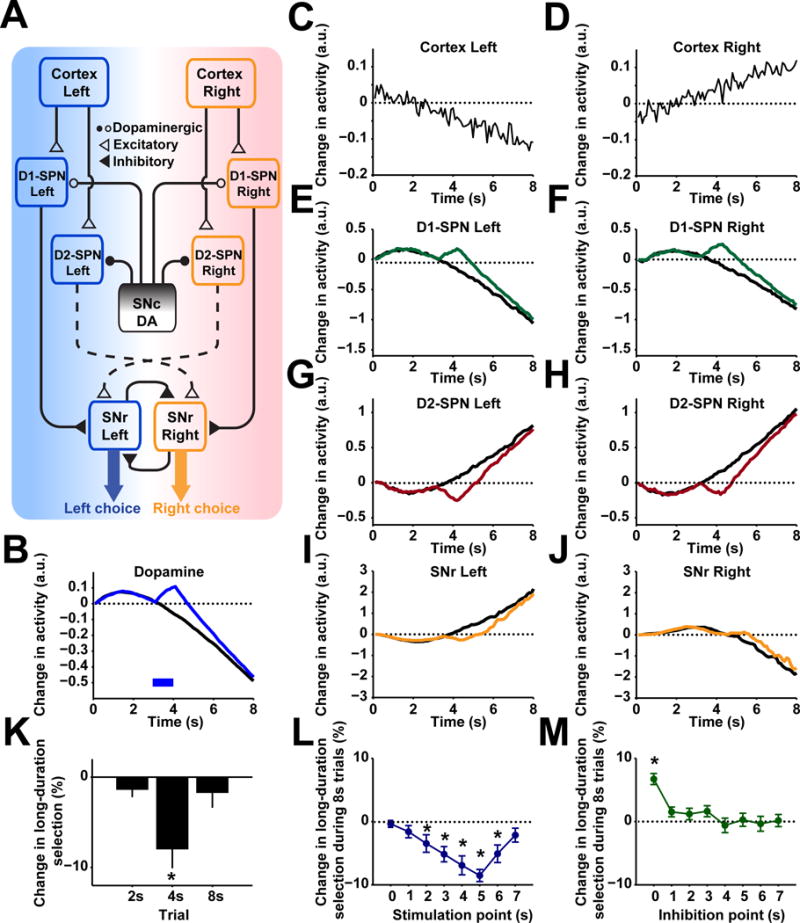
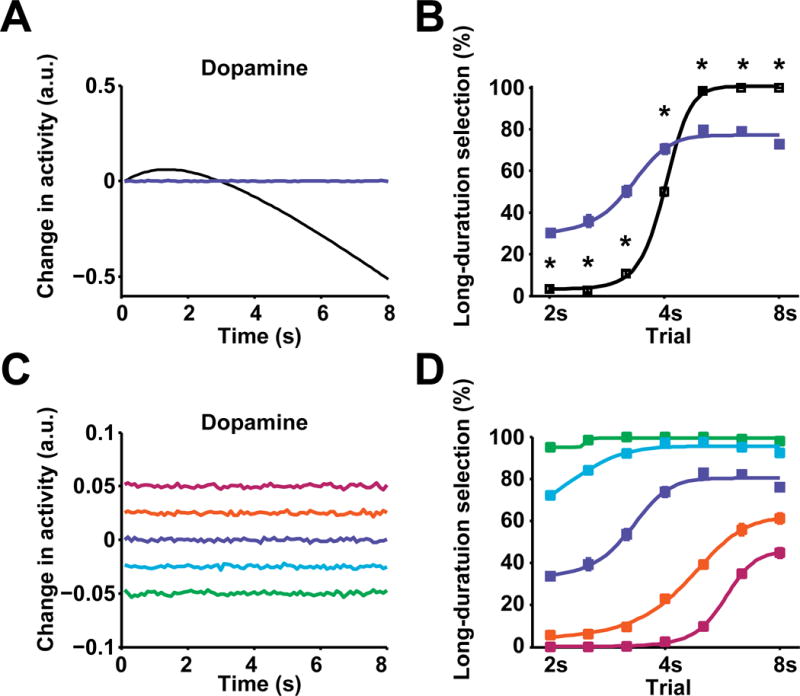
Dopamine is thought to play a critical role in reinforcement learning and goal-directed behavior, but its function in action selection remains largely unknown. Here we demonstrate that nigrostriatal dopamine biases ongoing action selection. When mice were trained to dynamically switch the action selected at different time points, changes in firing rate of nigrostriatal dopamine neurons, as well as dopamine signaling in the dorsal striatum, were found to be associated with action selection. This dopamine profile is specific to behavioral choice, scalable with interval duration, and doesn't reflect reward prediction error, timing, or value as single factors alone. Genetic deletion of NMDA receptors on dopamine or striatal neurons or optogenetic manipulation of dopamine concentration alters dopamine signaling and biases action selection. These results unveil a crucial role of nigrostriatal dopamine in integrating diverse information for regulating upcoming actions, and they have important implications for neurological disorders, including Parkinson's disease and substance dependence.

Keywords: action selection; basal ganglia; conditional knockout; direct and indirect pathway; dopamine; electrophysiology; fast-scan cyclic voltammetry; network model; optogenetics; striatum.


Figures

Figure 1
Figure 1. Nigrostriatal dopamine signaling associated with action selection
(A) Task design of 2–8 s task. (B) Mice improve performance of the action selection task over two weeks training. n = 17 mice. P < 0.0001; one-way repeated measures ANOVA. (C) Psychometric curve of interval discrimination. n = 7 mice. P < 0.0001; one-way repeated measures ANOVA. (D) Behavioral tracking of a representative mouse during 8 s trials. Tracks for individual trials shown in grey and average shown in red. (E) Cartoon of carbon fiber microelectrodes implanted bilaterally into dorsal striatum (Str). (F and G) Representative real-time changes in dopamine concentration in dorsal striatum during correctly performed 2 s (F) and 8 s (G) trials. Thick black line shows change in dopamine concentration over time aligned to lever retraction/extension (vertical dotted lines) above a pseudocolor plot, which illustrates the change in current recorded at each point in the voltage sweep across time. Baseline is denoted by horizontal dotted line. INSET shows a cyclic voltammogram collected at the vertical lines on the pseudocolor plot identifying the current recorded as either positive (black in F, green in G) or negative (blue in G) changes in dopamine. (H) Average correct 2 s trials show increases in dopamine at lever retraction relative to baseline. n = 11 mice. P < 0.05; paired t-test. (I) Dopamine increases in the early phase (0.5–1.5 s) and decreases below baseline in the late phase (7–8 s) during 8 s trials. n = 11 mice. P < 0.01; one-way repeated measures ANOVA with Fisher’s LSD post hoc tests. Data are shown as mean ± SEM. * P < 0.05. Same for below unless stated otherwise.
Figure 2
Figure 2. SNc Dopamine neurons display action selection-specific firing activity
(A) Diagram of simultaneous neuronal recording and optogenetic stimulation in substantia nigra pars compacta (SNc). (B) Top panel: Raster plot for a representative dopamine neuron response to 100 ms optogenetic stimulation. Each row represents one trial and black ticks represent spikes. Bottom panel: Averaged firing rate aligned to light onset at 0. (C) Raster plot and averaged firing rate for the same neuron as shown in (B) with a finer time scale. (D) Left panel: Waveforms from the same neuron in (B) for spontaneous (black) and light-evoked (red) spikes (R = 0.998, P < 0.0001, Pearson’s correlation). Right panel: Principal component analysis (PCA) of spontaneous and light-evoked waveforms shows the overlapped clustering of spontaneous (black) and light-evoked (red) spikes. (E) Histogram showing latency of optogenetically-evoked neuronal response. The vertical line (6ms) shows the criterion considered for inclusion. (F and G) Raster plots (top) and firing rate (bottom) for a representative dopamine neuron during 2 s (F) and 8 s (G) trials. (H) Z-score of neuronal activity for all positively identified dopamine neurons in 8 s trials. (I) Averaged neuronal activity of decreasing (Type 1) and increasing (Type 2) neurons during the 2 s trials and 8 s trials. (J) Proportion of Type 1 and Type 2 dopamine neurons.
Figure 3
Figure 3. Dopamine changes are scalable to time intervals and are related to action selection
(A) Task design for the 4–16 s task. (B) Psychometric curves for mice trained on 2–8 s task (black) and 4–16 s task (green). n = 7 for 2–8 s, n = 4 for 4–16 s. P > 0.05; two-way repeated measures ANOVA. (C) Dopamine recorded during the 16 s trials in the 4–16 s. (D and E) Dopamine recorded in both tasks are normalized to fit the same timescale (D), and they are significantly correlated (E; R = 0.969, P < 0.0001). (F) Dopamine magnitude is similar during the early (unpaired t-test, P > 0.05, n = 6 for 4–16 s, n = 11 for 2–8 s) and late phases (unpaired t-test, P > 0.05, n = 6 for 4–16 s, n = 11 for 2–8 s). (G) Task diagram for 16 s probe trials. (H) Dopamine recorded in 16 s probe trials (black: short-duration lever selection; grey: long-duration lever selection). (I) Dopamine signaling in the early phase (paired t-test, P > 0.05, n = 4) and late phase (paired t-test, P > 0.05, n = 4).
Figure 4
Figure 4. Dopamine changes in 2–8 s task are not simply tracking relative timing, changes in value, or uncertainty
(A) Task design for 2–8 s Pavlovian task. (B) Recordings in the Pavlovian task are shown in teal and recordings from the 2–8 s task are shown in grey. (C) Dopamine magnitude between the 2–8 s Pavlovian and 2–8 s task during the early phase and late phase. P > 0.05 for early; P < 0.001 for late; unpaired t-test. (D) Task design for 2–8 s forced choice task. (E) Recordings in the forced choice task are shown in brown and recordings from the 2–8 s task are shown in grey. (F) Dopamine magnitude between the forced choice task and 2–8 s task during the early phase and late phase. P > 0.05 for early, P < 0.05 for late; unpaired t-test. (G) Task design for 8 s only task. (H) Recordings in the 8 s only task are shown in blue and recordings from the 2–8 s task are shown in grey. (I) Dopamine magnitude between the 8 s only task and 2–8 s task during the early phase and late phase. P < 0.05 for early, P < 0.001 for late; unpaired t-test. (J) Task design for 2–8 s tone task. (K) Dopamine recorded during 8 s trials with presentation of f1 (green) and f2 (purple). (L) Dopamine magnitude in the tone task and 2–8 s task during the early phase and late phase. P >0.05 for early, P < 0.05 for late; two-way repeated measures ANOVA, significant interaction between time and groups, with significant LSD post hoc tests.
Figure 5
Figure 5. Selectively deleting NMDA receptors in either dopamine or striatal projection neurons disrupts dopamine signaling and alters action selection
(A) Performance of DAT-NR1 KO mice during 14 days training. n = 7 DAT-NR1 KO, n = 6 control. P < 0.0001; two-way repeated measures ANOVA, significant effect of group; *significant Fisher’s LSD post hoc tests. (B) Psychometric curve of DAT-NR1 KO and control mice. n = 7 DAT-NR1 KO, n = 6 control. P < 0.05; two-way repeated measures ANOVA, significant effect of group; *significant Fisher’s LSD post hoc tests. (C) Dopamine recorded in DAT-NR1 KO mice. n = 4 DAT-NR1 KO, n = 11 control. (D) Dopamine magnitude during early and late phase. n = 4 DAT-NR1 KO, n = 11 control. P > 0.05 for early, P < 0.05 for late; unpaired t-test. (E) Performance of RGS-NR1 KO mice during 14 days training. n = 6 RGS-NR1 KO, n = 9 control. P < 0.01; two-way repeated measures ANOVA, significant effect of group, *significant Fisher’s LSD post hoc tests. (F) Psychometric curve of RGS-NR1 KO mice. n = 6 RGS-NR1 KO, n = 9 control. P < 0.0001; two-way repeated measures ANOVA, significant group × time interaction, *significant Fisher’s LSD post hoc tests. (G) Dopamine recorded in RGS-NR1 KO mice. n = 4 RGS-NR1 KO, n = 11 control. (H) Dopamine magnitude during early and late phase. n = 4 RGS-NR1 KO, n = 11 control. P < 0.05 for early; P = 0.065 for late; unpaired t-test. Dopamine traces are shown as mean ± SEM. * P < 0.05, # P < 0.1.
Figure 6
Figure 6. Optogenetic manipulations of dopamine signaling bias action selection
(A) Optogenetic stimulation of nigral dopamine neuron for 1 s drives firing activity in vivo. Stimulation is shown as blue line for current and following panels. (B) 1 s optogenetic stimulation evokes robust dopamine release. INSET shows current versus voltage identifying the recorded analyte as dopamine. (C) Fiber microelectrode placement in dorsal striatum (Str) and bilateral fiber optic placement in substantia nigra pars compacta (SNc). (D–F) Simultaneous optogenetic stimulation and FSCV recording during optical stimulation at 1 (D), 3 (E), and 7 s (F) in 8 s trials. (G) Immediate behavioral effects under dopamine neuron stimulation. n = 11. P < 0.01 in 4 s trials; P > 0.05 in 2 or 8 s trials; one sample t-test. (H) Immediate behavioral effects while stimulating dopamine terminals in striatum. n = 3. P < 0.05 in 4 s trials; P > 0.05 in 2 or 8 s trials; one sample t-test. (I) Dopamine recorded with optogenetic stimulation at 1, 3 or 7 s. n = 3. P > 0.05 for 1 s; P < 0.05 for 3 and 7 s; paired t-test. (J) Change in long-duration selection in 8 s trials during optogenetic stimulation of dopamine at various time points. n = 11. one sample t-test, *P < 0.05. (K) Change in long-duration selection in the 8 s trials during optogenetic inhibition of dopamine at various time points. n = 7. one sample t-test, *P < 0.05. Dopamine traces are shown as mean ± SEM.
Figure 7
Figure 7. Computational model of dopamine biasing action selection through basal ganglia circuitry
(A) Network structure of the cortico-basal ganglia action selection model. For all panels, ‘left’ and ‘right’ refers to activity encoding the left or right choice. (B) Modeled changes in dopamine during control (black) and stimulation trials (blue) across 8 s trials with stimulation occurring at 3 s following lever retraction. (C and D) Modeled cortical inputs to striatal populations that encode information about left or right choice. (E and F) Modeled changes in D1 spiny projection neurons (SPNs) populations encoding either left or right choice under control (black) and stimulation (green). (G and H) Modeled changes in D2 SPNs encoding either left or right choice under control (black) and stimulation (red). (I and J) Modeled changes in SNr populations encoding left or right choice under control (black) and stimulation (orange). (K) Predicted changes in behavioral output based on SNr activity during probe trials of 2, 4, or 8 s duration where 1-s stimulation occurs at 1, 3, or 7 s, respectively. n = 10. one sample t-test, *P < 0.05. (L) Predicted changes in behavioral output during 8 s trials with stimulation occurring at each second across the 8 s interval. n = 10. one sample t-test, *P < 0.05. (M) Predicted changes in behavioral output during 8 s trials with inhibition occurring at each second across the 8 s interval. n = 10. one sample t-test, *P < 0.05. Data show mean ± SEM of 10 modeled subjects.
Figure 8
Figure 8. Dynamic dopamine is crucial for optimizing action selection
(A) Modeled dynamic (black) and constant (blue) dopamine in 8 s trials. (B) Model output of psychometric curve for behavioral choice under dynamic (black, n = 10) and constant dopamine (blue, n = 10; P < 0.0001; two-way repeated measures ANOVA, significant effect of group, *significant Fisher’s LSD post hoc tests,). (C) Modeled dopamine at five different constant levels (−0.05, −0.025, 0, 0.025, 0.05) in 8 s trials. (D) Model output of psychometric curves for behavioral choice under constant dopamine of corresponding levels. Psychometric curves for different dopamine levels are color coded the same as (C). n = 10 modeled subjects.

References

    1. Barter JW, Li S, Lu D, Bartholomew RA, Rossi MA, Shoemaker CT, Salas-Meza D, Gaidis E, Yin HH. Beyond reward prediction errors: the role of dopamine in movement kinematics. Front Integr Neurosci. 2015;9:39. - PMC - PubMed
    1. Berridge KC, Robinson TE. What is the role of dopamine in reward: hedonic impact, reward learning, or incentive salience? Brain Res Brain Res Rev. 1998;28:309–369. - PubMed
    1. Bonci A, Malenka RC. Properties and plasticity of excitatory synapses on dopaminergic and GABAergic cells in the ventral tegmental area. J Neurosci. 1999;19:3723–3730. - PMC - PubMed
    1. Bromberg-Martin ES, Matsumoto M, Hikosaka O. Dopamine in motivational control: rewarding, aversive, and alerting. Neuron. 2010;68:815–834. - PMC - PubMed
    1. Brunton BW, Botvinick MM, Brody CD. Rats and humans can optimally accumulate evidence for decision-making. Science. 2013;340:95–98. - PubMed