. 2017 Mar 21;46(3):488-503.
doi: 10.1016/j.immuni.2017.02.010. Epub 2017 Mar 9.

Integrative Proteomics and Phosphoproteomics Profiling Reveals Dynamic Signaling Networks and Bioenergetics Pathways Underlying T Cell Activation

Affiliations

Integrative Proteomics and Phosphoproteomics Profiling Reveals Dynamic Signaling Networks and Bioenergetics Pathways Underlying T Cell Activation

Haiyan Tan et al. Immunity. .

Abstract

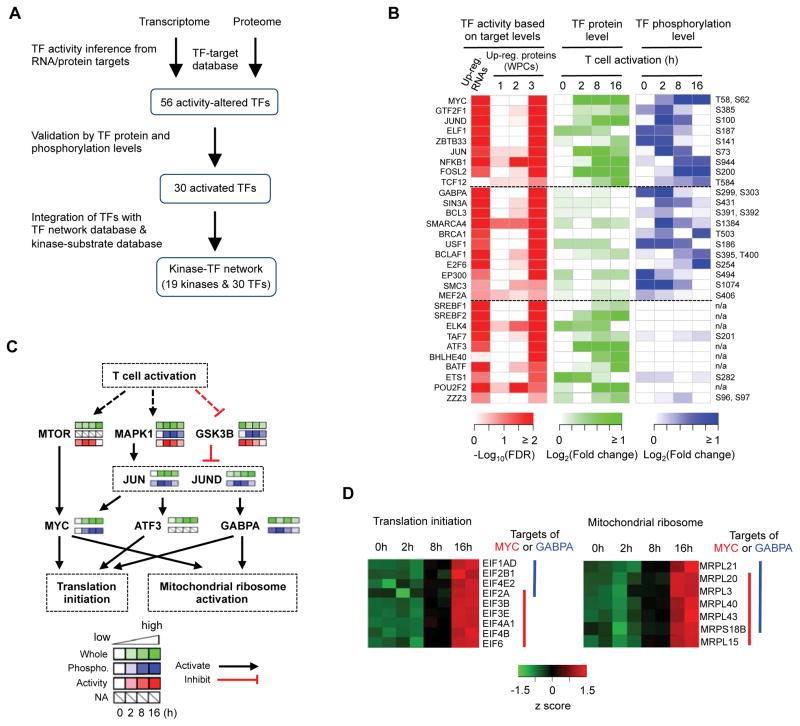
The molecular circuits by which antigens activate quiescent T cells remain poorly understood. We combined temporal profiling of the whole proteome and phosphoproteome via multiplexed isobaric labeling proteomics technology, computational pipelines for integrating multi-omics datasets, and functional perturbation to systemically reconstruct regulatory networks underlying T cell activation. T cell receptors activated the T cell proteome and phosphoproteome with discrete kinetics, marked by early dynamics of phosphorylation and delayed ribosome biogenesis and mitochondrial activation. Systems biology analyses identified multiple functional modules, active kinases, transcription factors and connectivity between them, and mitochondrial pathways including mitoribosomes and complex IV. Genetic perturbation revealed physiological roles for mitochondrial enzyme COX10-mediated oxidative phosphorylation in T cell quiescence exit. Our multi-layer proteomics profiling, integrative network analysis, and functional studies define landscapes of the T cell proteome and phosphoproteome and reveal signaling and bioenergetics pathways that mediate lymphocyte exit from quiescence.

Keywords: T cell; glycolysis; kinase; mTORC1; mitochondria; phosphoproteomics; proteomics; quiescence exit; systems biology; systems immunology.


Figures

Figure 1
Figure 1. Temporal profiling of whole proteome and phosphoproteome during T cell activation
(A) Experimental scheme. (B) Immunoblot analysis of selected proteins and phosphorylation events. (C) MS quantification of the selected proteins and phosphorylation events is highly consistent with immunoblot analysis in (B). (D) Representative null comparisons of whole proteome and phosphoproteome (0h.a/0h.b and 16h.a/16h.b) display markedly distinct patterns from true comparisons (16h.a/0h.a and 16h.b/0h.b replicates). The color scheme indicates different numbers of proteins or phosphopeptides. Correlation coefficient (r) for each comparison is indicated. (E) Principal component analysis of all identified proteins and phosphopeptides. (F) Cluster analysis of differentially expressed proteins and phosphopeptides. See also Figure S1 and Data S1.
Figure 2
Figure 2. Temporal expression profiling of whole proteome reveals co-expression clusters and functional modules during T cell activation
(A) Overview of computational analysis for whole proteome. (B) Six co-expression clusters of whole proteome (WPCs). Each line indicates the relative abundance of each protein and is color-coded by the cluster membership. Selective proteins in each WPC are shown. (C) Functional annotations of WPCs by Gene Ontology (GO), KEGG and Hallmark databases (FDR < 0.05). (D) Distribution of module size, with modules identified by superimposition of proteins in each WPC onto the protein-protein interaction (PPI) network. The numbers of proteins from each module are shown. (E) Diagram of the individual modules and their interactions. Circles (nodes) represent the 90 modules, with the circle size proportional to module size. Edges connect modules that share PPIs. Boxed modules are further expanded in panels (F) and (G). (F) Four interconnected modules of cytoplasmic and mitochondrial ribosomes derived from WPC3. The names of proteins and the representative functional term for each module are shown. (G) Modules of proteasome, OXPHOS and mitochondrial complex IV pathways derived from WPC3. See also Figure S2 and Data S2.
Figure 3
Figure 3. T cell phosphoproteome profiling reveals co-expression clusters, multiple active kinases, and dynamically regulated kinase signaling networks
(A) Overview of computational analysis for phosphoproteome. (B) Seven co-expression phosphoproteome clusters (PPCs). Each line indicates the relative abundance of each protein and was color-coded by the cluster membership. (C) Functional annotations of PPCs by Gene Ontology (GO), KEGG and Hallmark databases (FDR < 0.05). (D) Kinase activity inference based on substrate phosphorylation levels. The asterisk indicates kinases that are shown in Figure 3E. (E) Kinase-to-kinase network upon TCR stimulation. See also Figure S3 and Data S3.
Figure 4
Figure 4. Integrated network analysis reveals key transcription factors and kinases and the connectivity between them in T cell activation
(A) Overview of the integrative analysis based on transcriptome, whole proteome, phosphoproteome, TF-target database, and kinase-substrate database. (B) Activated TFs during T cell activation. (C) Prediction of a putative signaling cascade comprised of key kinases and TFs in the control of protein translation machinery. (D) Mitochondrial ribosome and translation initiation proteins are activated by MYC and GABPA. The protein levels of the TF downstream targets are indicated. See also Figure S4 and Data S4.
Figure 5
Figure 5. Integrative analysis of Rptor-deficient proteom0e identifies mTORC1-dependent mitochondrial pathways
(A) Overview of Raptor-dependent proteomics analysis. (B) Five Raptor-dependent whole proteome co-expression clusters (RWPCs) defined by WGCNA. (C) Functional annotations of RWPCs by Gene Ontology (GO), KEGG and Hallmark databases. (D) TFs attenuated by Raptor deficiency. For TFs with an asterisk, a larger scale (e.g. maximum fold change of 10 instead of 2 folds) is used to reflect the large change of protein expression or phosphorylation abundance. (E) Raptor-dependent mitochondrial pathways. The related protein levels are shown. (F) Immunofluorescence images of ACTIN (green) and COX11 in naïve and activated WT and Rptor-deficient CD4+ T cells (scale bars, 5 μm). Right, statistical analysis of mean fluorescence intensity (MFI) of COX11 in WT and Rptor-deficient CD4+ T cells. (G) Immunoblot of SHMT2 and MTHFD2 expression in WT and Rptor-deficient CD4+ T cells stimulated with α-CD3-CD28 for the indicated time points. Numbers below the lanes of SHMT2 and MTHFD2 indicate band intensity relative to that of the loading control-β-ACTIN. Data are representative of two (F–G) independent experiments. P values are determined by one-way ANOVA with Tukey post-tests (F). ***P < 0.001. See also Figure S5 and Data S5.
Figure 6
Figure 6. mTORC1-dependent mitoribosome synthesis and complex IV, but not HK2-mediated glycolysis, contribute to T cell quiescence exit
(A) Immunofluorescence images of ACTIN (green) and MRPS16 (red) or MRPL20 (red) in naïve and activated WT and Rptor-deficient CD4+ T cells (scale bars, 5 μm). Right, statistical analysis of mean fluorescence intensity (MFI) of MRPS16 and MRPL20 in WT and Rptor-deficient CD4+ T cells. (B) Flow cytometry of CFSE-labeled CD4+ T cells stimulated with α-CD3-CD28 in the presence of tigecycline or chloramphenicol for 60 h. (C) BrdU incorporation of activated CD4+ T cells in the presence of tigecycline or chloramphenicol (24 h). (D) Extracellular acidification rate (ECAR) and oxygen consumption rate (OCR) of activated WT and Cox10-deficient CD4+ T cells (24 h). (E) OCR of activated WT and Cox10-deficient CD4+ T cells (24 h) in response to the indicated mitochondrial inhibitors (Oligo, Oligomycin; FCCP, carbonyl cyanide p-trifluoromethoxyphenylhydrazone; and Rot/AA, Rotenone/Antimycin A). (F) IL-2 secretion of activated WT and Cox10-deficient CD4+ T cells (24 h). (G) BrdU incorporation of activated WT and Cox10-deficient CD4+ T cells (24 h). (H) Expression of glycolytic enzymes and transporters in TCR-activated T cells detected by proteomics profiling. The x-axis shows the induction of protein expression at 8 h, and the y-axis shows the induction of protein expression at 16 h. (I) ECAR and OCR of activated WT and Hk2-deficient CD4+ T cells (24 h). (J) [3H]Thymidine incorporation of WT and Hk2-deficient CD4+ T cells stimulated with α-CD3 or α-CD3-CD28 for 64 h, and pulsed with [3H]thymidine for an additional 8 h. (K) BrdU incorporation of activated WT and Hk2-deficient CD4+ T cells (24 h). Data are representative of two (A–D, H–K) or three (E–G) independent experiments. Data are mean ± s.e.m. P values are determined by one-way ANOVA with Tukey post-tests (A), two-tailed Student’s t-test (D, I), or two-way ANOVA with Bonferroni post-tests (E). NS, not significant, *P < 0.05, **P < 0.005, and ***P < 0.001. Numbers in gates indicate percentage of cells. See also Figure S6.
Figure 7
Figure 7. COX10 deficiency impairs T cell homeostasis, Th1 cell differentiation and immune responses in vivo
(A) Flow cytometry of splenic CD4+ and CD8+ T cells from WT and Cox10fl/flCd4-Cre mice. Right, proportions and numbers of CD4+ and CD8+ T cells (n = 5–7 mice each group). (B) Expression of CD62L and CD44 on splenic CD4+ T cells from WT and Cox10fl/flCd4-Cre mice. (C) Flow cytometry of splenic CD4+ and CD8+ T cells from WT:CD45.1+ and Cox10fl/flCd4-Cre:CD45.1+ mixed BM chimeras. (D) Flow cytometry of the expression of IFNγ (upper) and Foxp3 (lower) in splenic CD4+ T cells from WT and Cox10fl/flCd4-Cre mice. Right, statistics of IFNγ-producing cells and Foxp3+ Treg cells. (E) Flow cytometry of IFNγ production in WT or Cox10-deficient T cells cultured under Th0 and Th1 conditions for 3–4 days. (F) Flow cytometry of splenic CD4+ TCR Vβ8+ T cells from WT and Cox10fl/flCd4-Cre mice treated with SEB (i.v. 100 μg/mouse) for 2 days. Bottom, proportion and number of CD4+ TCR Vβ8+ T cells. (G, H) Flow cytometry of IFNγ-producing CD4+ (G) and TNFα-producing CD4+ (H) cells in the spleen from control (WT or Cox10+/flCd4-Cre) and Cox10fl/flCd4-Cre mice infected with L. monocytogenes-expressing OVA (LM-OVA) (WT, n = 4; Cox10+/fl, n = 6; Cox10fl/fl, n = 8 mice), after OVA peptide stimulation in vitro. Right, proportion and number of cytokine-producing T cells. Data are representative of at least three (A) or two (B–H) independent experiments. Data are mean ± s.e.m. P values are determined by Mann-Whitney test (A, F–H, cell proportion) or two-tailed Student’s t-test (A, F–H, cell number). NS, not significant, *P < 0.05, **P < 0.005 and ***P < 0.0001. Numbers in quadrants or gates indicate percentage of cells. See also Figure S7.

References

    1. Amiel E, Everts B, Fritz D, Beauchamp S, Ge B, Pearce EL, Pearce EJ. Mechanistic target of rapamycin inhibition extends cellular lifespan in dendritic cells by preserving mitochondrial function. J Immunol. 2014;193:2821–2830. - PMC - PubMed
    1. Amit I, Regev A, Hacohen N. Strategies to discover regulatory circuits of the mammalian immune system. Nat Rev Immunol. 2011;11:873–880. - PMC - PubMed
    1. Buck MD, O’Sullivan D, Pearce EL. T cell metabolism drives immunity. J Exp Med. 2015;212:1345–1360. - PMC - PubMed
    1. Calvo SE, Clauser KR, Mootha VK. MitoCarta2.0: an updated inventory of mammalian mitochondrial proteins. Nucleic Acids Res. 2016;44:D1251–1257. - PMC - PubMed
    1. Chang CH, Curtis JD, Maggi LB, Jr, Faubert B, Villarino AV, O’Sullivan D, Huang SC, van der Windt GJ, Blagih J, Qiu J, et al. Posttranscriptional control of T cell effector function by aerobic glycolysis. Cell. 2013;153:1239–1251. - PMC - PubMed

Publication types