. 2017 Apr 11;8(4):1018-1031.
doi: 10.1016/j.stemcr.2017.02.004. Epub 2017 Mar 9.

Lineage Specification from Prostate Progenitor Cells Requires Gata3-Dependent Mitotic Spindle Orientation

Affiliations

Lineage Specification from Prostate Progenitor Cells Requires Gata3-Dependent Mitotic Spindle Orientation

Maxwell E R Shafer et al. Stem Cell Reports. .

Abstract

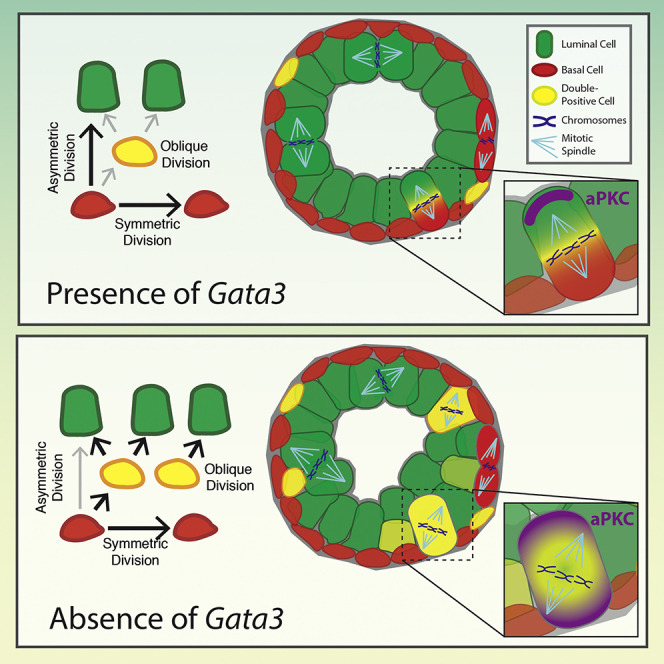
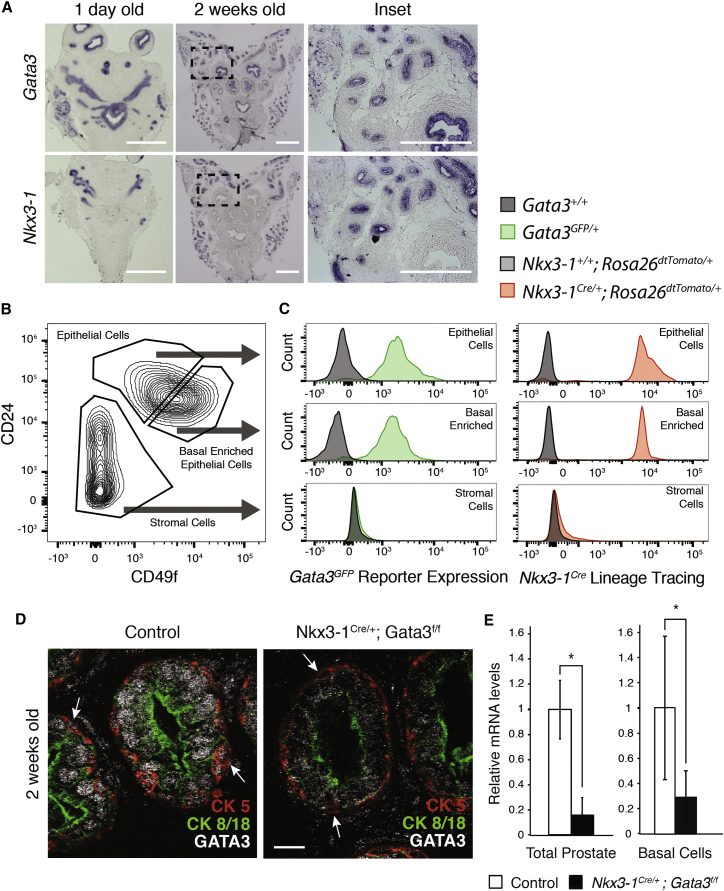
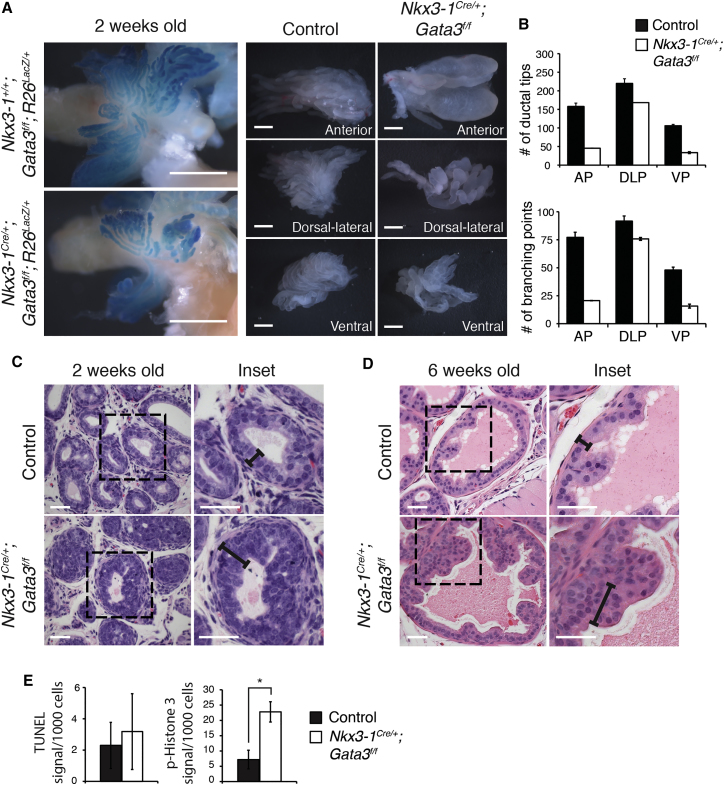
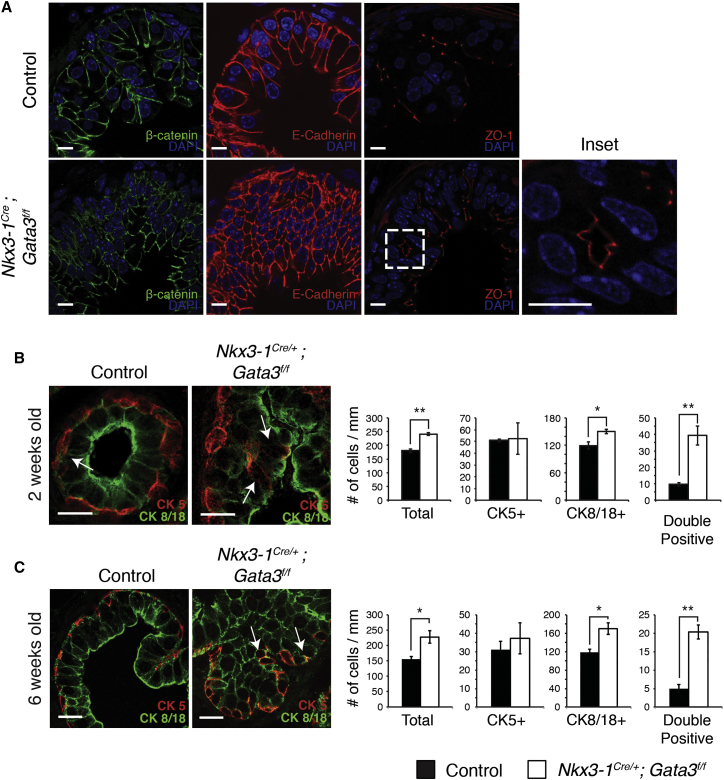
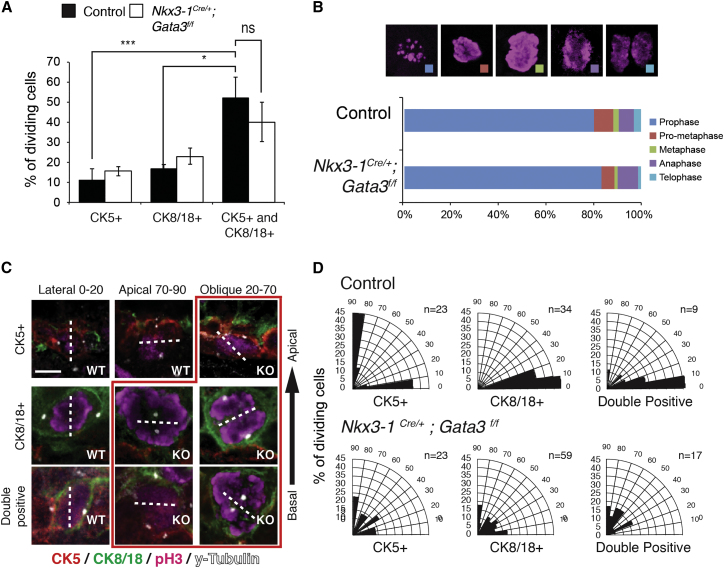
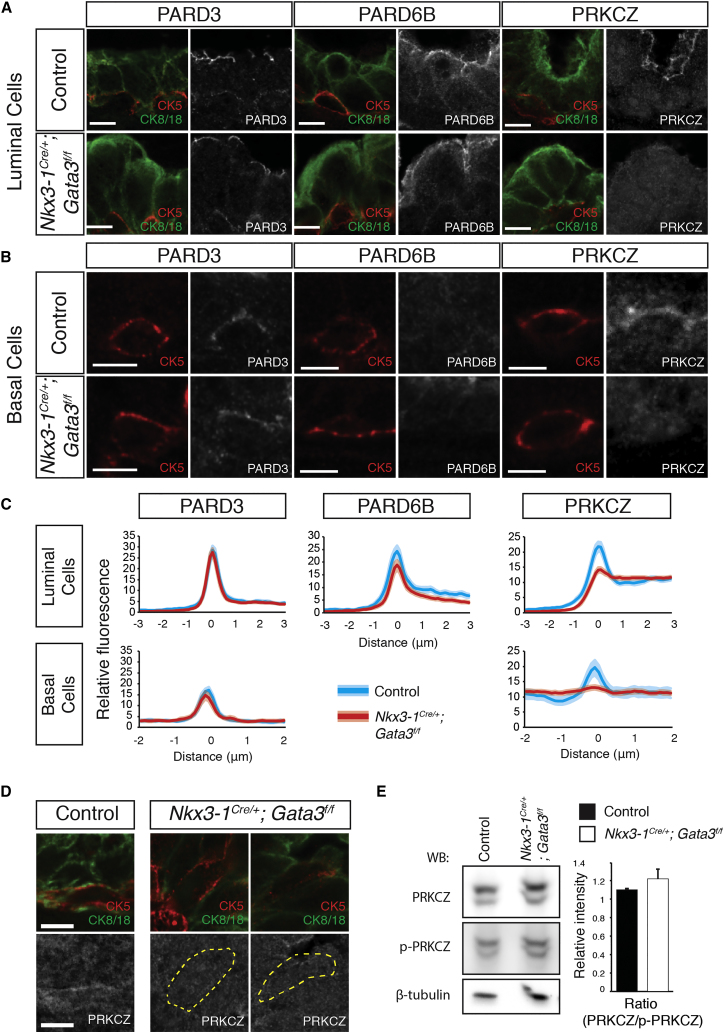
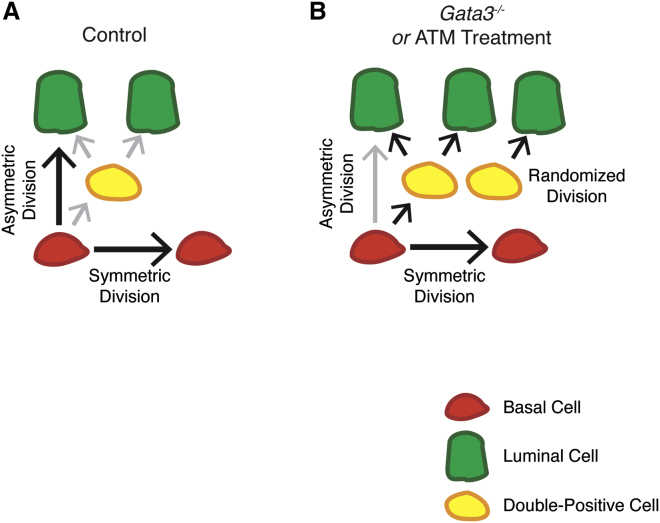
During prostate development, basal and luminal cell lineages are generated through symmetric and asymmetric divisions of bipotent basal cells. However, the extent to which spindle orientation controls division symmetry or cell fate, and the upstream factors regulating this process, are still elusive. We report that GATA3 is expressed in both prostate basal progenitor and luminal cells and that loss of GATA3 leads to a mislocalization of PRKCZ, resulting in mitotic spindle randomization during progenitor cell division. Inherently proliferative intermediate progenitor cells accumulate, leading to an expansion of the luminal compartment. These defects ultimately result in a loss of tissue polarity and defective branching morphogenesis. We further show that disrupting the interaction between PRKCZ and PARD6B is sufficient to recapitulate the spindle and cell lineage phenotypes. Collectively, these results identify a critical role for GATA3 in prostate lineage specification, and further highlight the importance of regulating spindle orientation for hierarchical cell lineage organization.

Keywords: GATA3; atypical protein kinase C; aurothiomalate; cell polarity; epithelial stratification; lineage specification; par complex; prostate development; prostate progenitor cells; spindle orientation.


Figures

None
Graphical abstract
Figure 1
Figure 1
Gata3 Is Expressed in Basal Cells during Prostate Development (A) In situ hybridization of Gata3 and Nkx3-1 mRNA in newborn (1 day old) and postnatal (2 weeks old) prostate tissue. Insets show detection of mRNA in epithelial cells but not in surrounding stromal cells. Scale bars, 0.5 mm. (B) Representative fluorescence-activated cell sorting (FACS) plot of prostate stromal, epithelial, and basal enriched cell populations from 2-week-old prostate tissue by CD24 and CD49f. (C) Expression levels of endogenous Gata3GFP and Nkx3-1Cre activated Rosa26dtTomato lineage tracing reporters in the basal cell-enriched populations from 2-week-old prostate tissue. Wild-type and Gata3GFP/+ mice, and Nkx3-1Cre/+;Rosa26dtTomato/+ and Nkx3-1+/+;Rosa26dtTomato/+ mice were used, respectively. (D) Immunohistochemistry against GATA3 protein in luminal (CK8/18+) and basal (CK5+) epithelial cells. Arrows indicate expression of GATA3 in basal cells. Scale bar, 5 μm. (E) qRT-PCR detection of Gata3 mRNA in total and FACS enriched basal cells from control and Nkx3-1Cre/+;Gata3flox/flox mice. Expression levels displayed are relative to control tissue and corrected on housekeeping Ppia expression levels. Representative images and quantifications are from four control and three Nkx3-1Cre/+;Gata3flox/flox prostates and independent sorted populations. p < 0.05.
Figure 2
Figure 2
Gata3 Is Required for Branching Morphogenesis and Prostate Epithelial Homeostasis (A) Ductal architecture of control and Nkx3-1Cre/+;Gata3flox/flox prostates and individual lobes at 2 weeks of age as shown by β-galactosidase staining. Scale bars, 1 mm. (B) Quantification of the number of prostate ducts and branch points in control and Nkx3-1Cre/+;Gata3flox/flox prostates. (C) H&E staining of developing (2-week-old) prostate sections in control and Nkx3-1Cre/+;Gata3flox/flox mice. Scale bars, 20 μm. (D) H&E staining of developing (6-week-old) prostate sections in control and Nkx3-1Cre/+;Gata3flox/flox mice. Black bars indicate the thickness of the epithelial layer. Scale bars, 20 μm. (E) Quantification of proliferating (phospho-histone H3-positive cells) and apoptotic (TUNEL staining) cells in control and Nkx3-1Cre/+;Gata3flox/flox tissue at P14. p < 0.05. Representative images and quantifications are from three control and Nkx3-1Cre/+;Gata3flox/flox prostates, except in (B), where error bars represent SE from two control and Nkx3-1Cre/+;Gata3flox/flox prostates.
Figure 3
Figure 3
Loss of Gata3 Disrupts Prostate Epithelial Polarity and Increases the Double-Positive Progenitor Cell Population (A) Immunofluorescence staining of basolateral (B-catenin and E-cadherin) and apical (ZO-1) markers in control and Nkx3-1Cre/+;Gata3flox/flox prostate tissue. (B) Immunofluorescence staining of basal (CK5) and luminal (CK8/18) cell markers in 2-week-old control and Nkx3-1Cre/+;Gata3flox/flox prostate and quantification of the number of single-positive basal (CK5+), luminal (CK8/18+), and double-positive intermediate progenitor (CK5+; CK8/18+) cells per millimeter of ductal circumference. (C) Immunofluorescence staining of basal (CK5) and luminal (CK8/18) cell markers in 6-week-old control and Nkx3-1Cre/+;Gata3flox/flox prostate and quantification of the number of single-positive basal (CK5+), luminal (CK8/18+), and double-positive intermediate progenitor (CK5+; CK8/18+) cells per millimeter of ductal circumference. Arrows in (B and C) indicate double-positive cells. p < 0.05, ∗∗p < 0.01. Representative images and quantifications are from four control and Nkx3-1Cre/+;Gata3flox/flox prostates. Error bars represent SE from three (B) and four (C) control and Nkx3-1Cre/+;Gata3flox/flox prostates. Scale bars, 10 μm.
Figure 4
Figure 4
Loss of Gata3 Randomizes Spindle Orientation in Basal Progenitor Cells without Affecting Their Proliferation Rate (A) Percentage of dividing cells in each epithelial lineage in control and Nkx3-1Cre/+;Gata3flox/flox prostate tissue. (B) Analysis of the phases of mitosis in control and Nkx3-1Cre/+;Gata3flox/flox prostate tissue. (C) Mitotic spindle orientation was measured in basal (CK5+), luminal (CK8/18+), and double-positive cells (CK5+; CK8/18+) of control and Nkx3-1Cre/+;Gata3flox/flox (red box) prostate tissue by γ-tubulin (spindle poles) and phospho-histone H3 (dividing cells) immunofluorescence staining. (D) Quantification of spindle orientations in the three cell types in control and Nkx3-1Cre/+;Gata3flox/flox prostate. Dashed lines indicate axis of cytokinesis. p < 0.05, ∗∗∗p < 0.001; ns, not significant. Quantifications are from four control and Nkx3-1Cre/+;Gata3flox/flox prostates. Error bars in (A) represent SE from four control and Nkx3-1Cre/+;Gata3flox/flox prostate replicates. n values in (D) represent the total number of cell divisions quantified per cell type. Scale bars, 5 μm.
Figure 5
Figure 5
Gata3 Controls PRKCZ Localization in Prostate Basal and Luminal Cells (A) Immunofluorescence of PARD3, PARD6B, and PRKCZ in luminal cells of control and Nkx3-1Cre/+;Gata3flox/flox prostates. (B) Immunofluorescence of PARD3, PARD6B, and PRKCZ in basal cells of control and Nkx3-1Cre/+;Gata3flox/flox prostates. (C) Quantification of PARD3, and PRKCZ fluorescence intensity across the apical membrane in luminal and basal cells measured from the lumen (−3/2) to the nucleus (+3/2), and quantification of PARD6B localization in luminal cells. (D) Example immunofluorescence images of CK5, CK8/18, and PRKCZ staining in double-positive intermediate cells. Dashed lines indicate the periphery of double-positive cells. (E) Western blot of PRKCZ and T-560 phosphorylated PRKCZ from control and Nkx3-1Cre/+;Gata3flox/flox mice. Images are representative of results from five control or Nkx3-1Cre/+;Gata3flox/flox prostates, and quantification is from three control and Nkx3-1Cre/+;Gata3flox/flox prostates (thickness of lighter red and blue bands represent SD from the mean). Scale bars, 5 μm.
Figure 6
Figure 6
Disruption of PRKCZ-PARD6B Interaction Increases the Population of Double-Positive Intermediate Progenitor Cells in the Developing Prostate (A) Timeline of ATM administration to adolescent male mice. (B) Representative examples of spindle orientations in control or ATM-treated prostates at 6 weeks old. Dashed lines indicate axis of cytokinesis. (C) Quantification of mitotic spindle orientation measured in basal (CK5+), luminal (CK8/18+), and double-positive cells (CK5+; CK8/18+) in control and ATM-treated prostate tissue. Spindle orientation was revealed by γ-tubulin (spindle poles) and phospho-histone H3 (dividing cells) immunofluorescence staining. (D) Immunofluorescence of control and ATM-treated prostates, and quantification of the number of single-positive basal (CK5+), luminal (CK8/18+), and double-positive progenitor (CK5+; CK8/18+) (arrows) cells in control and ATM-treated prostates. ∗∗p < 0.01. Representative images and quantifications are from four control and four ATM-treated prostates. n values in (C) represent the total number of cell divisions quantified per cell type. Scale bars, 5 μm (B) and 10 μm (D).
Figure 7
Figure 7
Control of Lineage Specification and Cell-Type Stratification during Prostate Development (A) During normal prostate development, basal (red) cells generate both the basal and luminal lineages using symmetric and asymmetric cell divisions. In addition, double-positive cells (yellow) are generated from basal cells and contribute to the formation of the luminal lineage (green). (B) Upon loss of Gata3 or treatment with ATM, spindle orientation is randomized, leading to an increase in the number of intermediate progenitor cells. Increased intermediate progenitor cells contribute to an expanded luminal layer and prostate epithelial hyperplasia.

Similar articles

Cited by

References

    1. Adachi M., Hamazaki Y., Kobayashi Y., Itoh M., Tsukita S., Furuse M., Tsukita S. Similar and distinct properties of MUPP1 and Patj, two homologous PDZ domain-containing tight-junction proteins. Mol. Cell Biol. 2009;29:2372–2389. - PMC - PubMed
    1. Ahmed S.M., Macara I.G. Mechanisms of polarity protein expression control. Curr. Opin. Cell Biol. 2016;42:38–45. - PMC - PubMed
    1. Asselin-Labat M.L., Sutherland K.D., Barker H., Thomas R., Shackleton M., Forrest N.C., Hartley L., Robb L., Grosveld F.G., van der Wees J. Gata-3 is an essential regulator of mammary-gland morphogenesis and luminal-cell differentiation. Nat. Cell Biol. 2007;9:201–209. - PubMed
    1. Bergstralh D.T., St Johnston D. Spindle orientation: what if it goes wrong? Semin. Cell Dev. Biol. 2014;34:140–145. - PMC - PubMed
    1. Bhatia-Gaur R., Donjacour A.A., Sciavolino P.J., Kim M., Desai N., Young P., Norton C.R., Gridley T., Cardiff R.D., Cunha G.R. Roles for Nkx3.1 in prostate development and cancer. Genes. Dev. 1999;13:966–977. - PMC - PubMed

Publication types

MeSH terms

Grants and funding