. 2017 Jun 1;20(6):801-816.e7.
doi: 10.1016/j.stem.2017.02.007. Epub 2017 Mar 9.

Mex3a Marks a Slowly Dividing Subpopulation of Lgr5+ Intestinal Stem Cells

Affiliations

Mex3a Marks a Slowly Dividing Subpopulation of Lgr5+ Intestinal Stem Cells

Francisco M Barriga et al. Cell Stem Cell. .

Abstract

Highly proliferative Lgr5+ stem cells maintain the intestinal epithelium and are thought to be largely homogeneous. Although quiescent intestinal stem cell (ISC) populations have been described, the identity and features of such a population remain controversial. Here we report unanticipated heterogeneity within the Lgr5+ ISC pool. We found that expression of the RNA-binding protein Mex3a labels a slowly cycling subpopulation of Lgr5+ ISCs that contribute to all intestinal lineages with distinct kinetics. Single-cell transcriptome profiling revealed that Lgr5+ cells adopt two discrete states, one of which is defined by a Mex3a expression program and relatively low levels of proliferation genes. During homeostasis, Mex3a+ cells continually shift into the rapidly dividing, self-renewing ISC pool. Chemotherapy and radiation preferentially target rapidly dividing Lgr5+ cells but spare the Mex3a-high/Lgr5+ population, helping to promote regeneration of the intestinal epithelium following toxic insults. Thus, Mex3a defines a reserve-like ISC population within the Lgr5+ compartment.

Keywords: Lgr5+ ISC heterogeneity; chemotherapy resistance; quiescent stem cell.


Figures

Figure 1
Figure 1. Characterization of the Mex3a reporter allele
(A) Mex3a is enriched in ISC populations. RT qPCR analysis of Mex3a and Lgr5 expression in intestinal populations defined by EPHB2 (left panel) and Lgr5 expression (right panel). Bars depict the mean and upper/lower limits of relative expression obtained from a representative sorting experiment. (B) Mex3a is expressed at the crypt base and is enriched in suprabasal positions of the crypt. (Left panel) Representative smFISH of Mex3a co-stained for E-Cadherin. (Right panel) Quantification of Mex3a transcripts by smFISH along the crypt-villus axis. Data represents the mean ± SEM of 25 crypts. (C) (Left panel) Representation of the Mex3a knock-in allele. A tdTomato/T2A/Cre-ERT2/bGHpolyA cassette was inserted in the translation start site of Mex3a. This construct results in a transcriptional reporter for Mex3a expression driving a tdTomato protein and a tamoxifen inducible Cre recombinase. (Right panel) Immunofluorescence against tdTomato in the small intestine of a Mex3aTom/+ mouse. (D) Representative FACS profile of a small intestine preparation obtained from a Mex3aTom/+ mouse. (E – G) Relative expression of known ISC genes (E), differentiation genes (F), and “+4” marker genes (G) in Mex3a populations. Bars depict the mean and upper/lower limits of relative expression determined by RT qPCR obtained from a representative sorting experiment. (H) Selected GO biological processes enriched in Mex3a and/or Lgr5 signatures. GO category enrichment and statistical analysis was performed using the DAVID Analysis platform.
Figure 2
Figure 2. Mex3a expression identifies intestinal label-retaining cells
(A) Mex3a identifies cells with elevated expression of p21 and p57. Expression of cell cycle inhibitors Cdkn1a (p21/WAF1) and Cdkn1c (p57/KIP2) in Mex3a populations. Bars depict the mean and upper/lower limits of relative expression obtained from a representative sorting experiment. (B) Mex3a is enriched in crypt-base label retaining cells. Lgr5 and Mex3a expression data in label-retaining (YFP+) vs proliferative (YFP-) cells. Bars depict the mean and upper/lower limits from a representative RT qPCR. (C) GSEA analysis of the previously defined LRC gene expression signature (Table S5) in Mex3a-high vs Mex3a-low cells. (D) RT qPCR of LRC genes Rfx6 and Peg3 in the Mex3a populations. Bars depict the mean and upper/lower limits of relative expression obtained from a representative sorting experiment. (E) Experimental protocol. Mex3a/LRC compound reporters were generated and intestinal LRCs were followed by chasing for 10 days after induction. To ensure the analysis of ISC enriched cells, an EphB2 staining was incorporated. Representative FACS plots of LRCs (YFP+) in Mex3a-high and Mex3a-neg cells. (F) Quantification of the distribution of LRCs in Mex3a-high and Mex3a-neg cells. ***, p value < 0.001 in a two-tailed t-test (n = 3 mice). Bars depict the mean ± SEM. (G) Experimental design to follow EdU retention. EdU was injected into Mex3aTom/+ mice and 10 days later Mex3a-high and Mex3a-neg cells were sorted and stained for the presence of EdU by FACS. Representative FACS plots of EdU retention in Mex3a-high (Left panel) and Mex3a-neg cells (Right panel). (H) Quantification of the retention of EdU in Mex3a-high and Mex3a-neg cells. **, p value < 0.01 in a two-tailed t-test (n = 3 mice). Bars depict the mean ± SEM.
Figure 3
Figure 3. Mex3a-driven lineage tracing
(A) Representative image of a Mex3a GFP+ cell (Left panel) and an Lgr5 LacZ+ cell (middle panel) after 36 hours. (Right panel) Frequency of the position of Lgr5 (Lgr5GFP/+) or Mex3a (Mex3aTom/+) labelled cells within the crypt 36 hours after Tamoxifen administration. (B) Clone frequency over time. Clone frequency per 100 crypts was calculated at 3 days (n = 146 clones), 7 days (n = 302 clones), 14 days (n = 331 clones), 21 days (n = 65 clones), 28 days (n = 61 clones) and over 180 days (n = 56 clones). Data was obtained from at least 15 independent sections from at least 3 mice per time. (C) Clone size over time. Clone frequency per 100 crypts was calculated at 3 days (n = 146 clones), 7 days (n = 302 clones), 14 days (n = 331 clones), 21 days (n = 65 clones), 28 days (n = 61 clones) and over 180 days (n = 56 clones). Data was obtained from at least 15 independent sections from at least 3 mice per time. (D) Comparison of clone size distribution at 7 days for Mex3a- (n = 302) and Lgr5- (n = 75) driven lineage tracing. (E) Analysis of lineage-bias within Mex3a-derived clones. 7 day clones were stained for absorptive and secretory lineage markers to assess their differentiation pattern. (Left panel) 1 and 2 cells clones are largely absorptive, but also secretory cells are found. Single cells remaining at crypts were negative for lineage markers. (Right panel) Clones of over 3 cells are largely undifferentiated after 7 days, yet both lineages are still observed within larger clones. (F) Mex3a-derived cells rarely incorporate BrdU. 3 day clones (n = 33 clones) were stained for BrdU incorporation. (G) Characterization of single cell clones after 7 days of tracing. Representative images of single cells stained for GFP+/Dclk1+ cell (left panel) and GFP+/Chga+ (right panel). Arrowheads point to positive cells. (H) Characterization of large clones after 7 days of tracing. A clone of GFP+/UEA-Lectin+ Paneth cells within a crypt (left panel). Representative image of GFP+/Muc2+ (middle panel) and GFP+/Anpep+ (right panel). White arrowheads point towards positive cells for the lineage marker. Red arrows point to GFP+ cells negative for the stained marker, thus showing that clones are composed by more than a single lineage.
Figure 4
Figure 4. Mex3a cells are a subpopulation of Lgr5+ cells
(A) Representative FACS plot of Lgr5+ cells obtained from compound Mex3a-Tom/+; Lgr5-GFP/+ reporters. Population frequencies are referred to total number of Lgr5::GFP+ cells in the small intestine of compound Lgr5-GFP/+; Mex3a-Tom/+ mice. (B – D) Characterization of the Lgr5 subpopulations in (A) by RT qPCR analysis of known intestinal cell markers. Relative expression of ISC/Wnt genes (B), high-abundance lineage genes (C), and low-abundance lineage genes (D). Values are normalized to the subpopulation with the highest expression of each gene. Data represent the mean of 4 independent sorting experiments. (Full expression data is presented in Table S4). (E) Representative images of 3D cultures containing organoids derived from the Mex3a/Lgr5 subpopulations. Insets show the presence of organoids with high complexity. (F) Quantification of organoid forming efficiency from Mex3a/Lgr5 subpopulations. Graphs represent the mean ± SEM of organoid efficiency per population obtained from 3 independent sorting experiments (n = 6 cultures per population). *, p val < 0.05; ***, p val < 0.001, in a one-way ANOVA followed by Tukey´s multiple comparison test. (G) Organoids derived from Mex3a-high Lgr5-high cells were expanded over 30 days to stain for the different intestinal lineages. Organoids showed the presence of stem/progenitor cells (EPHB2), enterocytes (ANPEP+), enteroendocrine cells (CHGA+), Paneth cells (LYZ1+), tuft cells (Dclk1) and goblet cells (MUC2).
Figure 5
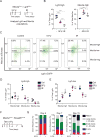
Figure 5. Mex3a-expressing cells are resistant to chemo and radiotherapy
(A) Experimental setup to assess the reponse of Mex3a/Lgr5 subpopulations to stress. Mice were treated twice with either 5-FU (2X 100 mg/kg) or IR (12 Gy) and 48h later small intestines were collected and analyzed by FACS. (B) Frequency of Lgr5-high cells (left panel) or Mex3a-high cells (right panel) in control and after treatment with 5-FU or IR. Graphs depict the mean ± SD compared to total Lgr5-GFP cells. *, p value < 0.05; ***, p value < 0.001 in a one-way ANOVA followed by Tukey´s multiple comparison test (n ≥ 4 per group). (C) Representative FACS plots of GFP+ cells from untreated (left panel), 5-FU treated (middle panel), and IR-treated (right panel) Lgr5-GFP/+; Mex3a-Tom/+ compound mice. (D) Quantification of Mex3a populations within Lgr5-high cells in control, 5-FU, and IR treated mice. ***, p value < 0.001 in a two-way ANOVA followed by Sidak´s multiple comparison test relative to untreated mice (n ≥ 4 per group). (E) Quantification of Mex3a populations within Lgr5-low cells in control, 5-FU, and IR treated mice. ***, p value < 0.001 in a two-way ANOVA followed by Sidak´s multiple comparison test relative to untreated mice (n ≥ 4 per group). (F – G) Mex3a cells increase their cellular output after 5-FU insult. (F) Experimental setup. Tracing was induced with Tamoxifen and followed by two doses of 5-FU. Clones were assessed in control and 5-FU treated mice at 7 and 14 days from the initial tamoxifen treatment. (G) Clone-size distribution at 7 (n = 302 clones for control, n = 170 for 5-FU) and 14 days (n = 331 clones for control, n = 113 clones for 5FU) in control and 5-FU treated mice. All tracing data was obtained from at least 4 mice.
Figure 6
Figure 6. Single cell transcriptomic profiling of Lgr5-high cells identifies a subpopulation enriched in the Mex3a signature
(A) (Left panel) FACS plot used to select for Lgr5-high cells. (Right panel) Experimental setup (See Supplementary Methods for details). (B) (Left panel) Mean expression of the Lgr5 signature on the tSNE map derived from PCA defined clusters. (Right panel) Box-plot showing the mean ± SD of Lgr5 signature expression in both clusters. n.s, p value > 0.05 in Kruskal-Wallis test. (C) (Left panel) Mean expression of the Ki67 signature on the tSNE map derived PCA defined clusters. (Right panel) Box-plot showing the mean ± SD of Ki67 signature expression in both clusters. ***, p value < 0.05 in Kruskal-Wallis test. (D) (Left panel) Mean expression of the Mex3a signature on the tSNE map derived PCA defined clusters. (Right panel) Box-plot showing the mean ± SD of Mex3a signature expression in both clusters. ***, p value < 0.05 in Kruskal-Wallis test. (E–I) Expression of ISC genes (E), “+4” genes (F), high abundance lineage genes (G), low abundance lineage genes (H), and proliferation genes (I) in Lgr5-high subpopulations. Violin plots show the density and mean expression of each gene. (J) Correlation between the Mex3a and Lgr5 signatures (left panel), Ki67 and Lgr5 signatures (middle panel), and Mex3a and Ki67 signatures (right panel) in the 245 Lgr5 single cells analyzed by RNA Seq.
Figure 7
Figure 7

Similar articles

Cited by

References

    1. Barker N, Bartfeld S, Clevers H. Tissue-resident adult stem cell populations of rapidly self-renewing organs. Cell stem cell. 2010;7:656–670. - PubMed
    1. Barker N, van Es JH, Kuipers J, Kujala P, van den Born M, Cozijnsen M, Haegebarth A, Korving J, Begthel H, Peters PJ, et al. Identification of stem cells in small intestine and colon by marker gene Lgr5. Nature. 2007;449:1003–1007. - PubMed
    1. Batlle E, Henderson JT, Beghtel H, Van den Born M, Sancho E, Huls G, Meeldijk J, Robertson J, Van de Wetering M, Pawson T, et al. B-Catenin and TCF Mediate Cell Positioning in the Intestinal Epithelium by Controlling the Expression of EphB/EphrinB. Cell. 2002;111:251–263. - PubMed
    1. Buczacki SJA, Zecchini HI, Nicholson AM, Russell R, Vermeulen L, Kemp R, Winton DJ. Intestinal label-retaining cells are secretory precursors expressing Lgr5. Nature. 2013;495:65–69. - PubMed
    1. Buchet-Poyau K, Courchet J, Le Hir H, Seraphin B, Scoazec JY, Duret L, Domon-Dell C, Freund JN, Billaud M. Identification and characterization of human Mex-3 proteins, a novel family of evolutionarily conserved RNA-binding proteins differentially localized to processing bodies. Nucleic acids research. 2007;35:1289–1300. - PMC - PubMed

Publication types

MeSH terms