. 2017 May 4;20(5):621-634.e6.
doi: 10.1016/j.stem.2017.02.003. Epub 2017 Mar 9.

Targeting BMI1+ Cancer Stem Cells Overcomes Chemoresistance and Inhibits Metastases in Squamous Cell Carcinoma

Affiliations

Targeting BMI1+ Cancer Stem Cells Overcomes Chemoresistance and Inhibits Metastases in Squamous Cell Carcinoma

Demeng Chen et al. Cell Stem Cell. .

Abstract

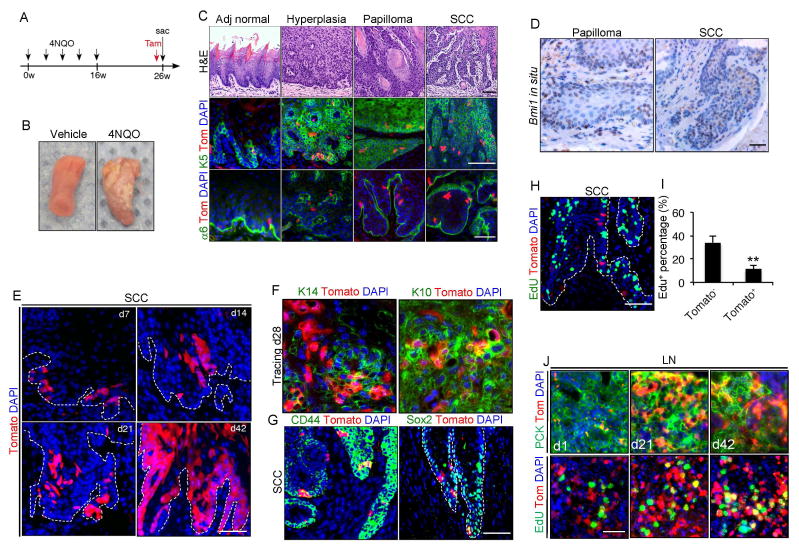
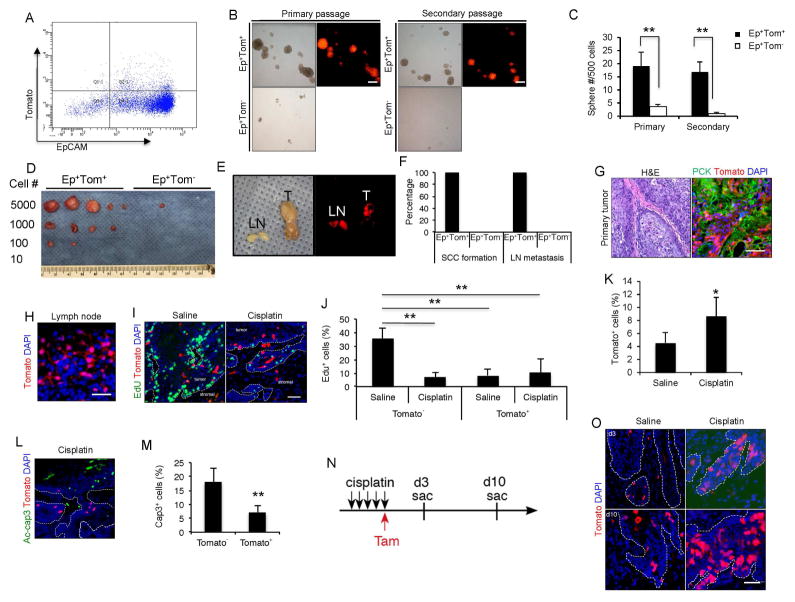
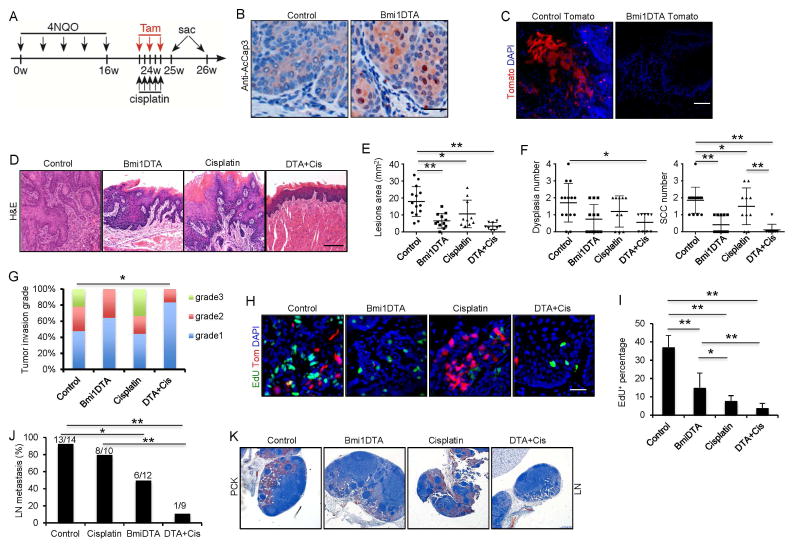
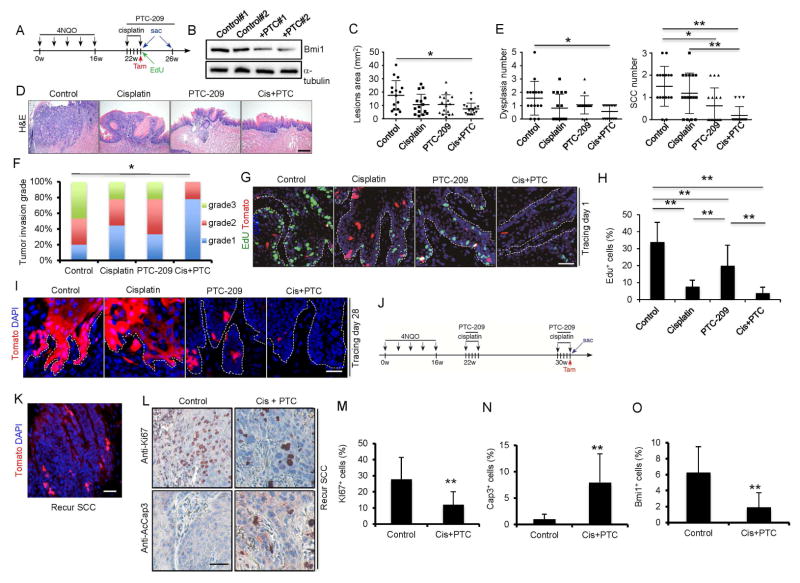
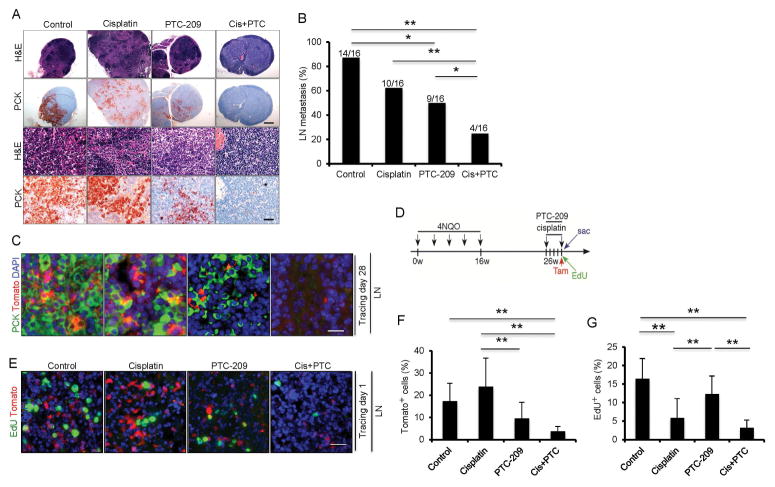
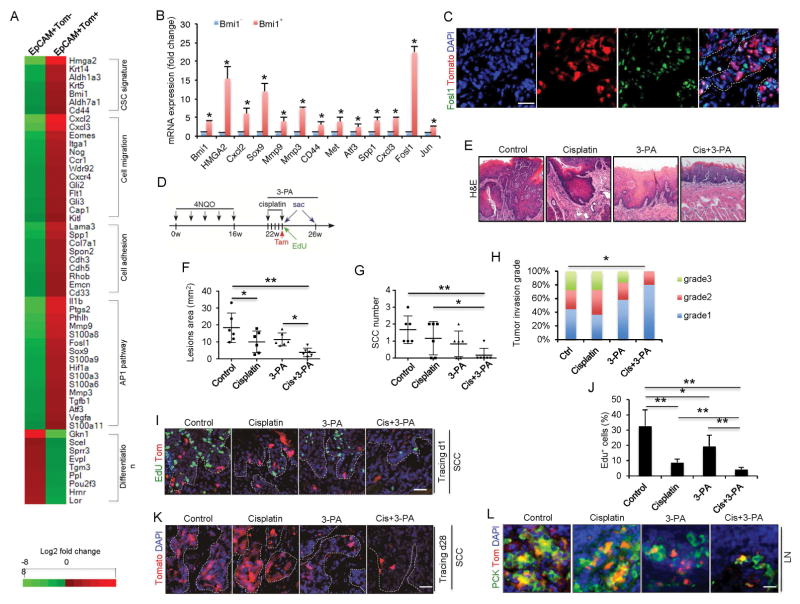
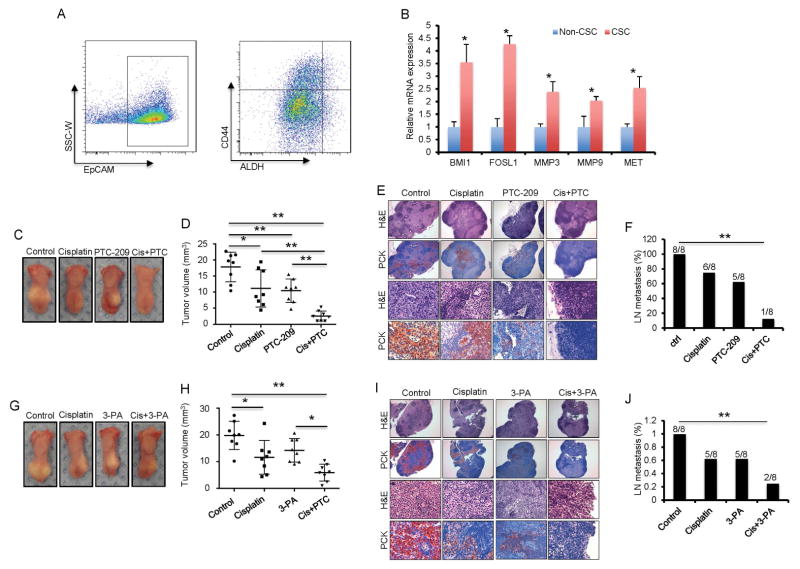
Squamous cell carcinoma in the head and neck (HNSCC) is a common yet poorly understood cancer, with adverse clinical outcomes due to treatment resistance, recurrence, and metastasis. Putative cancer stem cells (CSCs) have been identified in HNSCC, and BMI1 expression has been linked to these phenotypes, but optimal treatment strategies to overcome chemotherapeutic resistance and eliminate metastases have not yet been identified. Here we show through lineage tracing and genetic ablation that BMI1+ CSCs mediate invasive growth and cervical lymph node metastasis in a mouse model of HNSCC. This model and primary human HNSCC samples contain highly tumorigenic, invasive, and cisplatin-resistant BMI1+ CSCs, which exhibit increased AP-1 activity that drives invasive growth and metastasis of HNSCC. Inhibiting AP-1 or BMI1 sensitized tumors to cisplatin-based chemotherapy, and it eliminated lymph node metastases by targeting CSCs and the tumor bulk, suggesting potential regimens to overcome resistance to treatments and eradicate HNSCC metastasis.

Keywords: AP-1; Bmi1; cancer stem cells; chemotherapy; cisplatin resistance; head and neck squamous cell carcinoma; metastasis.


Figures

Figure 1
Figure 1. Bmi1 is expressed in a subset of cancer cells in HNSCC in vivo
(A) Experimental design for tracing Bmi1+ cells in mouse HNSCC induced by 4NQO. (B) Representative image of tongue lesions 26 weeks after 4NQO treatment. Representative of at least three independent experiments. (C) Representative H&E staining of adjacent normal tongue tissue (Adj normal), hyperplasia, papilloma and SCC. Tamoxifen was injected into 4NQO-treated BmiCreER;Rosa26tdTomato mice. 24 hours after tamoxifen treatment, tongues were harvested and analyzed by immunostaining. The majority of Bmi1+ cells (red) resided within basal layer of SCC were stained by cytokeratin 5 (K5; green). Integrin α6 (α6; green) denotes the boundary of tumor epithelia and stroma. Scale bars, 50 μm. (D) Expression pattern of Bmi1 mRNA in both papilloma and SCC was detected by in situ hybridization. Scale bars, 50 μm. (E) Representative images of Bmi1+ cell-driven lineage tracing in primary HNSCC in vivo. Nuclei were stained with DAPI (blue). White dashed lines demarks tumor-stromal junction. (F) Immunostaining of Keratin14 (K14; green, left) or Keratin10 (K10; green, right) in mouse HNSCC. Scale bars, 50 μm. (G) Immunostaining of CD44 (green, left) or Sox2 (green, right) in mouse HNSCC. Scale bars, 50 μm. (H) A representative image of primary tumor cells labeled with EdU (green). Scale bars, 50 μm. (I) Quantification of EdU incorporation in Bmi1+ and Bmi1 tumor cells. Values are mean ± SD. from one of three independent experiments at least. **p < 0.01 by unpaired two-tailed Student’s t-test; n = 3 animals. (J) Representative images of Bmi1+ cell-driven lineage tracing and proliferation in cervical lymph nodes in vivo. Metastatic tumor cells (green) in cervical lymph nodes were stained with anti-pan-cytokeratin (PCK) or EdU. Nuclei were stained with DAPI (blue). Scale bars, 50 μm.
Figure 2
Figure 2. Bmi1+ cells are highly tumorigenic, metastatic and chemo-resistant
(A) Representative FACS plots of EpCAM+/Tomato+ tumor cells isolated from mouse primary HNSCC 24hr after tamoxifen injection. (B) Sphere formation assays for EpCAM+/Tomato+ and EpCAM+/Tomato tumor cells isolated from HNSCC. Scale bars, 250 μm. (C) Quantification of primary and secondary spheres from EpCAM+/Tomato+ and EpCAM+/Tomato tumor cells. Values are mean ± SD. from one of three independent experiments. **p < 0.01 by unpaired two-tailed Student’s t-test; n = 12. (D) In vivo limiting dilution analysis of HNSCC formation frequency of primary EpCAM+/Tomato+ and EpCAM+/Tomato tumor cells. The frequency of allograft formation at each cell dose injected was shown. (E and F) Tumors were detected in the tongue of mice inoculated with EpCAM+/Tomato+ cells, but not EpCAM+/Tomato. (G) Visualization of Tomato+ tumor cells in primary HNSCC and cervical lymph node metastasis with a brightfield or fluorescence microscope. (H) Histological analysis of Tomato+ cells in cervical lymph nodes. Scale bars, 50 μm. (I) Representative images of EdU incorporation (green) and Bmi1+ CSCs (red) in HNSCC from mice treated with saline or cisplatin. Scale bar, 50 μm. (J) Quantifications of EdU percentage in Tomato+ or Tomatotumor cells after treatment. Values are mean ± SD. from one of three independent experiments. ** p < 0.01 by two-way ANOVA; n = 6 animals. (K) Quantification of the percentage of Tomato+ cells in HNSCC after saline or cisplatin treatment. Values are mean ± SD. *p < 0.05 by Student’s t-test; n = 6. (L) Representative images of active-caspase3-positive cells (green) and Bmi1+ cells (red) in primary HNSCC from mice treated with cisplatin. Scale bar, 50 μm. (M) Bmi1 tumor cells displayed significantly higher apoptosis than Bmi1+ tumor cells. Nuclei were stained with DAPI (blue). Values are mean ± SD. **p < 0.01 by Student’s t test; n = 6. (N) Experimental design for Bmi1 lineage tracing of HNSCC recurrence. (O) Representative images of Bmi1+ cell-driven lineage tracing in relapsed HNSCC in vivo after cisplatin treatment. White dashed lines demarks tumor-stromal junction. Scale bar, 50 μm.
Figure 3
Figure 3. Ablation of Bmi1+ cells in combination with chemotherapy inhibits primary HNSCC growth and lymph node metastasis
(A) Experimental design for lineage ablation of Bmi1+ cells in HNSCC in vivo. Three administrations of tamoxifen were given to BmiCreER;Rosa26DTA (DTA) or control mice to achieve maximal frequency of Cre-LoxP-mediated cell ablation. (B) Representative staining for active-caspase3 cells. Scale bar, 50 μm. (C) Lineage tracing confirmed the depletion of Bmi1+ cells. Scale bar, 50 μm. (D) Representative H&E staining of HNSCC after treatment. Scale bar, 50 μm. (E) Quantification of lesion areas visible in the tongue from different treatment groups. Values are mean ± SD. from the pool of two independent experiments (n = 9 to 14). *p < 0.05, **p < 0.01; two-way ANOVA. (F) Quantification of dysplasia and SCC numbers in the control and DTA groups. Values are mean ± SD. from the pool of two independent experiments (n = 9 to 14). *p<0.05, ** p<0.01; two-way ANOVA. (G) Quantification of HNSCC invasion grades in different treatment groups. *p < 0.05; Cochran-Armitage test (n = 9 to 14). (H) Representative images of EdU incorporation (green) and Bmi1+ CSCs (red) in HNSCC from mice treated with different conditions. Scale bar, 50 μm. (I) Quantifications of EdU percentage in tumor cells after treatments. Values are mean ± SD. from the pool of two independent experiments (n = 9 to 14). *p < 0.05, ** p < 0.01; two-way ANOVA. (J) The percentage of mice having lymph node metastasis after treatment. *p < 0.05, ** p<0.01; Fisher exact test. Number of mice used in each groups were indicated in the figure; (K) Immunostaining of metastatic cells in cervical lymph nodes using anti-pan-cytokeratin (PCK). Scale bar, 250 μm.
Figure 4
Figure 4. The combination therapy of cisplatin plus PTC-209 potently eradicates Bmi1+ CSCs and inhibits tumor progression by lineage tracing
(A) Schematic diagrams show the experimental strategies for the combination therapy and lineage tracing of primary HNSCC in BmiCreER;RosatdTomato mice. Mice were randomly divided into 4 experimental groups: control vehicle; PTC-209; cisplatin; and cisplatin plus PTC-209. 100 mg EdU were injected into mice 2hr before sacrifice. (B) Western blots showed that Bmi1 was reduced in tumors treated with PTC-209. (C) Quantification of lesion areas from different treatment groups. Values are mean ± SD. from the pool of two independent experiments (n = 16). *p<0.05, **p<0.01 by one-way ANOVA (D) Representative H&E staining of HNSCC in different treatment groups. Cis+PTC, cisplatin plus PTC-209. (E) Quantification of dysplasia and SCC numbers in different treatment groups. Values are mean ± SD. from the pool of two independent experiments (n = 16). *p<0.05, ** p<0.01 by one-way ANOVA (F) Quantification of HNSCC invasion grades in different treatment groups. *p < 0.05; Cochran-Armitage test; n = 16. (G) Representative immunofluorescence images of primary tumor cells labelled with EdU (green) and Bmi1+ cell (red) 5 days after different treatments. Cis+PTC, cisplatin plus PTC-209. Nuclei were stained with DAPI (blue). White dashed lines demarks tumor-stromal junction. Scale bar, 50μm. Cis+PTC, cisplatin plus PTC-209. (H) Percentage of EdU+ cells in all tumor cells after different treatment. Values are mean ± SD. from the pool of two independent experiments (n = 16). *p<0.05; ** p<0.01; one-way ANOVA. (I) Representative images of lineage tracing in HNSCC after different treatments. Nuclei are stained with DAPI (blue). Scale bar, 50μm. White dashed lines demarks tumor-stromal junction. (J) Experimental design for examining the tumor cells in recurrent HNSCC after cisplatin and PTC-209 treatment. Briefly, mice after first round of cisplatin and PTC-209 treatment were maintained for 8 additional weeks. Mice with recurred HNSCC lesion received second round of cisplatin and PTC-209 treatment and harvested in 1 day. (K) Lineage tracing showed presence of Bmi1+ CSCs in recurrent tumors after cisplatin and PTC-209 treatment. (L) Immunostaining of Ki67 and active-caspase3 in recurrent HNSCC after cisplatin plus PTC-209 treatment. (M) Reduction of Ki67+ cells in recurrent HNSCC after cisplatin plus PTC-209 treatment. Values are mean ± SD. **p < 0.01; Student’s t-test; n = 3–4. (N) Cisplatin plus PTC-209 treatment activated caspase-3 in recurrent HNSCC. Values are mean ± SD. **p < 0.01; Student’s t-test; n = 3–4. (O) Cisplatin plus PTC-209 treatment eliminated Bmi1+ CSCs in recurrent HNSCC. Values are mean ± SD. **p < 0.01; Student’s t-test; n = 3–4. See also Figure S1.
Figure 5
Figure 5. The combination therapy of cisplatin and PTC-209 potently eliminates Bmi1+ CSCs and prevents HNSCC lymph node metastasis by lineage tracing
(A) Representative staining of metastatic tumor cells in cervical lymph nodes from different treatment groups using anti-pan-cytokeratin (PCK). Scale bar upper, 250 μm; Scale bar lower, 50 μm. (B) The percentage of mice having with lymph node metastasis after treatments. Values are from the pool of two independent experiments (n = 16). *p < 0.05; **p < 0.01; n=16; Fisher exact test. Scale bar, 50 μm. Cis+PTC, cisplatin plus PTC-209. (C) Representative images of Tomato+ tumor cells (red) and PCK (green) staining in lymph nodes after different treatments. Nuclei were stained with DAPI (blue). Scale bar, 50μm. (D) Experimental design for examining the metastatic tumor cells in cervical lymph nodes. (E) Representative images of Tomato+ tumor cells (red) and EdU-labeled tumor cells (green) in cervical lymph nodes. Scale bars, 50 μm. (F) The percentage of Tomato+ cells in metastatic tumor cells of lymph nodes. Values are mean ± SD. *p < 0.05; **p < 0.01; one-way ANOVA; n = 6. (G) The percentage of EdU+ cells in metastatic tumor cells of lymph nodes. Values are mean ± SD. *p < 0.05; **p < 0.01; one-way ANOVA; n = 6.
Figure 6
Figure 6. Abnormal activation of AP-1 in Bmi1+ CSCs facilitates HNSCC invasive growth and chemoresistance
(A) Heatmap displayed genes that were differentially expressed between EpCAM+Tomato and EpCAM+Tomato+ tumor cells isolated from primary mouse HNSCC. (B) qRT-PCR showed that the expression of AP-1 target genes was significantly higher in EpCAM+Tomato+ cells than in EpCAM+Tomato cells. Data represent mean ± SD. **p < 0.05. (C) Co-immunostaining for FOSL1 (green) and Tomato (red) in primary HNSCC of BmiCreER;RosatdTomato mice after 1 day of tamoxifen administration. Nuclei were stained with DAPI (blue). White dashed lines demarks tumor-stromal junction. (D) Schematic diagrams show the experimental strategy for the combination therapy of cisplatin and 3-PA. Mice were randomly divided into 4 experimental groups: control vehicle; 3-PA; cisplatin; and cisplatin plus 3-PA. (E) Representative H&E staining of HNSCC after 4 different treatments. (F) Quantification of lesion areas from different treatment groups. Values are mean ± SD. **p < 0.01; one-way ANOVA; n = 6. (G) Quantification of SCC numbers in 4 different treatment groups. Values are mean ± SD. **p < 0.01; one-way ANOVA; n = 6. (H) Quantification of HNSCC invasion grades in different treatment groups. *p < 0,05; Cochran-Armitage test. (I) Representative images of primary tumor cells labelled with EdU (green) and Bmi1+ cell (red) 1 day after different treatments. (J) Quantifications the percentage of EdU+ cells in tumors 5 days after different treatments. Values are mean ± SD. *p < 0,05, **p < 0.01; one-way ANOVA; n = 6. (K) Representative images of lineage tracing in tumors 28 days after treatments. Nuclei are stained with DAPI (blue). Scale bar, 50 μm. (L) Representative staining of metastatic tumor cells in cervical lymph nodes from different treatment groups using anti-pan-cytokeratin. See also Figure S2 and Table S1.
Figure 7
Figure 7. Targeting BMI1 or AP-1 impairs tumorigenic and metastatic properties of CSCs in human primary HNSCC
(A) FACS sorting showed the proportion of ALDHhighCD44+EpCAM+ cells in primary human HNSCC. (B) qRT-PCR showed that AP1 target genes were significantly up-regulated in human CSCs. Values mean ± SD from one of three independent experiments. *p < 0.05; Student’s t test; n = 3. (C) Representative image of xenografted human HNSCC tumors from CSCs in nude mice after treatment. (D) Quantification of human HNSCC tumor growth in nude mice after treatment. Values are mean ± SD from one of two independent experiments. *p < 0.05; **p < 0.01; one-way ANOVA; n = 8. (E) Representative staining of metastatic tumor cells in cervical lymph nodes of mice after treatment using anti-pan-cytokeratin (PCK). Scale bar upper, 250 μm. Scale bar lower, 50 μm. (F) The percentage of mice having lymph node metastasis after treatment. Data are from one of two independent experiments. **p < 0.01; Fisher exact test; n = 8. (G) Representative image of xenografted human HNSCC tumors derived from CSCs in nude mice after treatment. (H) Quantification of human HNSCC tumor growth in nude mice after treatment. Values are mean ± SD from one of two independent experiments. *p < 0.05; **p < 0.01; one-way ANOVA; n = 8. (I) Representative staining of metastatic tumor cells in cervical lymph nodes of nude mice after treatment using anti-pan-cytokeratin (PCK). Scale bar upper, 250 μm. Scale bar lower, 50 μm. (J) The percentage of mice having lymph node metastasis after treatment. Data are from one of two independent experiments. **p < 0.05; Fisher exact test; n = 8. See also Figure S3 to S6 and Table S2.

Comment in

References

    1. Al-Hajj M, Wicha MS, Benito-Hernandez A, Morrison SJ, Clarke MF. Prospective identification of tumorigenic breast cancer cells. Proc Natl Acad Sci U S A. 2003;100:3983–3988. - PMC - PubMed
    1. Belguise K, Kersual N, Galtier F, Chalbos D. FRA-1 expression level regulates proliferation and invasiveness of breast cancer cells. Oncogene. 2005;24:1434–1444. - PubMed
    1. Boumahdi S, Driessens G, Lapouge G, Rorive S, Nassar D, Le Mercier M, Delatte B, Caauwe A, Lenglez S, Nkusi E, et al. SOX2 controls tumour initiation and cancer stem-cell functions in squamous-cell carcinoma. Nature. 2014;511:246–250. - PubMed
    1. Brooks MD, Burness ML, Wicha MS. Therapeutic Implications of Cellular Heterogeneity and Plasticity in Breast Cancer. Cell Stem Cell. 2015;17:260–271. - PMC - PubMed
    1. Chakrabarti R, Wei Y, Hwang J, Hang X, Andres Blanco M, Choudhury A, Tiede B, Romano RA, DeCoste C, Mercatali L, et al. DeltaNp63 promotes stem cell activity in mammary gland development and basal-like breast cancer by enhancing Fzd7 expression and Wnt signalling. Nat Cell Biol. 2014;16:1004–1015. 1001–1013. - PMC - PubMed

Publication types

MeSH terms