. 2017 Jan;31(1):24-38.
doi: 10.1002/2016GB005445. Epub 2017 Jan 12.

Fire and deforestation dynamics in Amazonia (1973-2014)

Affiliations

Fire and deforestation dynamics in Amazonia (1973-2014)

Margreet J E van Marle et al. Global Biogeochem Cycles. 2017 Jan.

Abstract

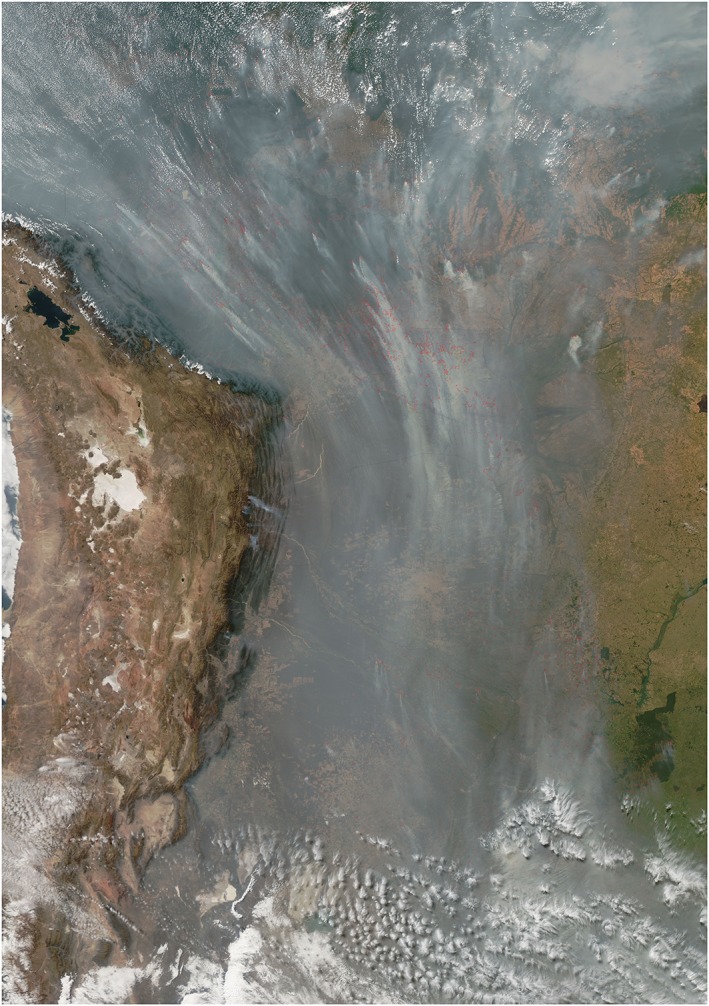
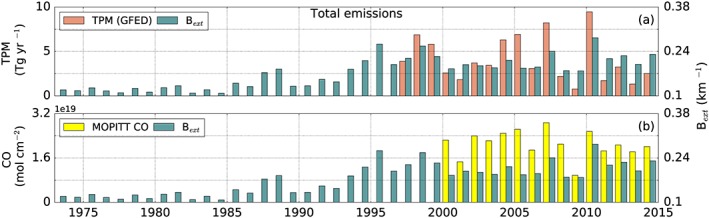
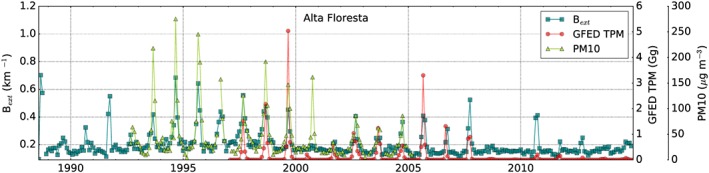
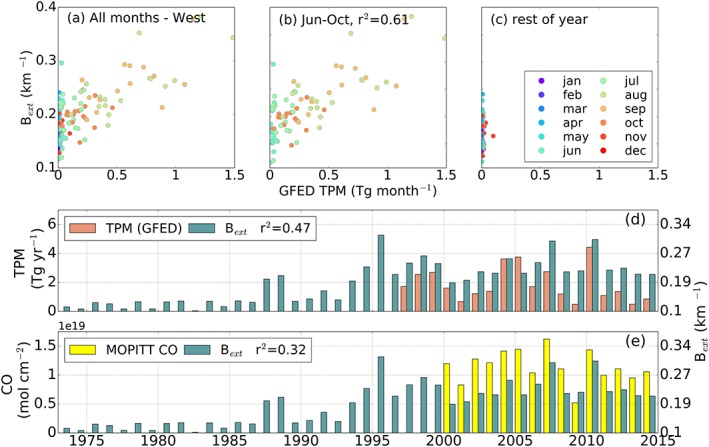
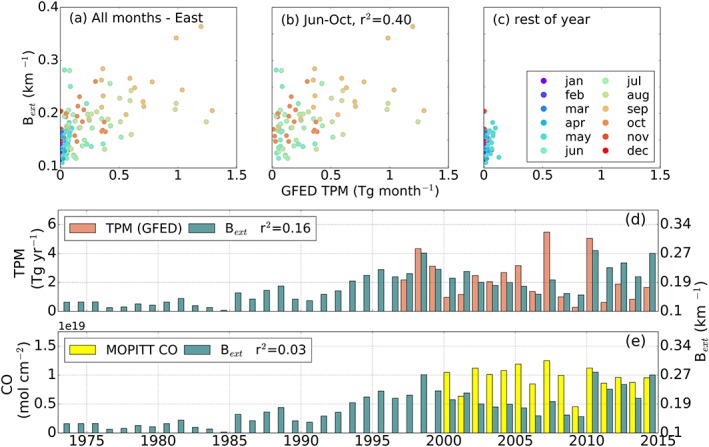
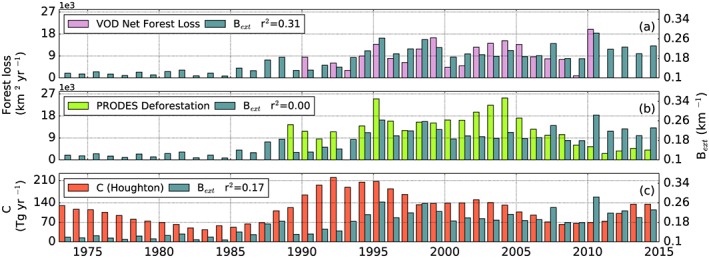
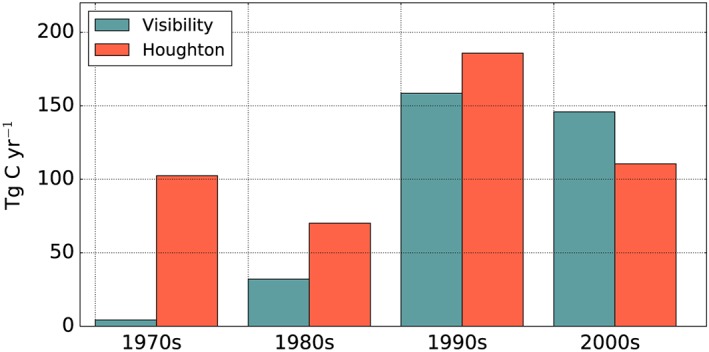
Consistent long-term estimates of fire emissions are important to understand the changing role of fire in the global carbon cycle and to assess the relative importance of humans and climate in shaping fire regimes. However, there is limited information on fire emissions from before the satellite era. We show that in the Amazon region, including the Arc of Deforestation and Bolivia, visibility observations derived from weather stations could explain 61% of the variability in satellite-based estimates of bottom-up fire emissions since 1997 and 42% of the variability in satellite-based estimates of total column carbon monoxide concentrations since 2001. This enabled us to reconstruct the fire history of this region since 1973 when visibility information became available. Our estimates indicate that until 1987 relatively few fires occurred in this region and that fire emissions increased rapidly over the 1990s. We found that this pattern agreed reasonably well with forest loss data sets, indicating that although natural fires may occur here, deforestation and degradation were the main cause of fires. Compared to fire emissions estimates based on Food and Agricultural Organization's Global Forest and Resources Assessment data, our estimates were substantially lower up to the 1990s, after which they were more in line. These visibility-based fire emissions data set can help constrain dynamic global vegetation models and atmospheric models with a better representation of the complex fire regime in this region.

Keywords: Amazonia; South America; deforestation; historic fire emissions; horizontal visibility; proxy data.


Figures

Figure 1
Figure 1
Smoke from fires in Bolivia and Brazil (states of Rondônia and Mato Grosso) observed by MODIS during the 2010 fire season. Highest concentrations are seen east of the Andes where smoke from fires farther north and east is funneled southward. The region covered by this image is outlined in Figure 2. NASA image courtesy: Jeff Schmaltz.
Figure 2
Figure 2
Locations of WMO stations used in our analysis indicated by the stars. The purple star denotes Alta Floresta (AF), for which surface particulate matter measurements were available (Figure 4). The color shading shows the average annual GFED4s TPM emissions per 0.25° × 0.25° grid cell over 1997–2014. The gray box shows the region covered by Figure 1.
Figure 3
Figure 3
Temporal coverage of the selected WMO stations before filtering the data. The stations located in the western box of Figure 2 are in red, those in the eastern box in black.
Figure 4
Figure 4
Averaged B ext values for the whole study region [7°S–17°S, 48°W–68°W], compared with (a) GFED‐based TPM emissions (1997–2014) and (b) MOPITT CO concentrations (2000–2014) for the same region.
Figure 5
Figure 5
Monthly averaged B ext and ground‐based measurements of PM10, both observed at Alta Floresta, and averaged GFED TPM emissions for the 36 0.25° × 0.25° grid cells centered over Alta Floresta.
Figure 6
Figure 6
Relations between monthly B ext observations and GFED TPM emissions for the overlapping time period 1997–2014, and annual B ext, TPM and CO time series in the western box (red square in Figure 2). Figure 6a shows all months, Figure 6b the data points for the months of the fire season from June to October, and Figure 6c the remaining months. Dark green indicates the visibility‐based annual B ext emissions (1974–2014), which are compared with (d) GFED‐based TPM emissions (1997–2014) and (e) MOPITT CO concentrations (2000–2014) for the same region.
Figure 7
Figure 7
Relations between monthly B ext observations and GFED TPM emissions for the overlapping time period 1997–2014, and annual B ext, TPM and CO time series in the eastern box (black square in Figure 2). Figure 7a shows all months, Figure 7b the data points for the months of the fire season from June to October, and Figure 7c the remaining months. Dark green indicates the visibility‐based TPM emissions (1974–2014), which are compared with (d) annual GFED TPM emissions (1997–2014) and (e) MOPITT CO concentrations (2000–2014) for the same region.
Figure 8
Figure 8
Annual estimates of fire emissions and forest loss for the whole study region (Figure 2). In all plots dark green indicates the annual averaged visibility‐based B ext (1974–2014), which are compared with (a) VOD‐based net forest loss (1990–2010), (b) summed PRODES deforestation for the provinces of Acre, Mato Grosso, Rondônia, Pará, and Tocantins (1989–2014, and (c) averaged FAO emissions attributed to deforestation fires for Brazil and Bolivia.
Figure 9
Figure 9
Visibility‐based carbon emissions for the whole study region and carbon emissions related to deforestation fires for Brazil and Bolivia based on FAO‐deforestation data and an updated version of Houghton [2003] for 10 year periods. The 1970s decade covers the time period from 1973 to 1980.

References

    1. Akagi, S. K. , Yokelson R. J., Wiedinmyer C., Alvarado M. J., Reid J. S., Karl T., Crounse J. D., and Wennberg P. O. (2011), Emission factors for open and domestic biomass burning for use in atmospheric models, Atmos. Chem. Phys., 11(9), 4039–4072, doi:10.5194/acp-11-4039-2011. - DOI
    1. Aragão, L. E. O. C. , Poulter B., Barlow J. B., Anderson L. O., Malhi Y., Saatchi S., Phillips O. L., and Gloor E. (2014), Environmental change and the carbon balance of Amazonian forests, Biol. Rev., 89(4), 913–931, doi:10.1111/brv.12088. - DOI - PubMed
    1. Artaxo, P. , Gerab F., Yamasoe M. A., and Martins J. V. (1994), Fine mode aerosol composition at three long‐term atmospheric monitoring sites in the Amazon Basin, J. Geophys. Res., 99(D11), 22,857–22,868, doi:10.1029/94JD01023. - DOI
    1. Bevan, S. L. , North P. R. J., Grey W. M. F., Los S. O., and Plummer S. E. (2009), Impact of atmospheric aerosol from biomass burning on Amazon dry‐season drought, J. Geophys. Res., 114, D09204, doi:10.1029/2008JD011112. - DOI
    1. Chang, D. , Song Y., and Liu B. (2009), Visibility trends in six megacities in China 1973–2007, Atmos. Res., 94(2), 161–167, doi:10.1016/j.atmosres.2009.05.006. - DOI

LinkOut - more resources