. 2017 Feb 11;7(3):405-413.
doi: 10.1002/2211-5463.12190. eCollection 2017 Mar.

Overexpression of heparanase attenuated TGF-β-stimulated signaling in tumor cells

Affiliations

Overexpression of heparanase attenuated TGF-β-stimulated signaling in tumor cells

Tahira Batool et al. FEBS Open Bio. .

Abstract

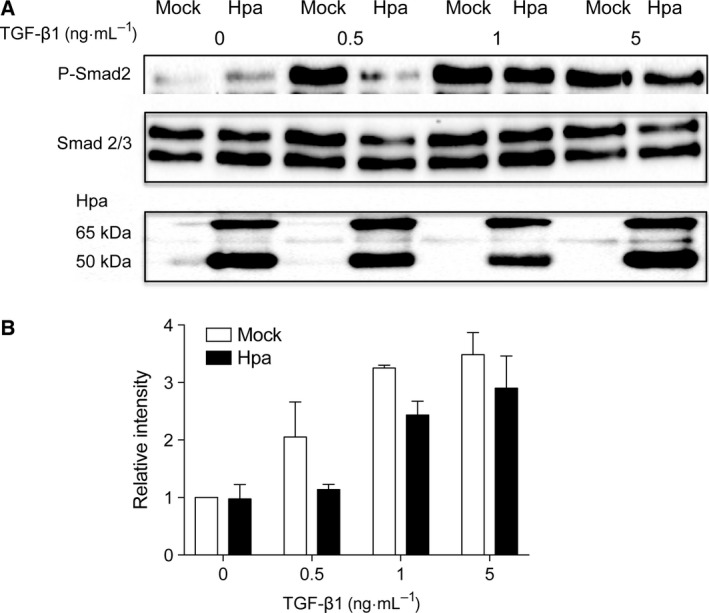
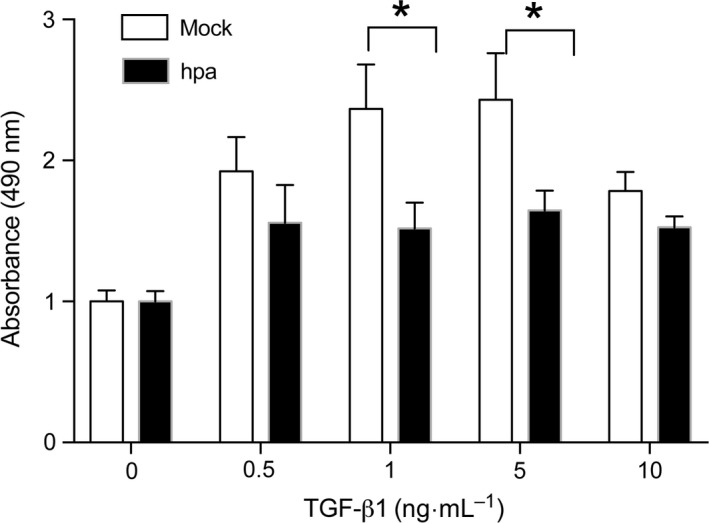
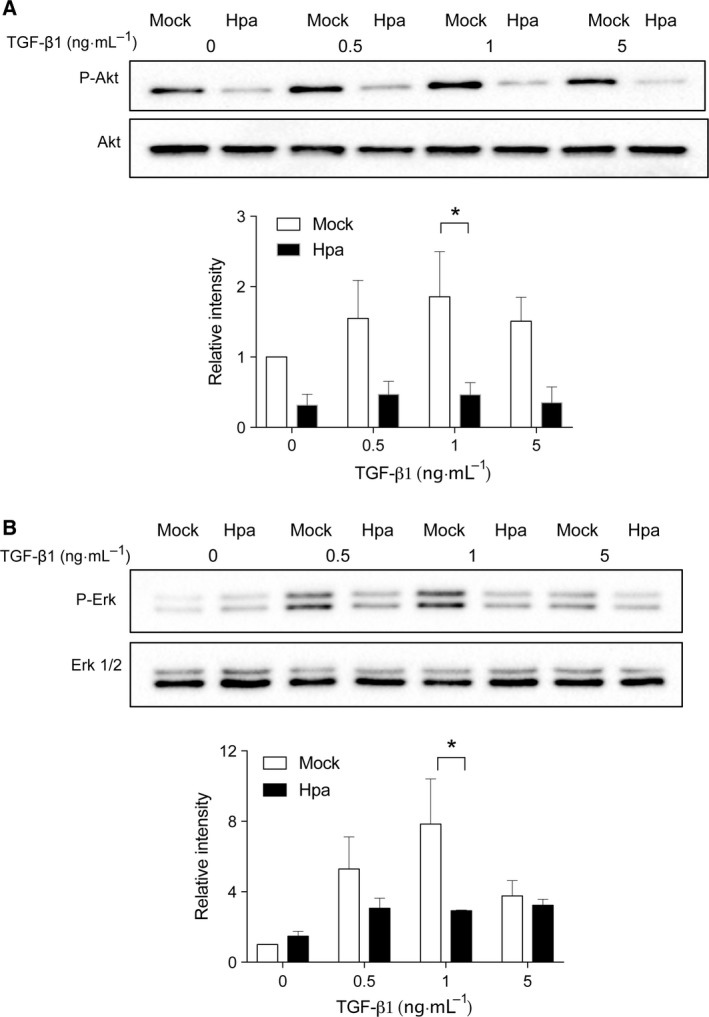
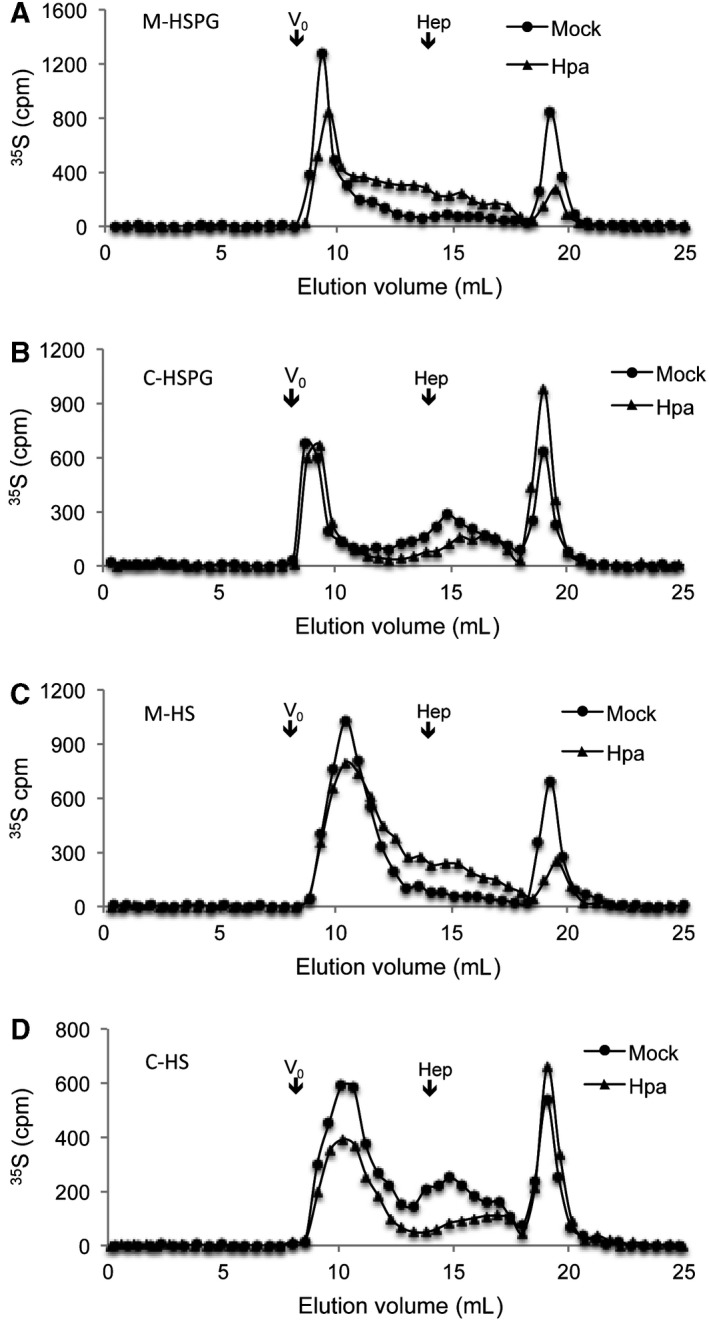
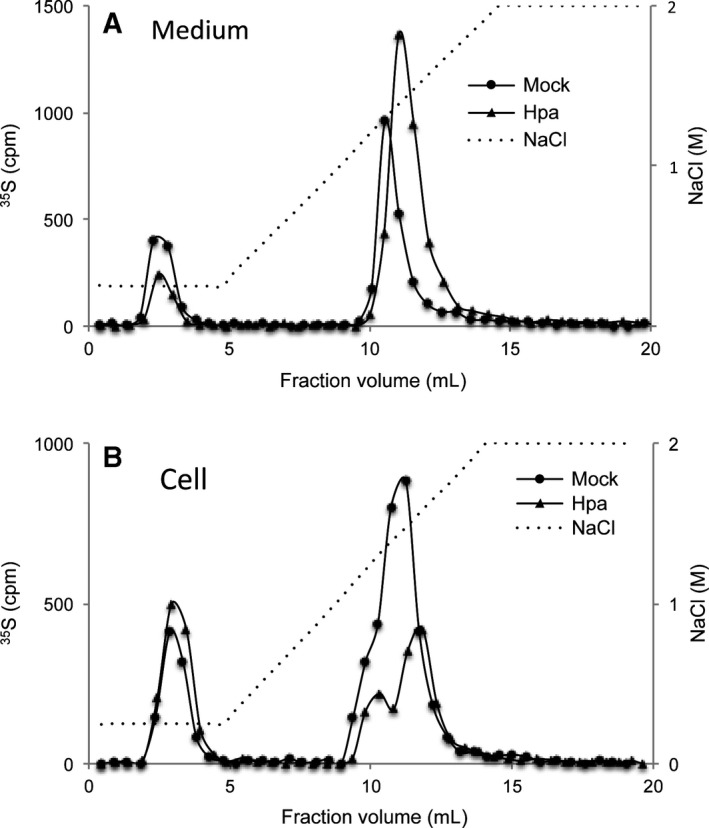
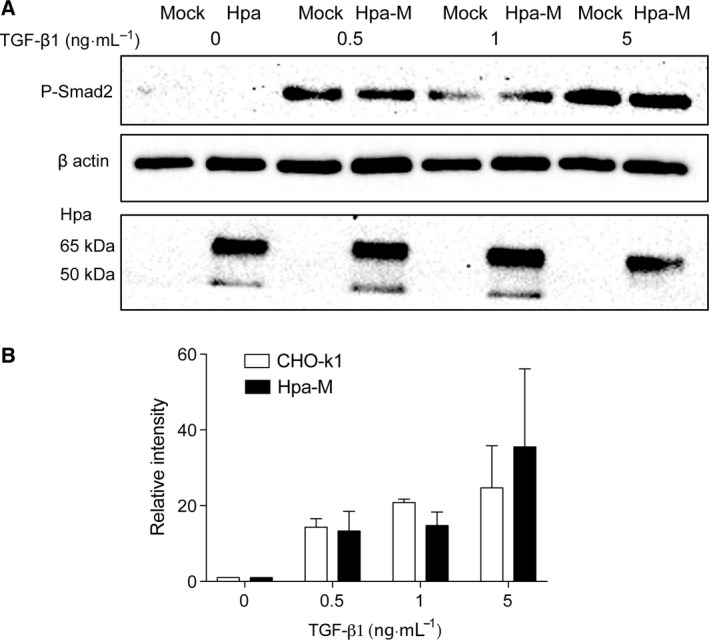
Heparan sulfate (HS) mediates the activity of various growth factors including TGF-β. Heparanase is an endo-glucuronidase that specifically cleaves and modifies HS structure. In this study, we examined the effect of heparanase expression on TGF-β1-dependent signaling activities. We found that overexpression of heparanase in human tumor cells (i.e., Fadu pharyngeal carcinoma, MCF7 breast carcinoma) attenuated TGF-β1-stimulated Smad phosphorylation and led to a slower cell proliferation. TGF-β1-stimulated Akt and Erk phosphorylation was also affected in the heparanase overexpression cells. This effect involved the enzymatic activity of heparanase, as overexpression of mutant inactive heparanase did not affect TGF-β1 signaling activity. Analysis of HS isolated from Fadu cells revealed an increase in sulfation of the HS that had a rapid turnover in cells overexpressing heparanase. It appears that the structural alterations of HS affect the ability of TGF-β1 to signal via its receptors and elicit a growth response. Given that heparanase expression promotes tumor growth in most cancers, this finding highlights a crosstalk between heparanase, HS, and TGF-β1 function in tumorigenesis.

Keywords: TGF‐beta; cancer cell; heparan sulfate; heparanase; signaling.


Figures

Figure 1
Figure 1
TGF‐β1‐induced Smad phosphorylation in Mock vs. Hpa Fadu cellsFadu cells stably overexpressing human heparanase (Hpa) and mock (Mock) transfected cells were seeded into six‐well plates at a density of 6 × 10⁵ cells per well. After 24 h of starvation (serum‐free medium), the cells were stimulated for 30 min with TGF‐β1 at the indicated concentrations. (A) Lysate supernatants were analyzed by western blotting using anti‐phospho‐Smad2 and anti‐Smad2/3 antibodies. Overexpression of heparanase in the Hpa cells was confirmed using anti‐heparanase antibody. (B) Band intensity measured in three independent experiments was analyzed by image lab™ Software and the average band intensity of P‐Smad2 is shown. Band intensity value of Mock cells without TGF‐β1 stimulation is defined as 1.
Figure 2
Figure 2
TGF‐β1‐induced Smad phosphorylation in Mock vs. Hpa MCF7 cells—cells, either stably overexpressing heparanase (Hpa) or mock transfected (Mock), were seeded into six‐well plates at a density of 6 × 10⁵ cells per well, starved and stimulated with the indicated concentrations of TGF‐β1 for 30 min. Cell lysates were analyzed by western blot (A) and quantified (B) as described in the legend to Fig. 1.
Figure 3
Figure 3
TGF‐β1‐stimulated proliferation of Fadu cells—starved Fadu cells stably overexpressing heparanase (Hpa) and mock (Mock) transfected cells were seeded on 96‐well plate (10 000 cell per well) and stimulated for 24 h with the indicated concentrations TGF‐β1. After addition of MTS reagent the absorbance at 490 nm was measured. The experiment was repeated two times and the average OD ± SE is shown. The OD of Mock cells that were not treated with TGF‐β1 is defined as 1. *P < 0.05.
Figure 4
Figure 4
TGF‐β1‐induced Akt and Erk phosphorylation in Mock vs. Hpa Fadu cellsFadu cells stably overexpressing human heparanase (Hpa) and mock (Mock) transfected cells were seeded into six‐well plates at a density of 3 × 10⁵ cells per well. After 24 h of starvation (serum‐free medium), for Akt signaling, the cells were directly stimulated for 1 h with TGF‐β1 at the indicated concentrations. For Erk, the cells were further cultured in the starvation medium in the presence of 3 μm GW6604 followed by stimulation with TGF‐β1 for 1 hr. Lysate supernatants were analyzed by western blotting using (A) anti‐phospho‐Akt and (B) anti‐Erk antibodies. Band intensity measured in three independent experiments was analyzed by image lab™ Software. The band intensity value of Mock cells without TGF‐β1 stimulation is defined as 1. *P < 0.05.
Figure 5
Figure 5
Analysis of HS chain length—Metabolically 35S‐labeled HS samples (10 000 cpm) from Fadu cells were separated on a Superose‐12 column showing increased amount of smaller HS fragments derived from heparanase overexpressing (Hpa) vs. Mock cells. Shown are HSPG (A, B) and HS‐free chains (C, D) from medium (A, C) and cell extracts (B, D); Vo and elution position of heparin (Hep, 14 kDa) are indicated. Degradation products (disaccharides) of CS are eluted at 18–20 mL.
Figure 6
Figure 6
Increased overall charge density in HS from Hpa‐Fadu cells – Metabolically 35S‐labeled HS samples (10 000 cpm) were applied onto DEAE‐sepharcel column connected to HPLC system and eluted with a linear gradient of 0.25–2 m NaCl. The chromatograms show that HS chains derived from Hpa medium (A) and the corresponding cells (B) are more retarded in the DEAE‐sepharcel gel. The peaks eluted at low salt concentrations are degradation products of CS.
Figure 7
Figure 7
Mutant heparanase has no effect on Smad phosphorylation. CHO‐K1 cells stably overexpressing enzymatically inactive mutant human heparanase (Hpa‐M; Glu225, Glu343) or Mock transfected were seeded into six‐well plates at a density of 6 × 10⁵ cells per well. After 24 h starvation, the cells were stimulated (30 min) with TGF‐β1 at the indicated concentrations. Cell lysate supernatants were analyzed as described in the legend to Fig. 1. Cell lysates were analyzed by western blot (A) and the band intensity was quantified and presented in (B). Overexpression of mutant heparanase was confirmed using anti‐heparanase antibody (the point mutation of heparanase did not affect its epitope for recognition by the antibody) (lower panel in A).

References

    1. Bernfield M, Gotte M, Park PW, Reizes O, Fitzgerald ML, Lincecum J and Zako M (1999) Functions of cell surface heparan sulfate proteoglycans. Annu Rev Biochem 68, 729–777. - PubMed
    1. Nakato H and Li JP (2016) Functions of heparan sulfate proteoglycans in development: insights from Drosophila models. Int Rev Cell Mol Biol 325, 275–293. - PubMed
    1. Li JP and Kusche‐Gullberg M (2016) Heparan sulfate: biosynthesis, structure, and function. Int Rev Cell Mol Biol 325, 215–273. - PubMed
    1. Sarrazin S, Lamanna WC and Esko JD (2011) Heparan sulfate proteoglycans. Cold Spring Harb Perspect Biol 3, a004952. - PMC - PubMed
    1. Lin X (2004) Functions of heparan sulfate proteoglycans in cell signaling during development. Development 131, 6009–6021. - PubMed

LinkOut - more resources