

Epidemiological Pattern of Injuries in Iran; a Nationwide Review of Seven Million Emergency Department Admissions
- PMID: 28286817
- PMCID: PMC5325878
Epidemiological Pattern of Injuries in Iran; a Nationwide Review of Seven Million Emergency Department Admissions
Abstract
Introduction: Globally, it is estimated that around 5.8 million people die annually as result of injuries, which causes 10% of all deaths and 16% of disability adjusted life years lost worldwide. This study aimed to determine the epidemiology of injuries in emergency departments in Iran.
Method: This cross sectional study was carried out using national injury surveillance data registry from 21 March 2009 to 20 March 2014.
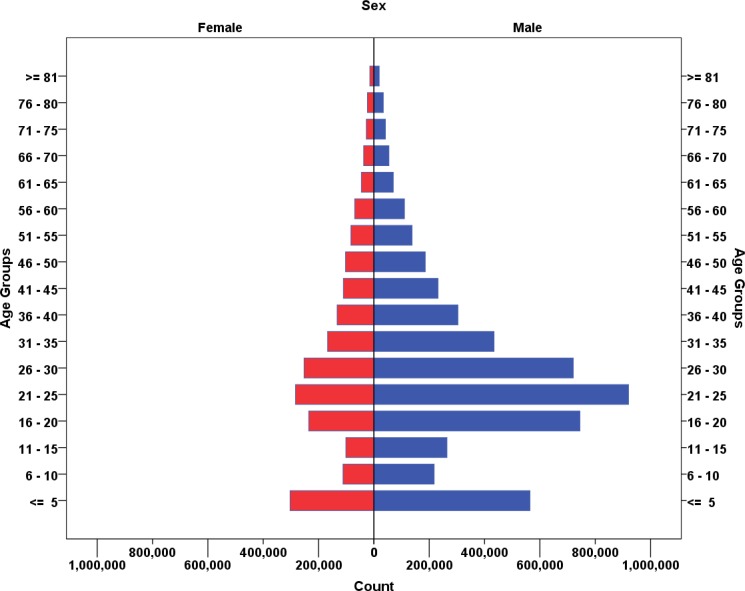
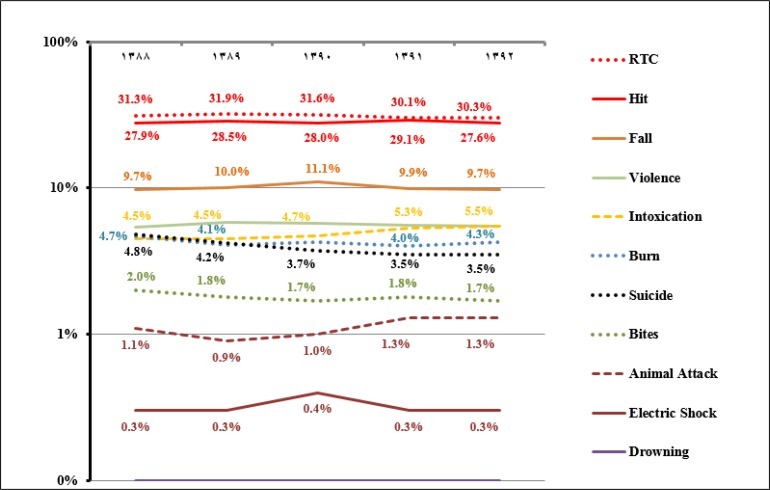
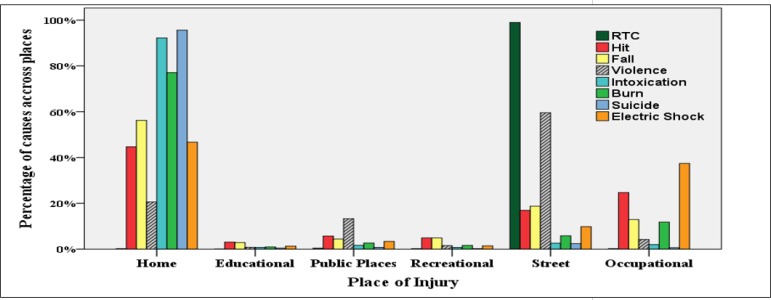
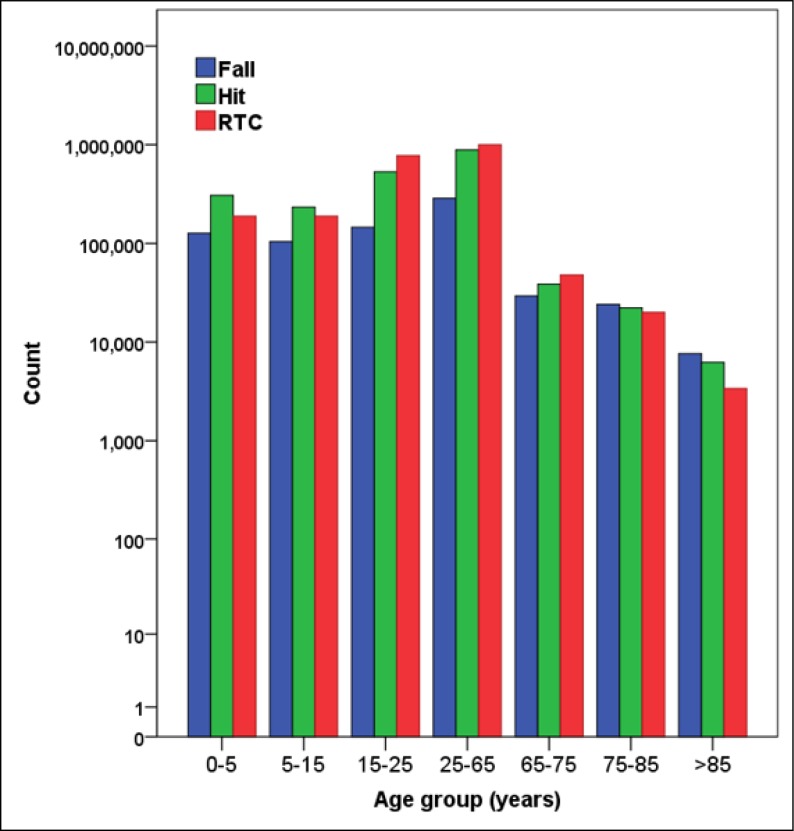
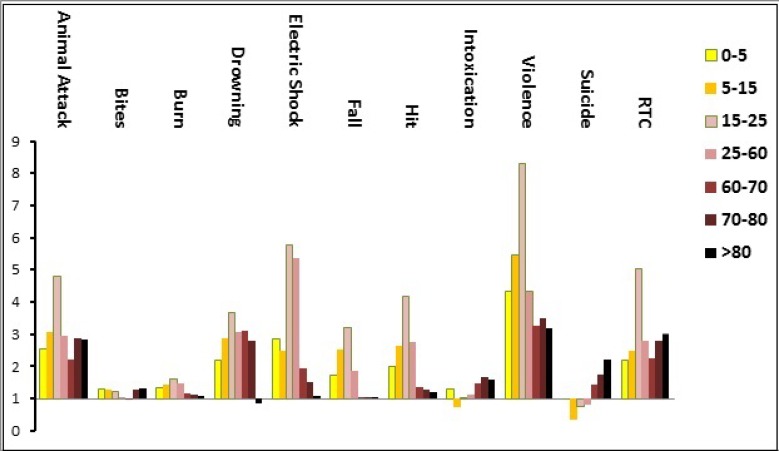
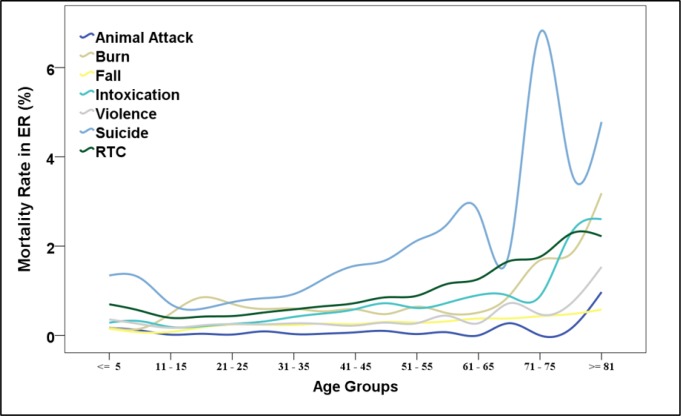
Results: 7,176,344 patients with the mean age of 27.5 ± 17.8 years were registered to 657 EDs (70.6% male). Road Traffic Crash (RTC) was the most common cause of injury (31.0%) followed by hit (28.2%) and fall (10.1%). While roads were the commonest place of injuries, 34.0% of patients have been injured at home. More than 90% of injuries were unintentional. Assault and suicide attempt were causes of injury in 5.6% and 3.9% of patients, respectively.
Conclusion: This paper addresses where prevention measures are most urgently needed and offers insights which could be useful for injury prevention programs in Iran and other developing countries.
Keywords: Epidemiology; accident prevention; epidemiological monitoring; mortality; multiple trauma; wounds and injuries.
Conflict of interest statement
None.
Figures
Similar articles
-
Epidemiology of injuries and poisonings in emergency departments in Iran.Public Health. 2011 Oct;125(10):727-33. doi: 10.1016/j.puhe.2011.07.006. Epub 2011 Sep 8. Public Health. 2011. PMID: 21906762
-
Injuries as a public health problem in sub-Saharan Africa: epidemiology and prospects for control.East Afr Med J. 2000 Dec;77(12 Suppl):S1-43. East Afr Med J. 2000. PMID: 12862115
-
Epidemiologic study of traffic crash mortality among motorcycle users in Iran (2011-2017).Chin J Traumatol. 2020 Aug;23(4):219-223. doi: 10.1016/j.cjtee.2020.05.008. Epub 2020 May 30. Chin J Traumatol. 2020. PMID: 32669222 Free PMC article.
-
Road traffic injuries in Poland: magnitude and risk factors.Eur J Trauma Emerg Surg. 2019 Oct;45(5):815-820. doi: 10.1007/s00068-019-01093-6. Epub 2019 Feb 12. Eur J Trauma Emerg Surg. 2019. PMID: 30746554 Review.
-
Unintentional injuries in developing countries: the epidemiology of a neglected problem.Epidemiol Rev. 1991;13:228-66. doi: 10.1093/oxfordjournals.epirev.a036070. Epidemiol Rev. 1991. PMID: 1765113 Review.
Cited by
-
A qualitative study on apparent and latent contributing factors to driving errors in Iran.Sci Rep. 2024 Sep 10;14(1):21127. doi: 10.1038/s41598-024-71833-1. Sci Rep. 2024. PMID: 39256464 Free PMC article.
-
Drowning in the Eastern Mediterranean region: a systematic literature review of the epidemiology, risk factors and strategies for prevention.BMC Public Health. 2022 Aug 3;22(1):1477. doi: 10.1186/s12889-022-13778-6. BMC Public Health. 2022. PMID: 35922840 Free PMC article.
-
Analysis of Hospital Costs in Road Traffic Injuries.Bull Emerg Trauma. 2021 Jan;9(1):36-41. doi: 10.30476/BEAT.2021.86855. Bull Emerg Trauma. 2021. PMID: 33937424 Free PMC article.
-
Epidemiological pattern of trauma patients based on the mechanisms of trauma: trends of a regional trauma center in Midwest of Iran.BMC Emerg Med. 2022 Dec 26;22(1):210. doi: 10.1186/s12873-022-00756-9. BMC Emerg Med. 2022. PMID: 36572877 Free PMC article.
-
Epidemiologic and Clinical Characteristics of Intentional Injuries among Cases Admitted to Sina Hospital: Affiliated with the National Trauma Registry of Iran.J Res Health Sci. 2023 Sep 29;23(3):e00587. doi: 10.34172/jrhs.2023.122. Epub 2023 Sep 29. J Res Health Sci. 2023. PMID: 38315902 Free PMC article.
References
-
- Peden M, McGee K, Sharma G. The injury chart book: a graphical overview of the global burden of injuries. Geneva: World Health Organization; 2002. 5 pp.
-
- Organization WH. Fatal injury surveillance in mortuaries and hospitals: a manual for practitioners. 2012.
-
- Organization WH. Global report on drowning: preventing a leading killer: executive summary. 2014.
-
- Jafari N, Abolhassani F, Naghavi M, Pourmalek F, Moradi Lakeh M, Kazemeini H, et al. National burden of disease and study in Iran. Iranian J Publ Health. 2009;38(1):71–3.
-
- Organization WH. Global status report on road safety 2013: supporting a decade of action: summary. 2013.