. 2017 Mar 13:7:44001.
doi: 10.1038/srep44001.

Loss of Centromere Cohesion in Aneuploid Human Oocytes Correlates with Decreased Kinetochore Localization of the Sac Proteins Bub1 and Bubr1

Affiliations

Loss of Centromere Cohesion in Aneuploid Human Oocytes Correlates with Decreased Kinetochore Localization of the Sac Proteins Bub1 and Bubr1

Julie Lagirand-Cantaloube et al. Sci Rep. .

Abstract

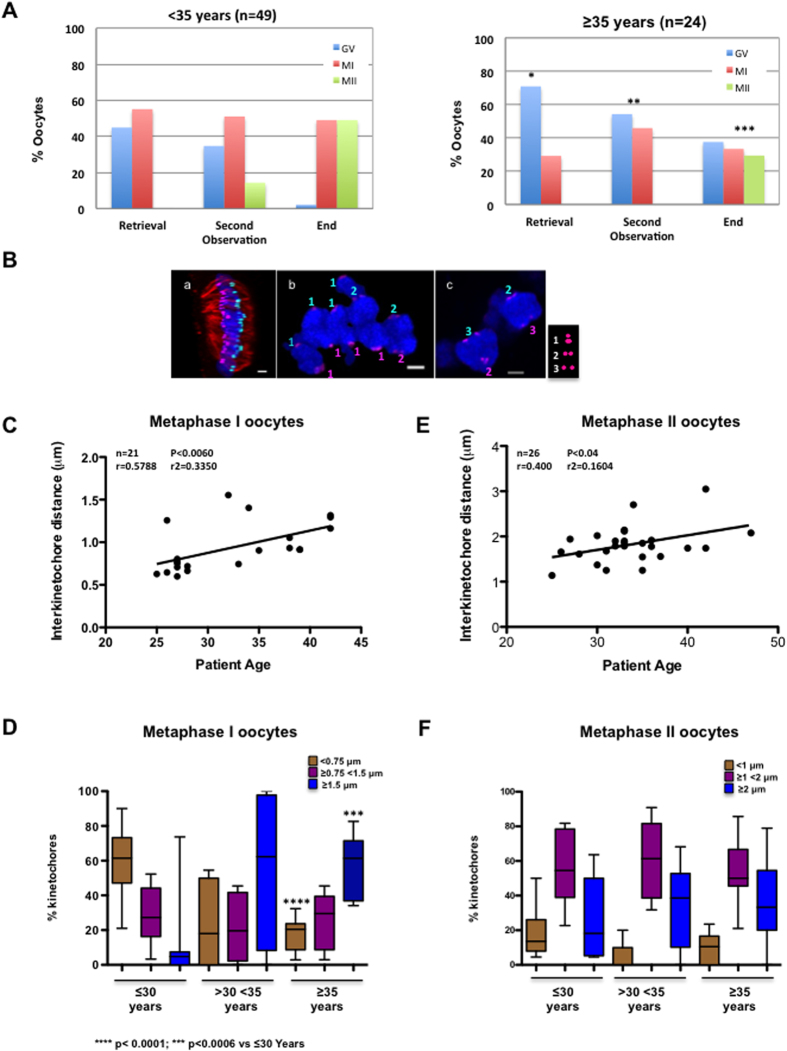
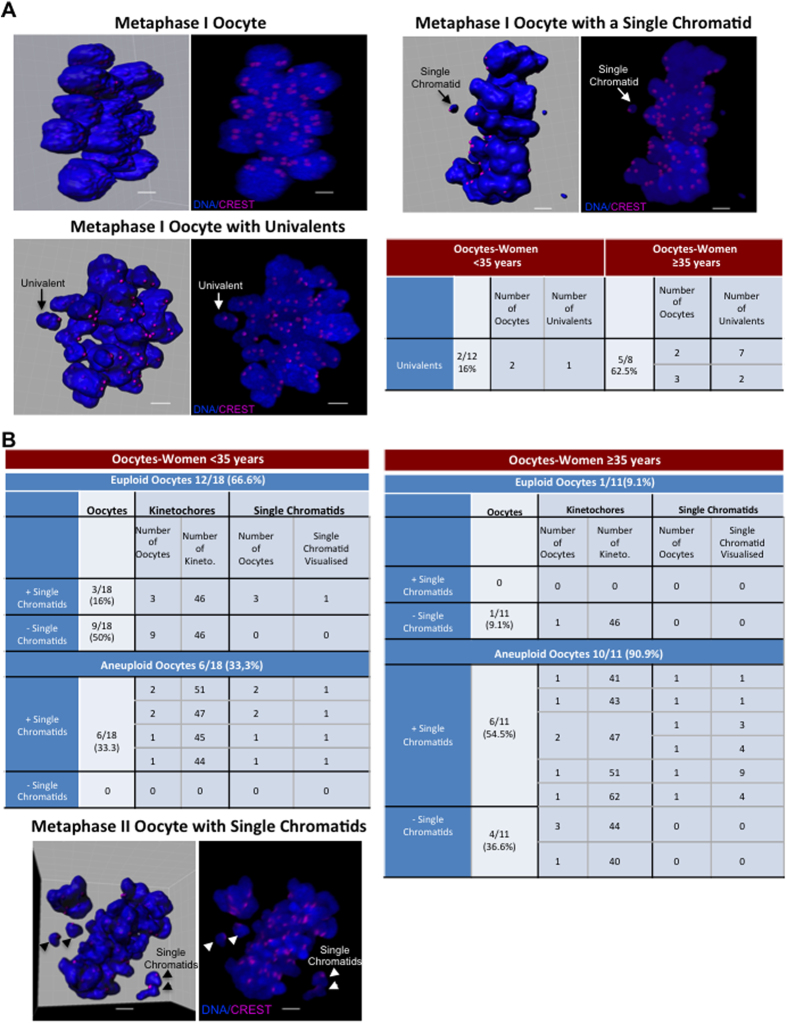
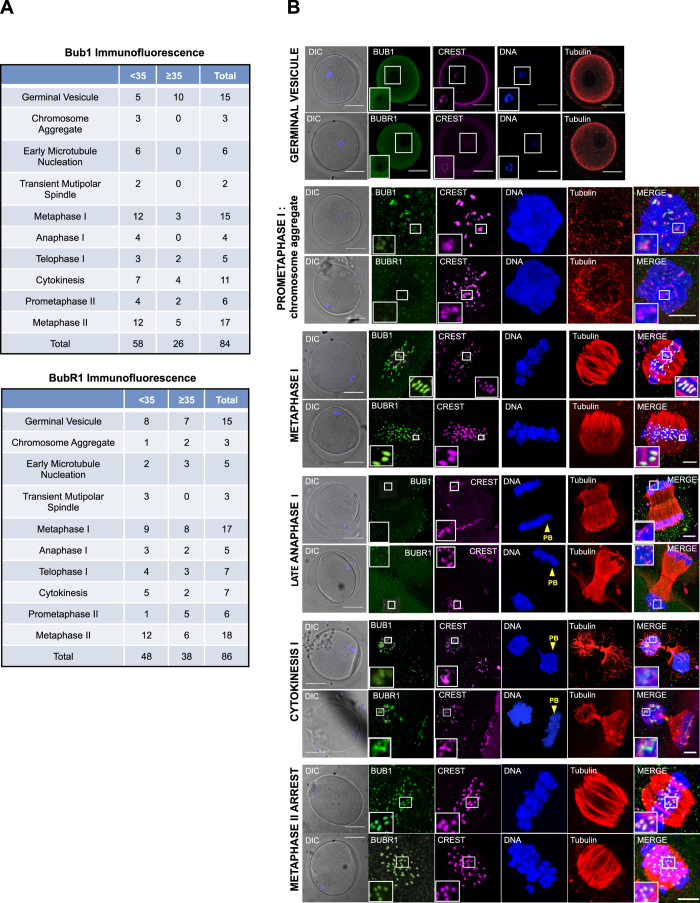
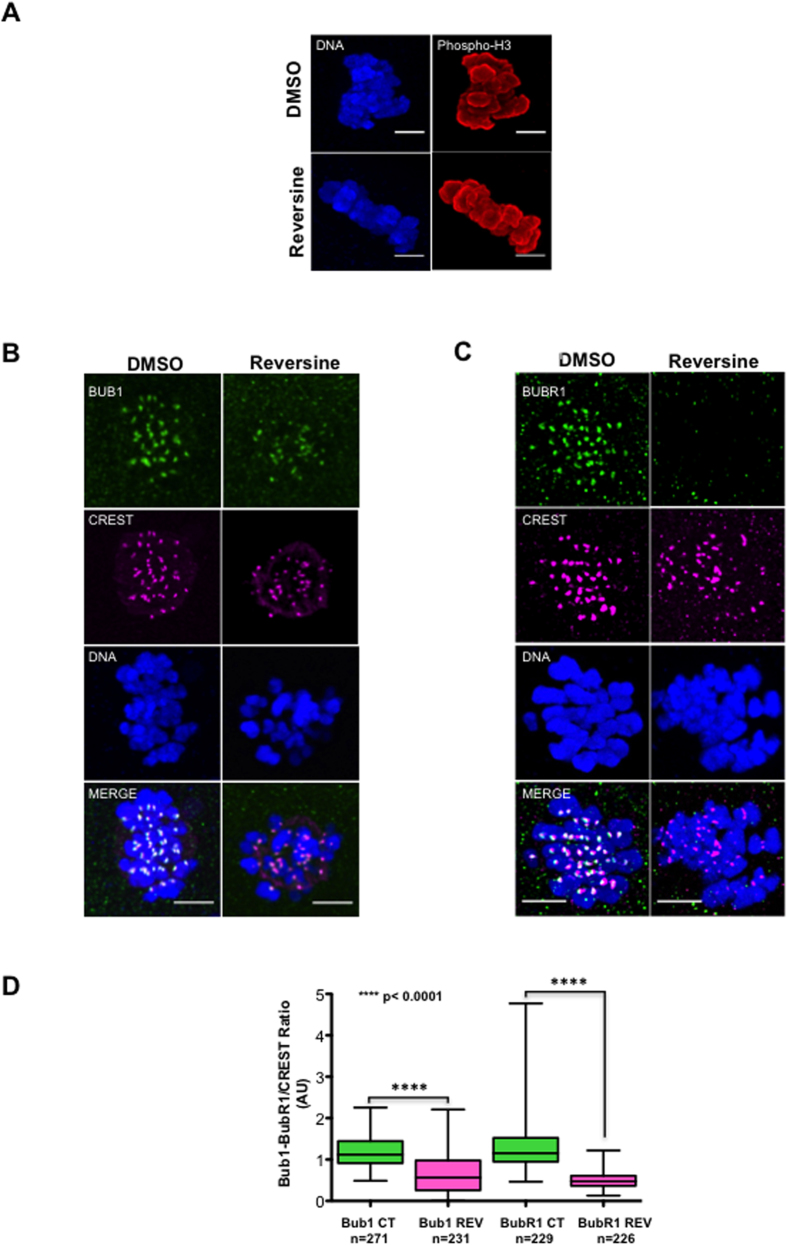
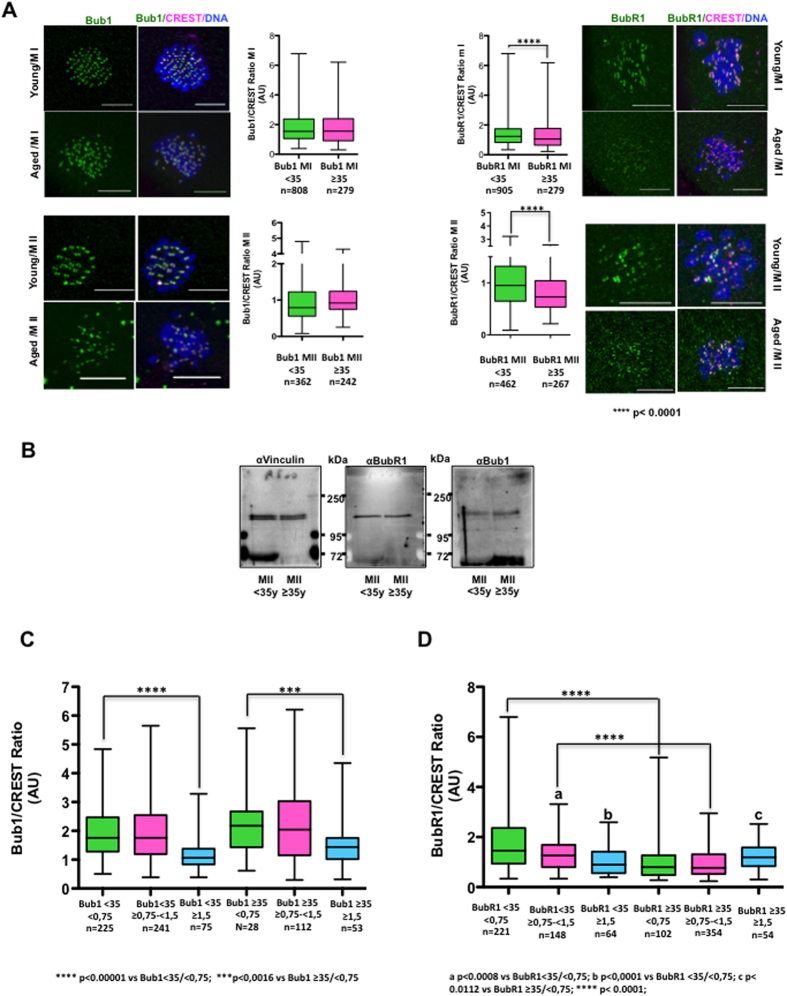
In human eggs, aneuploidy increases with age and can result in infertility and genetic diseases. Studies in mouse oocytes suggest that reduced centromere cohesion and spindle assembly checkpoint (SAC) activity could be at the origin of chromosome missegregation. Little is known about these two features in humans. Here, we show that in human eggs, inter-kinetochore distances of bivalent chromosomes strongly increase with age. This results in the formation of univalent chromosomes during metaphase I (MI) and of single chromatids in metaphase II (MII). We also investigated SAC activity by checking the localization of BUB1 and BUBR1. We found that they localize at the kinetochore with a similar temporal timing than in mitotic cells and in a MPS1-dependent manner, suggesting that the SAC signalling pathway is active in human oocytes. Moreover, our data also suggest that this checkpoint is inactivated when centromere cohesion is lost in MI and consequently cannot inhibit premature sister chromatid separation. Finally, we show that the kinetochore localization of BUB1 and BUBR1 decreases with the age of the oocyte donors. This could contribute to oocyte aneuploidy.


Conflict of interest statement

The authors declare no competing financial interests.

Figures

Figure 1
Figure 1. Inter-kinetochore distance in bivalents increases with maternal age.
(A) Oocytes were analysed by confocal microscopy after retrieval, after 3 hours (Second Observation) and at the end of culture for 24 h (End) and classified as germinal vesicle (GV), metaphase I (MI) and metaphase II (MII) oocytes. The percentage of oocytes at the different meiotic stages according to the maternal age (<35 or ≥35 years) is shown. The oocyte meiotic stage distribution was significantly different in women <35 versus women ≥35 years of age; *p < 0.032; **p < 0.045 and ***p < 0.0046 (Kruskal-Wallis test). (B) Deconvolved images of a MI-arrested oocyte immunostained with anti-tubulin (red) and anti-CREST (magenta) antibodies (a) were analysed with Imaris for automated spot detection. Spots corresponding to kinetochores from homologous chromosomes are depicted in light blue and pink. (b and c) Deconvolved images from zoomed zones of different MI-arrested oocytes stained with anti-tubulin (red) and anti-CREST antibodies (Magenta). Sister kinetochore distances were measured using Imaris. The light blue and pink numbers indicate the kinetochore distance (1: inter-kinetochore distance <0.75 μm, 2: between 0.75 μm and 1.5 μm and 3: >1.5 μm). Scale bar: 2 μm. (C) Distribution of the inter-kinetochore distance of 21 MI oocytes relative to the donors’ age (25 to 42 years). (D) Box and whisker diagram showing the kinetochore distribution (median, minimum and maximum values) based on their inter-kinetochore distances (<0.75 μm, ≥0.75 and <1.5 μm and ≥1.5 μm) and according to the patients’ age (≤30 years, ≥30 and <35 years, and ≥35 years). Statistical analysis performed using the unpaired two-tailed Student’s t test. (E). Distribution of the inter-kinetochore distance of 26 MII oocytes relative to the donors’ age (25 to 42 years). (F) Like for (D) except that the inter-kinetochore distances in MII oocytes were classified as <1 μm, ≥1 and <2 μm and ≥2 μm.
Figure 2
Figure 2. The presence of univalents in metaphase I (MI) oocytes and of single chromatids in metaphase II (MII) oocytes increases with maternal age.
(A) Three MI oocytes with normal bivalent distribution (upper left panels) or with univalents (lower left panels) or single chromatids (upper right panels). Spots were automatically detected (left panels) with Imaris in deconvolved images of oocytes immunostained with Hoechst (blue) and anti-CREST (magenta) antibodies (right panels). The table shows the number of oocytes displaying univalents in oocytes from young (<35 years) and older (≥35 years) women. (B) Tables showing the number of kinetochores and single chromatids present in MII oocytes from younger (<35 years) and older women (≥35 years). Bottom, MII oocyte with single chromatids (representative image). Scale bars, 5 μm.
Figure 3
Figure 3. Distribution of the SAC proteins BUB1 and BUBR1 during meiosis.
(A) The tables show the numbers of oocytes at different meiotic stages from <35 and ≥35-year-old women used for immunostaining with anti-BUB1 -BUBR1, -CREST and –tubulin antibodies. DNA was stained with Hoechst. (B) Representative confocal images of oocytes immunostained with anti-BUB1, -BUBR1, - CREST and -tubulin antibodies (one z-plan) during the different phases of meiosis. Scale bars, 50 μm, and 5 μm for zoomed images. DIC, differential interference contrast microscopy; PB, polar body.
Figure 4
Figure 4. In human oocytes, BUB1 and BUBR1 kinetochore localization requires MPS1 activity.
(A) Metaphase II oocytes were incubated (reversine) or not (DMSO) with the MPS1 inhibitor reversine for 30 min, stained with the anti-phosphorylated H3 on Ser10 antibody (Phospho-H3) and Hoechst and imaged by confocal microscopy. (B,C) Representative images of metaphase II oocytes incubated or not with reversine and then immunostained using anti-BUB1, -BUBR1 and -CREST antibodies and analysed by confocal microscopy. DNA was stained with Hoechst. Scale bars, 5 μm. (D) Box and whisker diagram showing the median, minimum and maximum values of the BUB1/BUBR1 to CREST immunofluorescence signal ratios of each kinetochore from oocytes incubated (REV) or not (CT) with the MPS1 inhibitor reversine for 30 min. Significance was assessed with the unpaired two-tailed Student’s t test.
Figure 5
Figure 5. BUB1 and BUBR1 staining decreases in kinetochores from aged oocytes and in bivalents with high IKT distances.
(A) Representative deconvolved images of MI and MII oocytes from young (<35 years) and older (≥35 years) women after immunostaining with anti-BUB1, BUBR1 and -CREST antibodies and box and whisker diagrams showing the median, minimum and maximum values of BUB1/BUBR1 to CREST immunofluorescence signal ratios. (B) BUBR1, BUB1 and vinculin (control) protein levels were analysed by western blotting in oocytes from young (n = 20) and older (n = 20) women. (C,D) The median, minimum and maximum levels of the BUB1-CREST and BUBR1-CREST immunofluorescence signal ratios in kinetochores classified according to their inter-kinetochore distance in oocytes from young and older women. Two-tailed unpaired Student’s t tests were performed to determine the statistical relevance.

References

    1. Hassold T. & Hunt P. To err (meiotically) is human: the genesis of human aneuploidy. Nature reviews. Genetics 2, 280–291, doi: 10.1038/35066065 (2001). - DOI - PubMed
    1. Bauld R., Sutherland G. R. & Bain A. D. Chromosome studies in investigation of stillbirths and neonatal deaths. Arch Dis Child 49, 782–788 (1974). - PMC - PubMed
    1. Dailey T., Dale B., Cohen J. & Munne S. Association between nondisjunction and maternal age in meiosis-II human oocytes. Am J Hum Genet 59, 176–184 (1996). - PMC - PubMed
    1. Cheng E. Y. et al.. Meiotic recombination in human oocytes. PLoS Genet 5, e1000661, doi: 10.1371/journal.pgen.1000661 (2009). - DOI - PMC - PubMed
    1. Haering C. H., Lowe J., Hochwagen A. & Nasmyth K. Molecular architecture of SMC proteins and the yeast cohesin complex. Molecular cell 9, 773–788 (2002). - PubMed

Publication types

Substances

LinkOut - more resources