

Spatial confluence of psychological and anatomical network constructs in the human brain revealed by a mass meta-analysis of fMRI activation
- PMID: 28287169
- PMCID: PMC5347156
- DOI: 10.1038/srep44259
Spatial confluence of psychological and anatomical network constructs in the human brain revealed by a mass meta-analysis of fMRI activation
Abstract
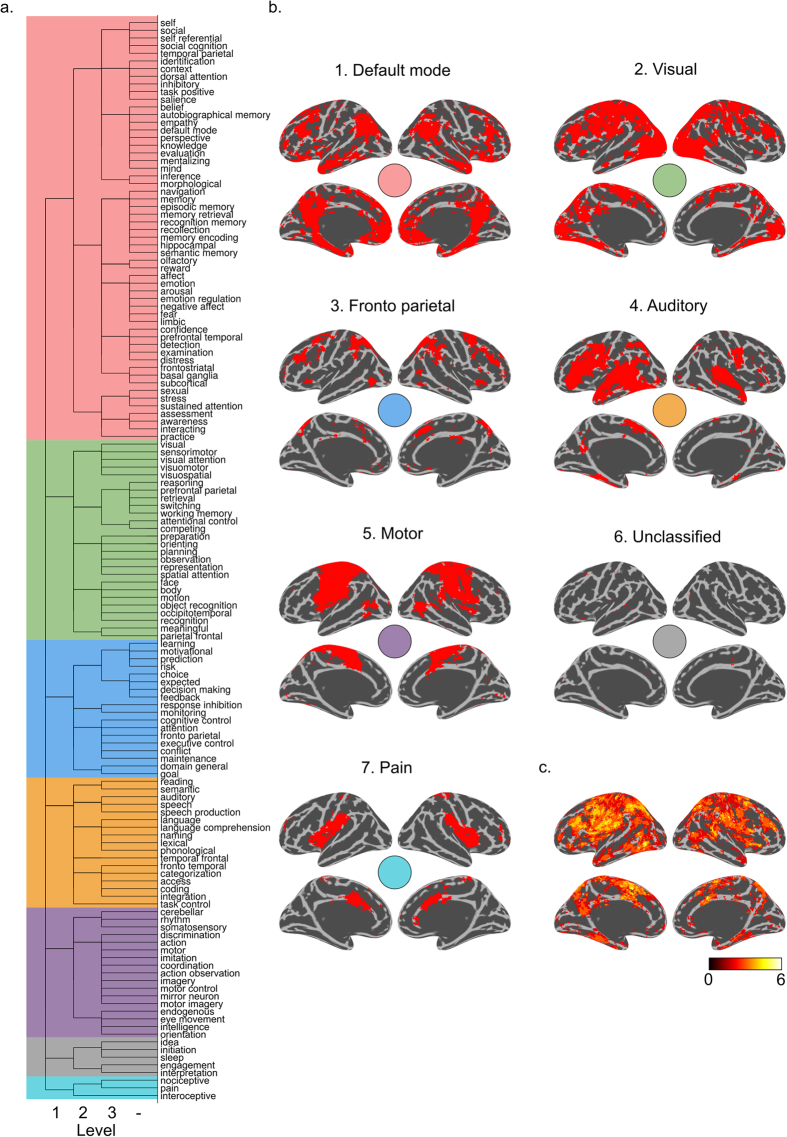
It is well-known that the brain's activity is organized into networks but it is unclear how many networks exist. Additionally, there is also a risk of ambiguity since different names for the same network are frequently reported in the literature. In this study, we employed a mass meta-analysis of fMRI data associated with network constructs originating from both psychology and neuroscience. Based on the results from the meta-analysis, we derived a spatial similarity map between all construct terms, showing that the brain's networks cluster hierarchically into several levels. The results presented are useful as a first step in developing a unified terminology for large-scale brain network and a platform for a queryable network atlas.
Conflict of interest statement
The authors declare no competing financial interests.
Figures


Similar articles
-
Comprehensive investigation of predictive processing: A cross- and within-cognitive domains fMRI meta-analytic approach.Hum Brain Mapp. 2024 Aug 15;45(12):e26817. doi: 10.1002/hbm.26817. Hum Brain Mapp. 2024. PMID: 39169641 Free PMC article.
-
Mapping cognitive and emotional networks in neurosurgical patients using resting-state functional magnetic resonance imaging.Neurosurg Focus. 2020 Feb 1;48(2):E9. doi: 10.3171/2019.11.FOCUS19773. Neurosurg Focus. 2020. PMID: 32006946 Free PMC article. Review.
-
Spatio-temporal modeling of connectome-scale brain network interactions via time-evolving graphs.Neuroimage. 2018 Oct 15;180(Pt B):350-369. doi: 10.1016/j.neuroimage.2017.10.067. Epub 2017 Nov 10. Neuroimage. 2018. PMID: 29102809 Free PMC article. Review.
-
Weak Higher-Order Interactions in Macroscopic Functional Networks of the Resting Brain.J Neurosci. 2017 Oct 25;37(43):10481-10497. doi: 10.1523/JNEUROSCI.0451-17.2017. Epub 2017 Sep 26. J Neurosci. 2017. PMID: 28951453 Free PMC article.
-
The brain's internal echo: Longer timescales, stronger recurrent connections and higher neural excitation in self regions.Neuroimage. 2025 May 15;312:121221. doi: 10.1016/j.neuroimage.2025.121221. Epub 2025 Apr 15. Neuroimage. 2025. PMID: 40246256
Cited by
-
Behavioral Studies Using Large-Scale Brain Networks - Methods and Validations.Front Hum Neurosci. 2022 Jun 16;16:875201. doi: 10.3389/fnhum.2022.875201. eCollection 2022. Front Hum Neurosci. 2022. PMID: 35782044 Free PMC article. Review.
-
GINNA, a 33 resting-state networks atlas with meta-analytic decoding-based cognitive characterization.Commun Biol. 2025 Feb 18;8(1):253. doi: 10.1038/s42003-025-07671-2. Commun Biol. 2025. PMID: 39966659 Free PMC article.
References
-
- Bullmore E. & Sporns O. The economy of brain network organization. Nature reviews. Neuroscience 13, 336–49 (2012). - PubMed
-
- Engen H. G. & Singer T. Empathy circuits. Current Opinion in Neurobiology 23, 275–282 (2013). - PubMed
-
- Ohlendorf S., Sprenger A. & Speck O. Visual motion, eye motion, and relative motion: A parametric fMRI study of functional specializations of smooth pursuit eye movement network areas. Journal of Vision 10, 1–15 (2010). - PubMed
Publication types
MeSH terms
LinkOut - more resources
Full Text Sources
Other Literature Sources
Medical
