. 2017 Apr 3;127(4):1353-1369.
doi: 10.1172/JCI85963. Epub 2017 Mar 13.

HDAC6-mediated acetylation of lipid droplet-binding protein CIDEC regulates fat-induced lipid storage

HDAC6-mediated acetylation of lipid droplet-binding protein CIDEC regulates fat-induced lipid storage

Hui Qian et al. J Clin Invest. .

Abstract

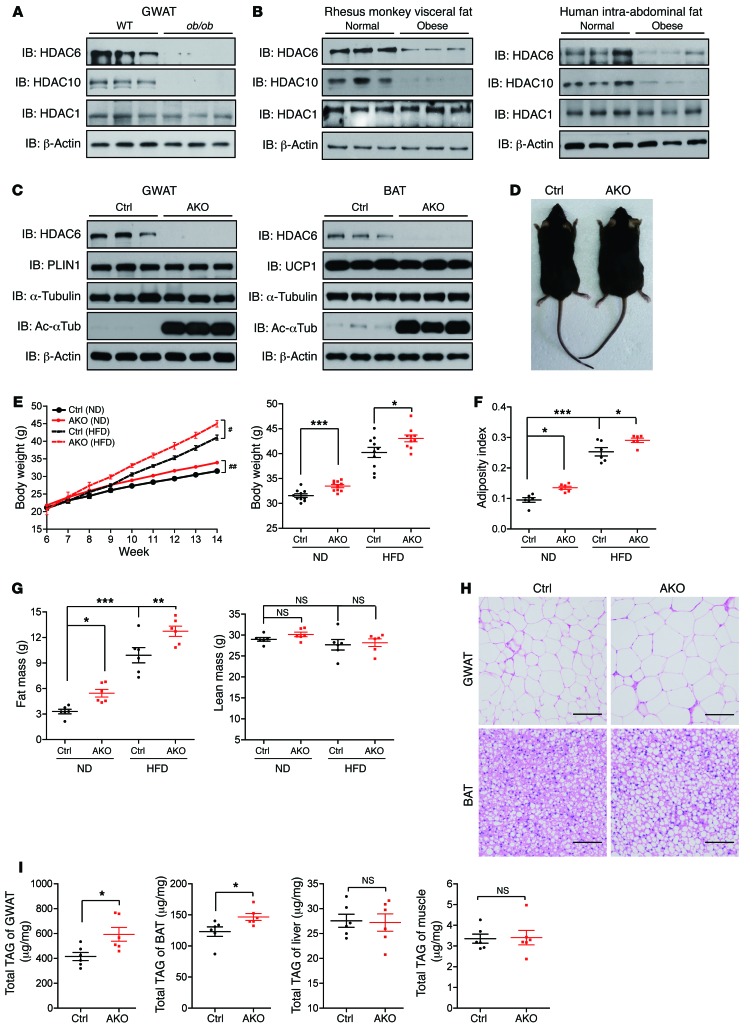
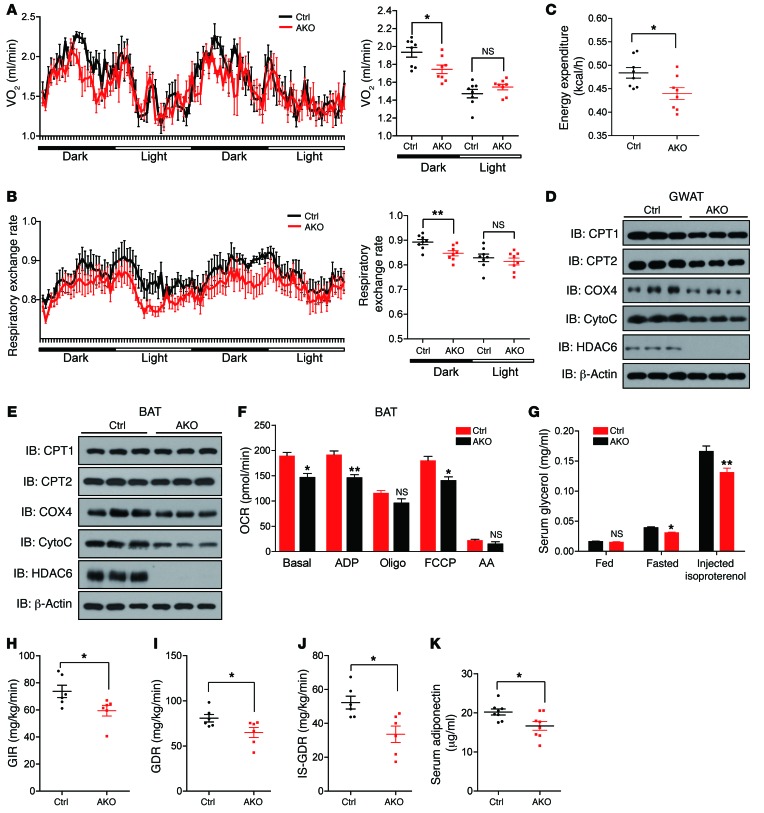
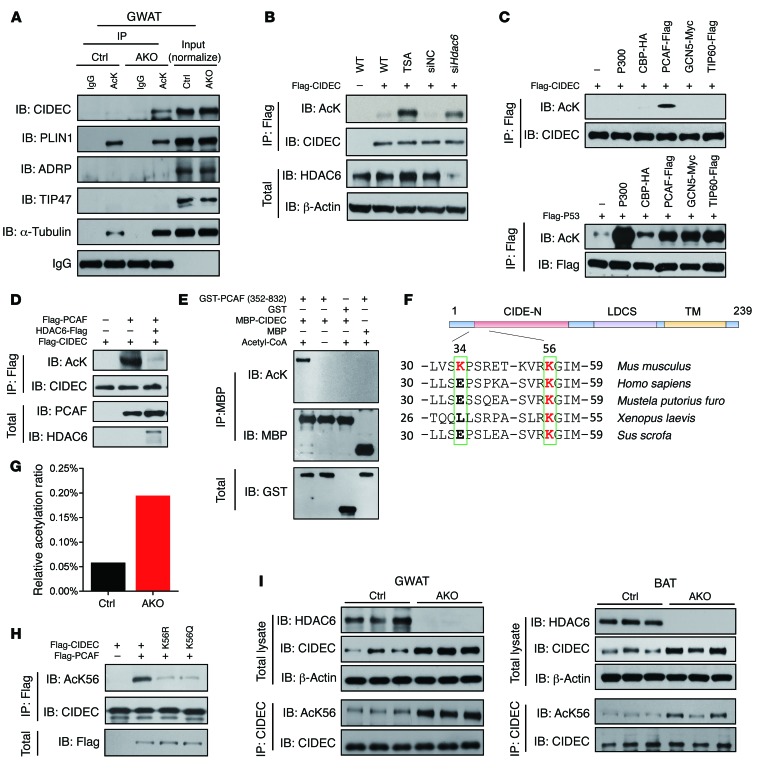
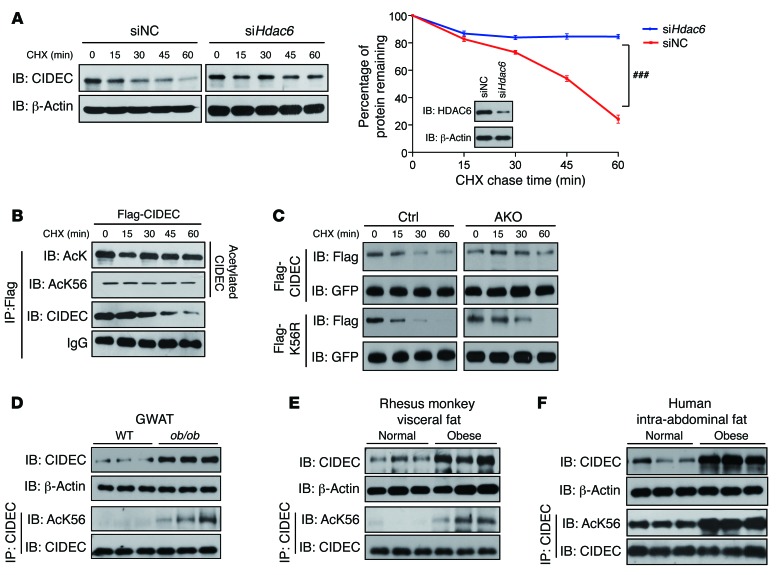
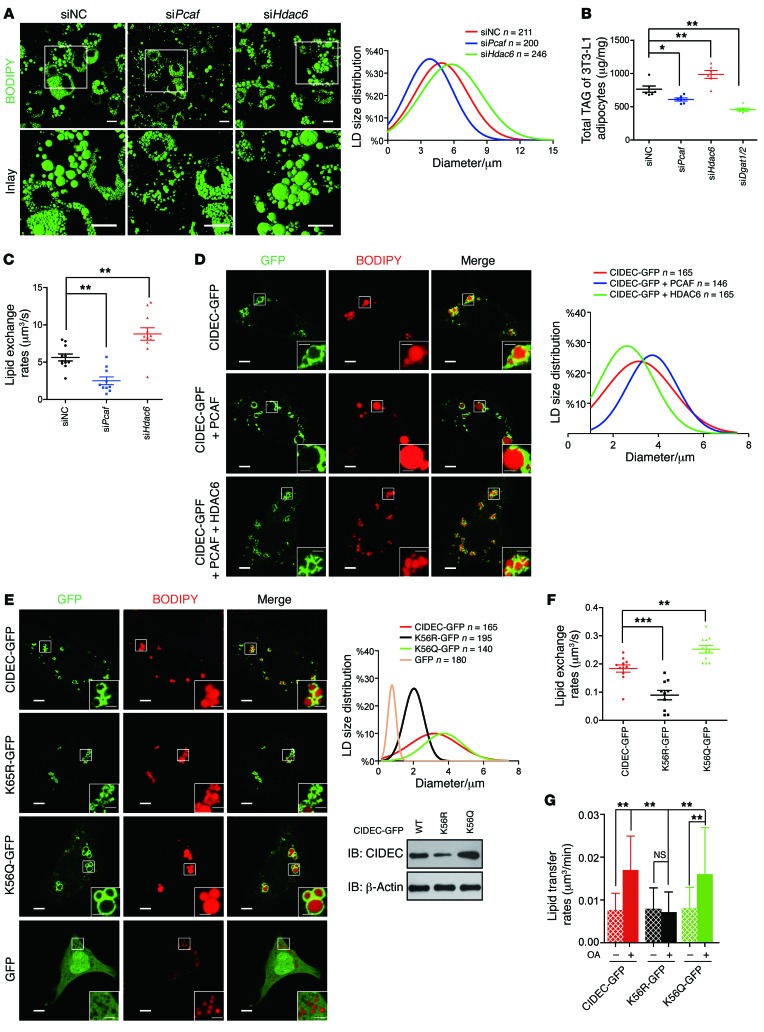
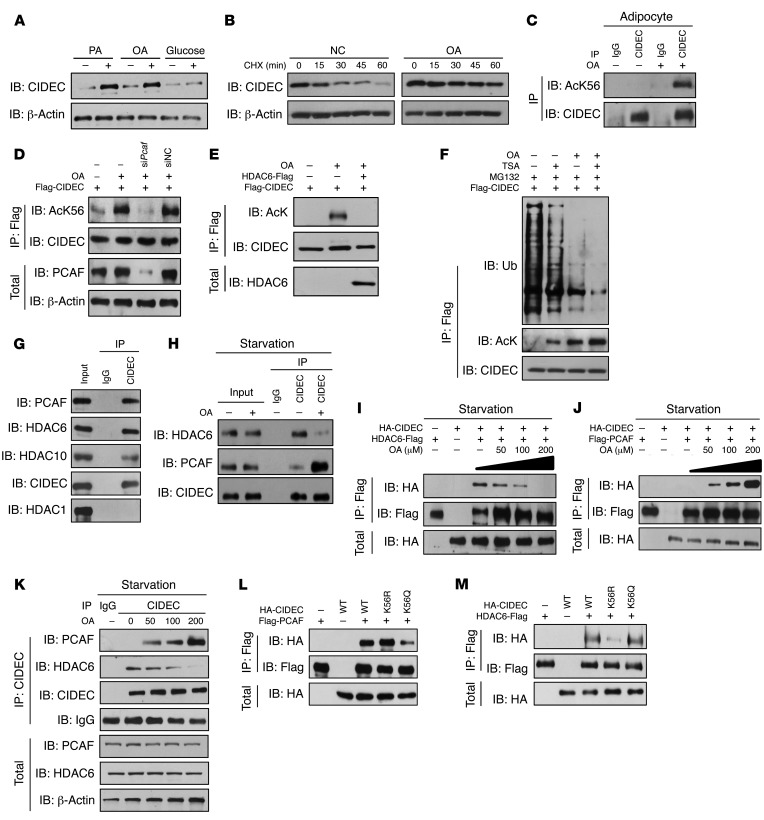
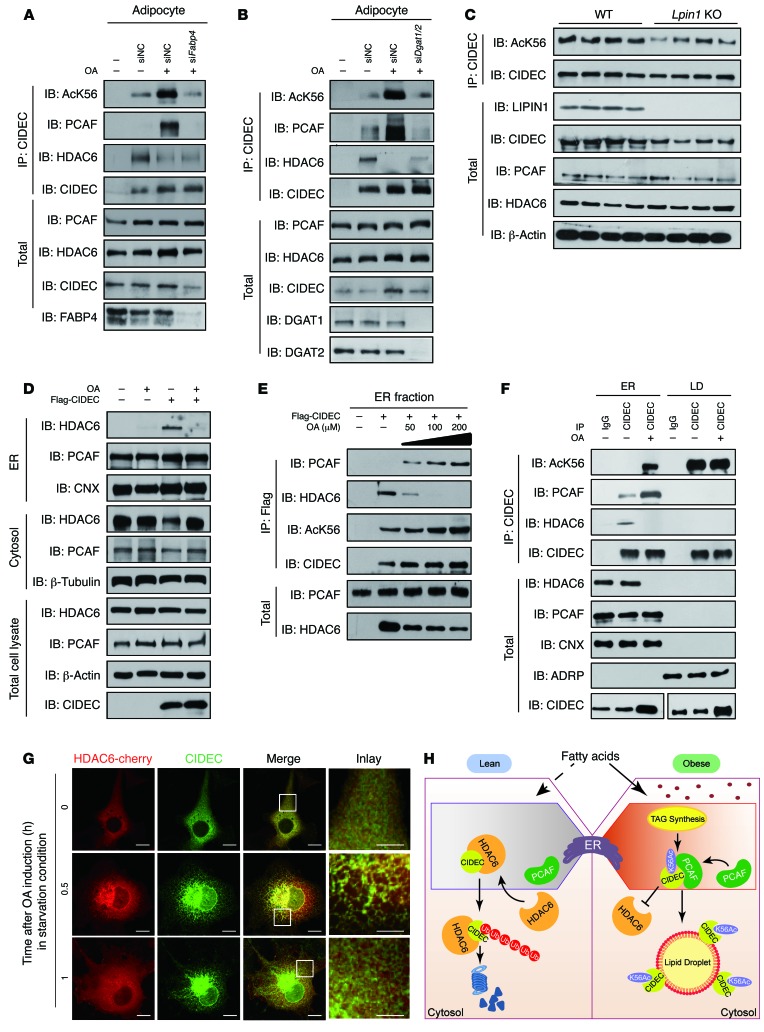
Obesity is characterized by aberrant fat accumulation. However, the intracellular signaling pathway that senses dietary fat and leads to fat storage remains elusive. Here, we have observed that the levels of histone deacetylase 6 (HDAC6) and the related family member HDAC10 are markedly reduced in adipose tissues of obese animals and humans. Mice with adipocyte-specific depletion of Hdac6 exhibited increased fat accumulation and reduced insulin sensitivity. In normal adipocytes, we found that reversal of P300/CBP-associated factor-induced (PCAF-induced) acetylation at K56 on cell death-inducing DFFA-like effector C (CIDEC, also known as FSP27) critically regulated lipid droplet fusion and lipid storage. Importantly, HDAC6 deacetylates CIDEC, leading to destabilization and reduced lipid droplet fusion. Accordingly, we observed elevated levels of CIDEC and its acetylated form in HDAC-deficient adipocytes as well as the adipose tissue of obese animals and humans. Fatty acids (FAs) prevented CIDEC deacetylation by promoting the dissociation of CIDEC from HDAC6, which resulted in increased association of CIDEC with PCAF on the endoplasmic reticulum. Control of CIDEC acetylation required the conversion of FAs to triacylglycerols. Thus, we have revealed a signaling axis that is involved in the coordination of nutrient availability, protein acetylation, and cellular lipid metabolic responses.


Conflict of interest statement

Conflict of interest: The authors have declared that no conflict of interest exists.

Figures

Figure 1
Figure 1. HDAC6 is a negative regulator of lipid storage.
(A) Levels of HDAC6 and HDAC10 protein were decreased in the GWAT of leptin-deficient (ob/ob) mice (n = 3 mice per group). (B) Reduced expression of HDAC6 and HDAC10 in the visceral fat of obese rhesus monkeys and the intra-abdominal fat of humans (n = 3 samples per group). (C) Levels of HDAC6 protein in the GWAT and the BAT of control (Ctrl) and Hdac6 AKO mice (n = 3 mice per group). Ac-αTub, acetlyated α-tubulin. (D) Representative photograph of 4-month-old control and Hdac6 AKO mice. (E) Growth curve (n = 6 mice per group) reflected by body weight analysis (n = 10 mice per group) for control and the Hdac6 AKO mice fed ND or HFD. Two-way repeated-measures ANOVA was used to evaluate the data (left panel); #P < 0.05, ##P < 0.01. For the for right panel, 2-tailed Student t test was used; *P < 0.05, **P < 0.01, ***P < 0.001. (F) Adiposity index for control and Hdac6 AKO mice (n = 6 mice per group). (G) Fat mass and lean mass by MRI scanning of control and Hdac6 AKO mice (n = 6 mice per group). (H) Morphology of the GWAT and BAT of control and Hdac6 AKO mice (n = 3 mice per group). Scale bars: 50 μm. (I) Total TAG levels of GWAT, BAT, liver, and muscle of control and Hdac6 AKO mice (n = 6 mice per group). Data represent the mean ± SEM; *P < 0.05, **P < 0.01, ***P < 0.001, by 2-tailed Student’s t test. One-way ANOVA with Dunnett’s correction was used for multiple comparisons (F and G).
Figure 2
Figure 2. Animals with adipose tissue–specific knockout of Hdac6 have decreased metabolic activity and lower insulin sensitivity.
(A) Oxygen consumption (VO2) of control and Hdac6 AKO mice monitored for 48 hours (n = 8 mice per group). (B) Respiratory exchange rate analysis according to dark and light phases. From 8pm to 8am (next day) refers to dark phases. From 8am to 8pm refers to light phases. (n = 8 mice per group). (C) Energy expenditure analysis of control and Hdac6 AKO mice monitored for 48 hours (n = 8 mice per group). (D) Protein expression of CPT1, CPT2, COX4, and cytochrome c (CytoC), which are important in mitochondrial respiration in the GWAT of control and Hdac6 AKO mice (n = 3 mice per group). (E) Protein expression of CPT1, CPT2, COX4, and cytochrome c, which are important in mitochondrial respiration in the BAT of control and Hdac6 AKO mice (n = 3 mice per group). (F) Quantitative analysis of oxygen consumption rate (OCR) of mitochondria isolated from the BAT of control and Hdac6 AKO mice using Seahorse equipment (n = 3 mice per group). (G) Lipolysis in control and Hdac6 AKO mice under fed, fasted, and isoproterenol-stimulated conditions (n = 6 mice per group). (H) Levels of GIR of control and Hdac6 AKO mice (n = 6 mice per group). (I) Levels of GDR of control and Hdac6 AKO mice (n = 6 mice per group). (J) Rate of insulin-stimulated glucose disposal (IS-GDR) of control and Hdac6 AKO mice (n = 6 mice per group). (K) Reduced serum levels of adiponectin in control and Hdac6 AKO mice (n = 6 mice per group). Data represent mean ± SEM. *P < 0.05, **P < 0.01, by 2-tailed Student’s t test.
Figure 3
Figure 3. CIDEC is deacetylated by HDAC6 and acetylated by PCAF at K56.
(A) Levels of CIDEC acetylation were increased in the GWAT of Hdac6 AKO mice. Levels of α-tubulin were used as a positive control. IgG was used as a loading control. To detect CIDEC acetylation in vivo, the GWAT tissue sample was incubated with A/G beads conjugated to antibodies against acetylated lysine, and the immunoprecipitates were blotted with antibodies against CIDEC and other LD-associated proteins (PLIN1, ADRP, TIP47). Data represent results from at least 3 independent experiments. (B) Ectopically expressed CIDEC was acetylated in the presence of TSA or when Hdac6 was knocked down. Data represent results from at least 3 independent experiments. (C) PCAF acetylates CIDEC. Flag-CIDEC was coexpressed in 293T cells with different acetyltransferases. Upper panel shows levels of CIDEC acetylation; lower panel shows levels of P53 acetylation when Flag-CIDEC and Flag-P53 were coexpressed with various acetyltransferases. Data represent results from at least 3 independent experiments. (D) HDAC6 deacetylates CIDEC. Data represent results from at least 3 independent experiments. (E) PCAF acetylates CIDEC in vitro. Bacterially isolated CIDEC-MBP was incubated with GST-PCAF containing the enzymatic domain (active) in vitro. Data represent results from at least 3 independent experiments. (F) Identification of the conserved K56 residue in difference species. (G) Ratio of acetylated CIDEC at K56 in the adipose tissue of control and Hdac6 AKO mice. (H) Characterization of anti–acetyl-K56 (AcK56) antibody. Data represent results from at least 3 independent experiments. (I) Increased levels of CIDEC protein and its acetylated form in the GWAT and the BAT of Hdac6 AKO mice. The immunoprecipitated CIDEC was normalized (n = 3 mice per group).
Figure 4
Figure 4. Acetylation of CIDEC enhances its stability.
(A) Knockdown Hdac6 increased CIDEC stability in 3T3-L1 adipocytes. Data represent mean ± SEM. Two-way repeated-measures ANOVA was used to evaluate the data; ###P < 0.001. Knockdown efficiency for Hdac6 was determined by Western blot analysis. Data represent results from at least 3 independent experiments. (B) Acetylated CIDEC is more stable. 293T cells were transfected with Flag-tagged CIDEC and treated with CHX at different time points. CIDEC protein was immunoprecipitated using antibodies against FLAG and blotted with antibody against acetylated lysine (AcK56). Data represent results from at least 3 independent experiments. (C) Stability of CIDEC and CIDEC K56R in differentiated stromal vascular fraction (SVF) adipocytes from control and Hdac6 AKO mice. Data represent results obtained from 3 experiments. (DF) Levels of CIDEC protein and acetylation were both increased in the adipose tissue of mice, monkeys, and humans. The GWAT of WT and leptin-deficient ob/ob mice; visceral fat of normal and obese rhesus monkeys; and intra-abdominal fat of normal and obese human patients were isolated and homogenated. CIDEC protein was immunoprecipitated and normalized using antibody against CIDEC and then blotted with CIDEC or AcK56 antibody (n = 3 mice, rhesus monkey, and human samples per group).
Figure 5
Figure 5. Acetylation of CIDEC enhances LD fusion activity.
(A) Knockdown of Pcaf decreased while knockdown of Hdac6 increased LD sizes in 3T3-L1 adipocytes. LDs were labeled with BODIPY 493/503 (green). Scale bars: 20 μm. The diameter of LDs was obtained from at least 200 cells. (B) Knockdown of Pcaf decreased while knockdown of Hdac6 increased total cellular TAG levels in 3T3-L1 adipocytes (n = 6 independent samples per group). (C) Higher lipid exchange activity in Hdac6-knockdown 3T3-L1 adipocytes and lower lipid exchange activity in Pcaf-knockdown adipocytes. Data represent results obtained from at least 10 pairs of LDs per group. (D) Coexpression of CIDEC with PCAF or HDAC6 affects LD sizes. Scale bars: 5 μm and 2 μm (insets). Data represent results obtained from at least 140 cells per group. (E) Overexpression of the acetylation-mimicking mutant of CIDEC (K56Q) increases LD sizes in 3T3-L1 preadipocytes. Western blots showing the protein level of CIDEC mutants. Scale bars: 5 μm and 2 μm (insets). Data represent results obtained from at least 140 cells per group. (F) Overexpression of CIDEC K56Q enhances lipid exchange rate. Data represent results obtained from at least 10 pairs of LDs per group. (G) Overexpression of CIDEC K56Q enhances LD fusion activity. Data represent results obtained from at least 11 pairs of LDs per group. Data represent mean ± SEM; *P < 0.05, **P < 0.01, ***P < 0.001, by 2-tailed Student’s t test. One-way ANOVA with Dunnett’s correction was used for multiple comparisons (B, C, F, and G).
Figure 6
Figure 6. FA induces CIDEC acetylation and dynamic association among CIDEC, PCAF, and HDAC6.
(A) FAs increase CIDEC protein levels. Data represent results from at least 3 independent experiments. (B) OA enhances the stability of endogenous CIDEC in 3T3-L1 adipocytes. Data represent results from at least 3 independent experiments. NC, negative control that without OA treatment. (C) OA-induced CIDEC acetylation was at the K56 residue (AcK56) in 3T3-L1 adipocytes. Data represent results from at least 3 independent experiments. (D) Knockdown of Pcaf abolished OA-induced CIDEC acetylation. Data represent results from at least 3 independent experiments. (E) OA-induced CIDEC acetylation was inhibited by the expression of HDAC6. Data represent results from at least 3 independent experiments. (F) Levels of CIDEC ubiquitination (Ub) were decreased in the presence of OA or TSA. Data represent results from at least 3 independent experiments. (G) Interaction among CIDEC, PCAF, HDAC6, and HDAC10 in differentiated 3T3-L1 adipocytes. Data represent results from at least 3 independent experiments. (H) OA inhibited the interaction between CIDEC and HDAC6 but stimulated the interaction between CIDEC and PCAF in the 3T3-L1 adipocytes. Data represent results from at least 3 independent experiments. (I) OA induced PCAF and CIDEC interaction in a dose-dependent manner. Data represent results from at least 3 independent experiments. (J) OA inhibited CIDEC and HDAC6 interaction in a dose-dependent manner. Data represent results from at least 3 independent experiments. (K) OA induced PCAF and CIDEC interaction but inhibited HDAC6 and CIDEC interaction. Data represent results from at least 3 independent experiments. (L) PCAF showed high binding affinity to the acetylation-defective form of CIDEC. Data represent results from at least 3 independent experiments. (M) HDAC6 had high affinity to the acetylation-mimicking form CIDEC. Data represent results from at least 3 independent experiments.
Figure 7
Figure 7. FA conversion into TAG in the ER is vital for it to induce CIDEC acetylation.
(A) FA-induced CIDEC acetylation and the dynamic interaction among CIDEC, PCAF, and HDAC6 were disrupted by the depletion of Fabp4. Data represent results from 3 independent experiments. (B) FA-induced CIDEC acetylation and HDAC6, PCAF dynamic interaction with CIDEC was depended on DGAT activity. Data represent results from 3 independent experiments. (C) Levels of CIDEC protein and its acetylation were decreased in the GWAT of lipin 1–deficient mice (Lpin1 KO) (n = 4 mice per group). (D) HDAC6 is recruited to the ER in the presence of CIDEC and dissociated from ER in the presence of OA. Data represent results from at least 3 independent experiments. (E) The ER is the site of subcellular localization of FA-induced dynamic association among CIDEC, PCAF, and HDAC6. Data represent results from at least 3 independent experiments. (F) The ER is the site for OA-induced CIDEC acetylation and the dynamic interaction among CIDEC, PCAF, and HDAC6 in 3T3-L1 adipocytes. Data represent results from at least 3 independent experiments. (G) Representative images showing the colocalization of HDAC6 (red) and CIDEC (green) in the presence of OA. Scale bars: 5 μm and 2 μm (insets). Data represent results from at least 5 independent experiments. (H) Model depicting the role of HDAC6 in mediating FA-induced CIDEC acetylation and obesity development in adipocytes. When extracellular levels of FAs are low, CIDEC is associated with HDAC6, resulting in its lower acetylation and rapid degradation. In the presence of high levels of FAs, HDAC6 is dissociated from CIDEC, resulting in the association between CIDEC and PCAF and increased CIDEC acetylation. Acetylated CIDEC is mobilized to LD to promote fusion and lipid storage.

Similar articles

Cited by

References

    1. Guan KL, Xiong Y. Regulation of intermediary metabolism by protein acetylation. Trends Biochem Sci. 2011;36(2):108–116. doi: 10.1016/j.tibs.2010.09.003. - DOI - PMC - PubMed
    1. Chuderland D, Konson A, Seger R. Identification and characterization of a general nuclear translocation signal in signaling proteins. Mol Cell. 2008;31(6):850–861. doi: 10.1016/j.molcel.2008.08.007. - DOI - PubMed
    1. Xu W, Li Y, Liu C, Zhao S. Protein lysine acetylation guards metabolic homeostasis to fight against cancer. Oncogene. 2014;33(18):2279–2285. doi: 10.1038/onc.2013.163. - DOI - PubMed
    1. Brooks CL, Gu W. Ubiquitination, phosphorylation and acetylation: the molecular basis for p53 regulation. Curr Opin Cell Biol. 2003;15(2):164–171. doi: 10.1016/S0955-0674(03)00003-6. - DOI - PubMed
    1. Guarente L. The logic linking protein acetylation and metabolism. Cell Metab. 2011;14(2):151–153. doi: 10.1016/j.cmet.2011.07.007. - DOI - PubMed

MeSH terms