. 2017 Mar 11;18(3):613.
doi: 10.3390/ijms18030613.

Strawberry-Tree Honey Induces Growth Inhibition of Human Colon Cancer Cells and Increases ROS Generation: A Comparison with Manuka Honey

Affiliations

Strawberry-Tree Honey Induces Growth Inhibition of Human Colon Cancer Cells and Increases ROS Generation: A Comparison with Manuka Honey

Sadia Afrin et al. Int J Mol Sci. .

Abstract

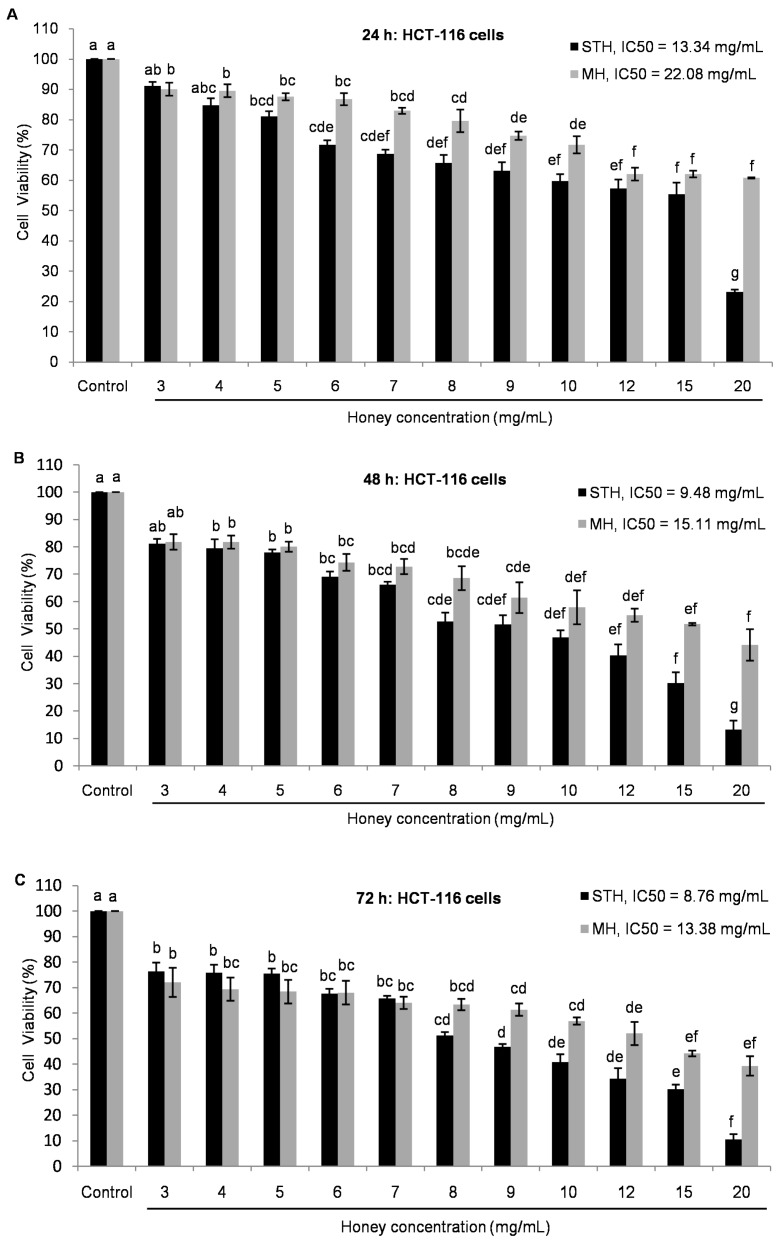
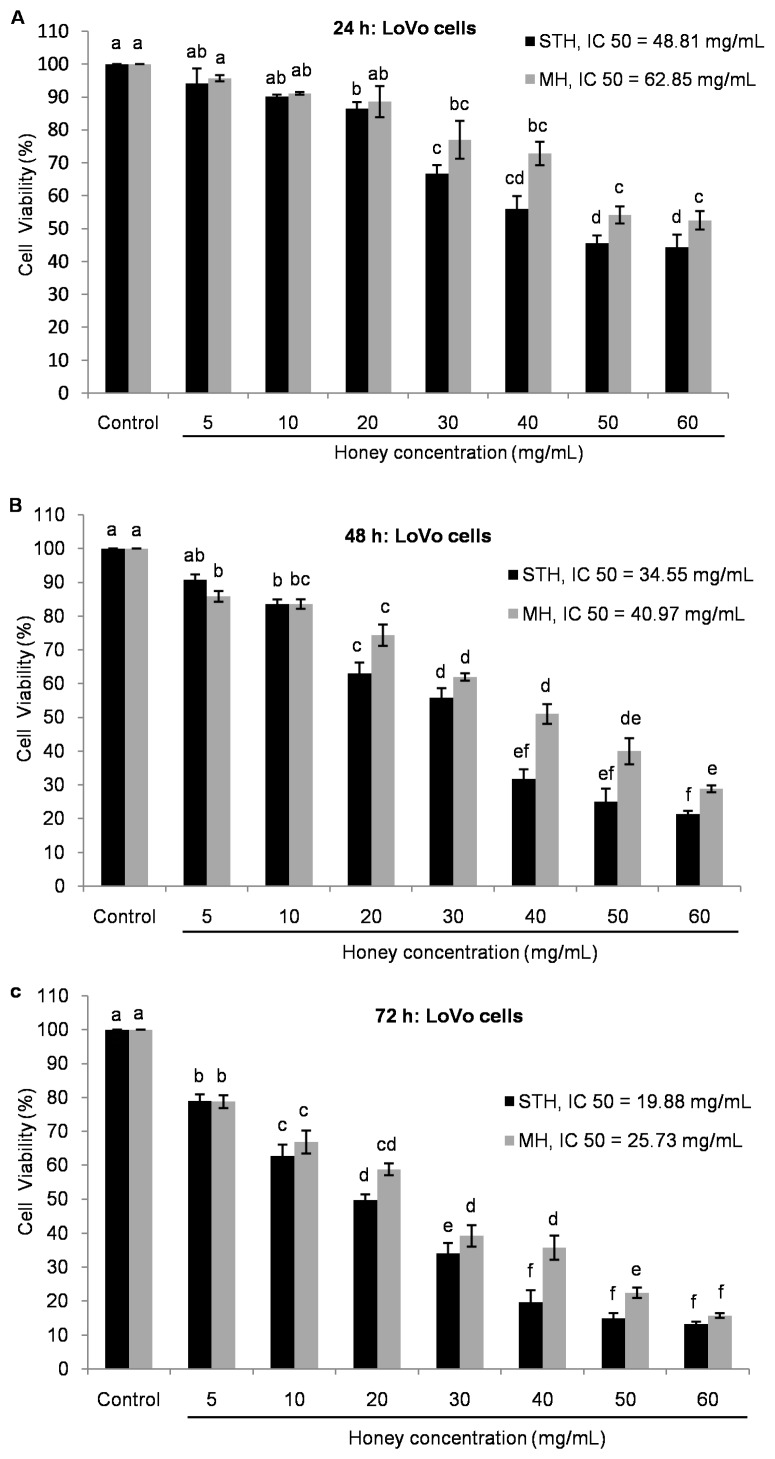
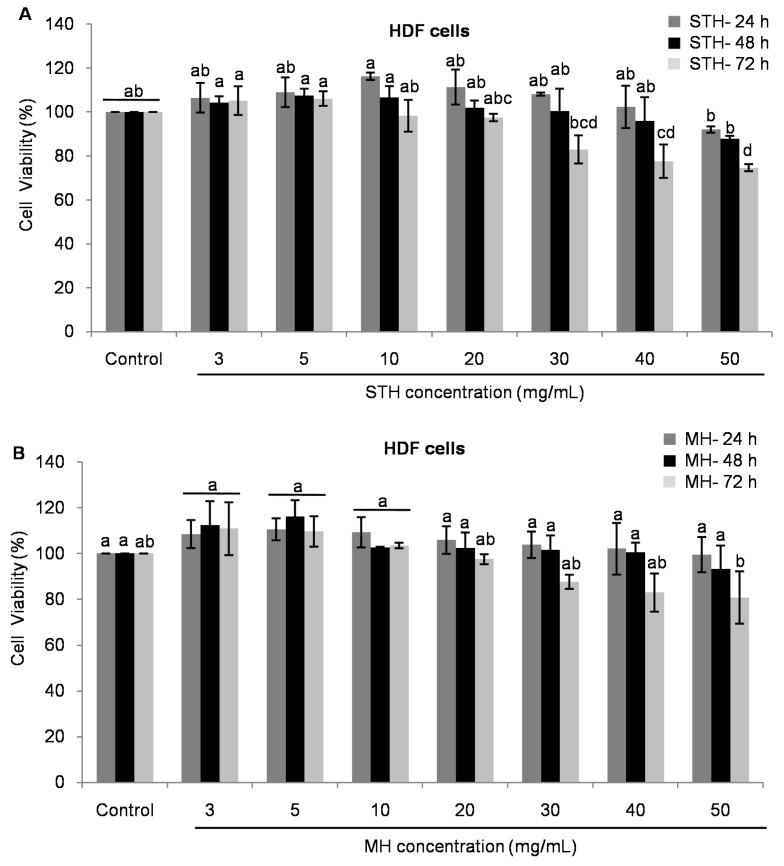
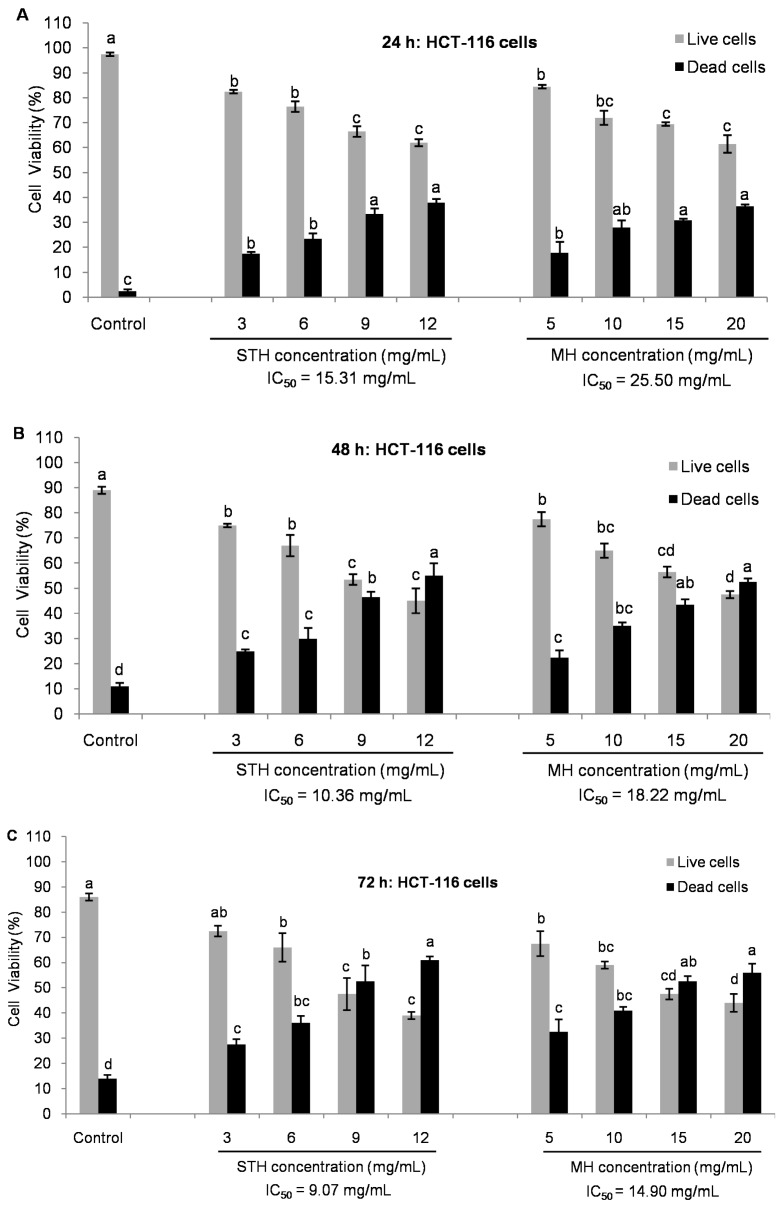
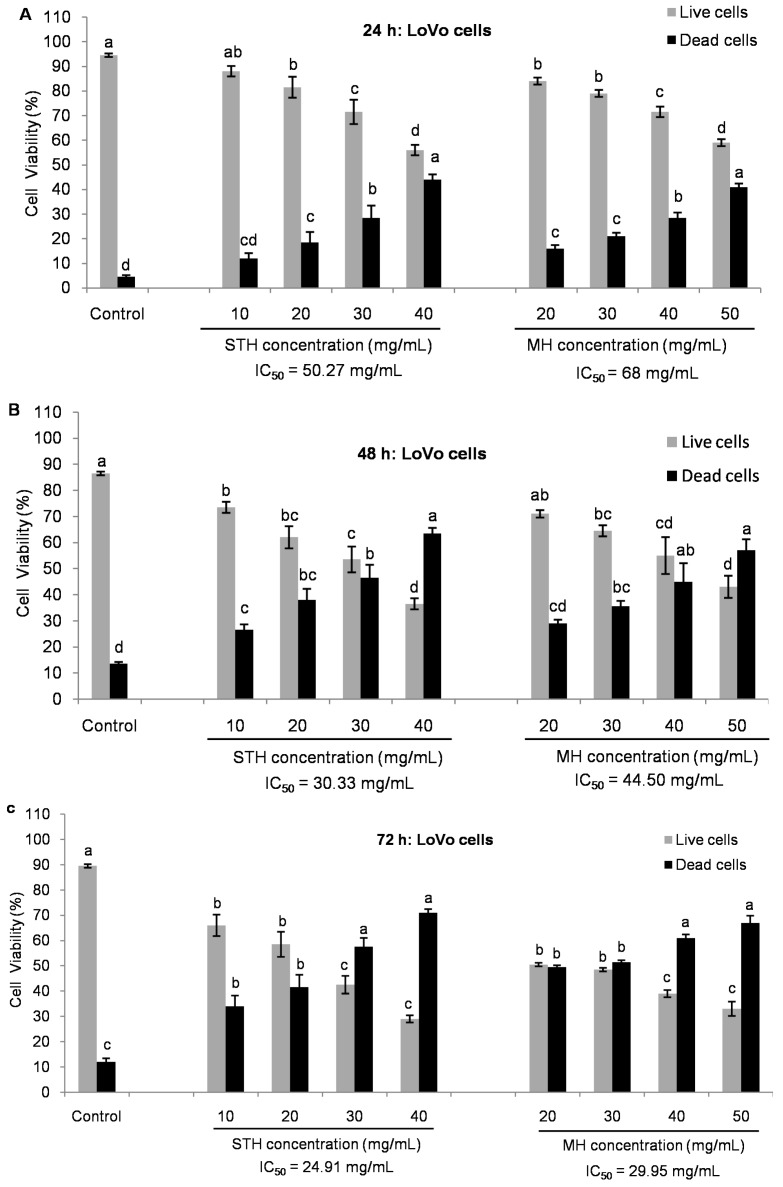
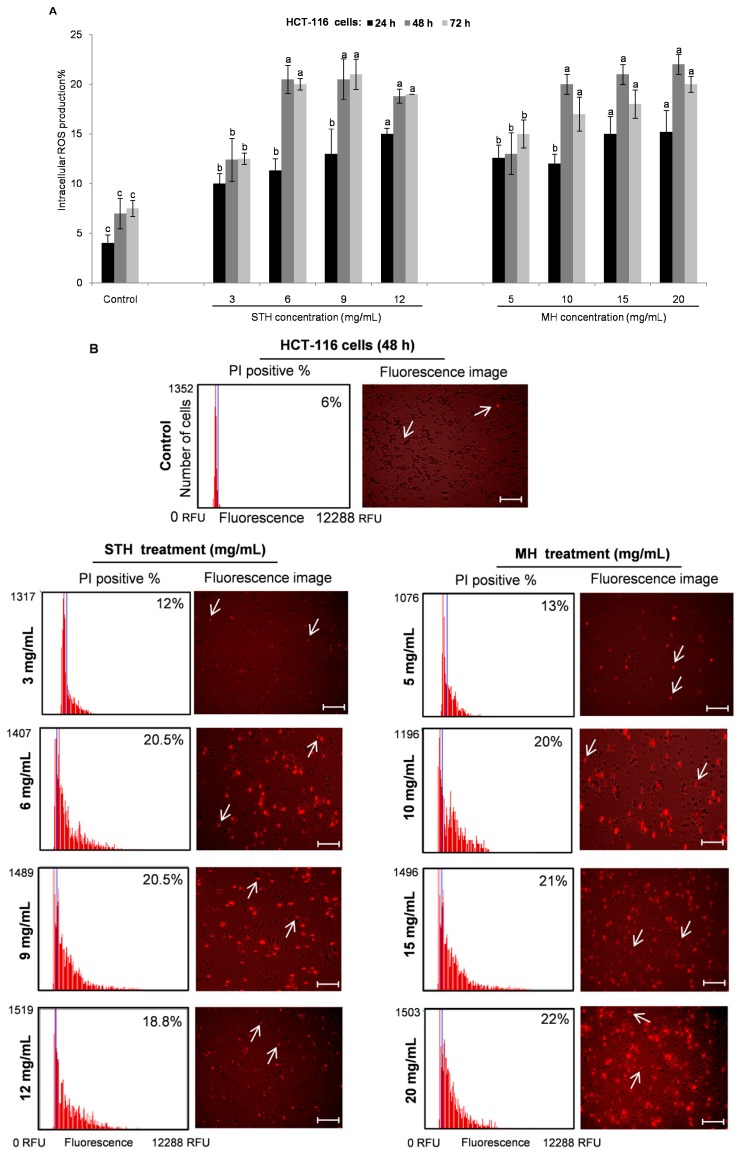
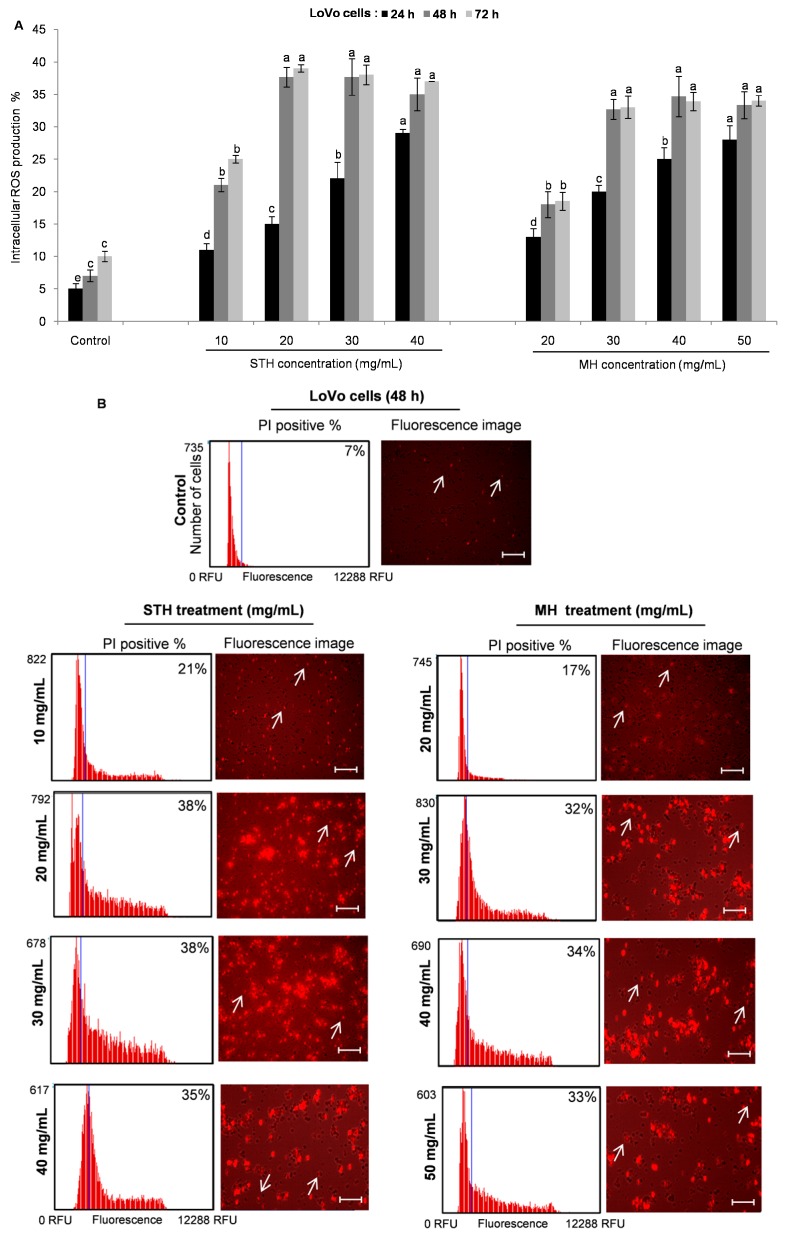
Honey is a natural product known to modulate several biological activities including cancer. The aim of the present study was to examine the phytochemical content and the antioxidant activity of Strawberry tree (Arbutus unedo) honey (STH) and its cytotoxic properties against human colon adenocarcinoma (HCT-116) and metastatic (LoVo) cell lines in comparison with Manuka (Leptospermum scoparium) honey (MH). Several unifloral STH and MH were analyzed for their phenolic, flavonoid, amino acid and protein contents, as well as their radical scavenging activities. STH from the Berchidda area showed the highest amount of phenolic, flavonoid, amino acid and protein content, and antioxidant capacity compared to MH. Both STH and MH induced cytotoxicity and cell death in a dose- and time-dependent manner in HCT-116 and LoVo cells, with less toxicity on non-cancer cells. Compared to MH, STH showed more effect at lower concentrations on HCT-116 and LoVo cells. In addition, both honeys increased intracellular reactive oxygen species (ROS) generation. In HCT-116 cells, STH and MH induced similar ROS production but in LoVo cells STH induced a higher percentage of ROS compared to MH. Our results indicate that STH and MH can induce cell growth inhibition and ROS generation in colon adenocarcinoma and metastatic cells, which could be due to the presence of phytochemicals with antioxidant properties. These preliminary results are interesting and suggest a potential chemopreventive action which could be useful for further studies in order to develop chemopreventive agents for colon cancer.

Keywords: Manuka honey; antioxidant activity; colon cancer; cytotoxicity; polyphenols; reactive oxygen species; strawberry tree honey.


Conflict of interest statement

The authors declare no conflicts of interest.

Figures

Figure 1
Figure 1
Inhibition of cell proliferation by strawberry tree honey (STH) and Manuka honey (MH) in HCT-116 cell lines (AC). After 24 h of cell seeding, HCT-116 were treated with different concentrations of both honeys (0–20 mg/mL) for 24, 48 and 72 h. Cell viability was measured by using 3-(4,5-dimethylthiazol-2-yl)-2,5-diphenyltetrazolium bromide (MTT) assay and results were expressed as a percentage (%) of viable cells compared to control cells. Data are shown as the mean ± SD of three experiments. Different superscripts letter for each column indicated significant differences (p < 0.05).
Figure 2
Figure 2
Inhibition of cell proliferation by STH and MH in LoVo cell lines (AC). After 24 h of cell seeding, LoVo were treated with different concentrations of both honeys (0–60 mg/mL) for 24, 48 and 72 h. Cell viability was measured by using MTT assay and results were expressed as a percentage (%) of viable cells compared to control cells. Data are shown as the mean ± SD of three experiments. Different superscripts letter for each column indicated significant differences (p < 0.05).
Figure 3
Figure 3
Effects of STH and MH on cell viability of HDF cells (A,B). After 24 h of cell seeding, HDF were treated with different concentrations of both honeys (0–50 mg/mL) for 24, 48 and 72 h. Cell viability was measured by using MTT assay and results were expressed as a percentage (%) of viable cells compared to control cells. Data are shown as the mean ± SD of three experiments. Different superscripts letter for each column indicated significant differences (p < 0.05).
Figure 4
Figure 4
Comparison of viability in cell populations between STH and MH in HCT-116 cells by Tali™ Image-Based Cytometer (AC). After 24 h of cell seeding, HCT-116 cells were treated with STH (0, 3, 6, 9 and 12 mg/mL) and MH (0, 5, 10, 15 and 20 mg/mL) for 24, 48 and 72 h at which time approximately 80% to 40% cells were alive. Cell viability was measured by using Tali™ Viability Kit assay and results were expressed as a percentage (%) of live and dead cells. Data are shown as the mean ± SD of three experiments. Different superscripts letter for each column indicated significant differences (p < 0.05).
Figure 5
Figure 5
Comparison of viability in cell populations between STH and MH in LoVo cells by Tali™ Image-Based Cytometer (AC). After 24 h of cell seeding, LoVo cells were treated with STH (0, 10, 20, 30 and 40 mg/mL) and MH (0, 20, 30, 40 and 50 mg/mL) for 24, 48 and 72 h at which approximately 80% to 30% cells were alive. Cell viability was measured by using Tali™ Viability Kit assay and results were expressed as a percentage (%) of live and dead cells. Data are shown as the mean ± SD of three experiments. Different superscripts letter for each column indicated significant differences (p < 0.05).
Figure 6
Figure 6
STH and MH induce ROS generation in HCT-116 cells. HCT-116 cells were treated with or without different concentrations of STH (0, 3, 6, 9 and 12 mg/mL) and MH (0, 5, 10, 15 and 20 mg/mL)for 24, 48 and 72 h. Intracellular ROS levels were calculated by using CellROX® Orange assay kit and the Tali™ Image-based Cytometer (A). Image-Based cytometry was used to quantify ROS induction (% of propidium iodide (PI) positive) in HCT-116 cells following STH and MH treatment at 48 h (B). The blue line of the thumbnail histogram indicated the set threshold. Representative fluorescence image of HCT-116 cells shows the effect of STH and MH treatment at 48 h: non-fluorescent while in a reduced state and bright red fluorescence upon oxidation by ROS. Scale bar = 50 µm, arrows indicate single cell (cell size = 10 µm). Data are shown as the mean ± SD of three experiments. Columns associated with the same set of data with different symbolic letters are significantly different (p < 0.05) from controls.
Figure 7
Figure 7
STH and MH induce ROS generation in LoVo cells. LoVo cells were treated with or without different concentrations of STH (0, 10, 20, 30 and 40 mg/mL) and MH (0, 20, 30, 40 and 50 mg/mL) for 24, 48 and 72 h. Intracellular ROS levels were calculated by using CellROX® Orange assay kit and the Tali™ Image-based Cytometer (A). Image-Based cytometry was used to quantify ROS induction (% of PI positive) in LoVo cells following STH and MH (B) treatment at 48 h. The blue line of the thumbnail histogram indicated the set threshold. Representative fluorescence image of LoVo cells shows the effect of STH and MH treatment: non-fluorescent while in a reduced state and bright red fluorescence upon oxidation by ROS. Scale bar = 50 µm, arrows indicate single cell (cell size = 10 µm). Data are shown as the mean ± SD of three experiments. Columns associated with the same set of data with different symbolic letters are significantly different (p < 0.05) from controls.

References

    1. Ferlay J., Soerjomataram I., Dikshit R., Eser S., Mathers C., Rebelo M., Parkin D.M., Forman D., Bray F. Cancer incidence and mortality worldwide: Sources, methods and major patterns in globocan 2012. Int. J. Cancer. 2015;136:359–386. doi: 10.1002/ijc.29210. - DOI - PubMed
    1. Tenesa A., Dunlop M.G. New insights into the aetiology of colorectal cancer from genome-wide association studies. Nat. Rev. Genet. 2009;10:353–358. doi: 10.1038/nrg2574. - DOI - PubMed
    1. Dahan L., Sadok A., Formento J.-L., Seitz J.F., Kovacic H. Modulation of cellular redox state underlies antagonism between oxaliplatin and cetuximab in human colorectal cancer cell lines. Br. J. Pharmacol. 2009;158:610–620. doi: 10.1111/j.1476-5381.2009.00341.x. - DOI - PMC - PubMed
    1. Afrin S., Giampieri F., Gasparrini M., Forbes-Hernandez T.Y., Varela-López A., Quiles J.L., Mezzetti B., Battino M. Chemopreventive and therapeutic effects of edible berries: A focus on colon cancer prevention and treatment. Molecules. 2016;21:169. doi: 10.3390/molecules21020169. - DOI - PMC - PubMed
    1. Ruiz R.B., Hernández P.S. Cancer chemoprevention by dietary phytochemicals: Epidemiological evidence. Maturitas. 2016;94:13–19. doi: 10.1016/j.maturitas.2016.08.004. - DOI - PubMed

LinkOut - more resources