. 2017 Mar 13:7:38837.
doi: 10.1038/srep38837.

Multivariate simulation framework reveals performance of multi-trait GWAS methods

Affiliations

Multivariate simulation framework reveals performance of multi-trait GWAS methods

Heather F Porter et al. Sci Rep. .

Abstract

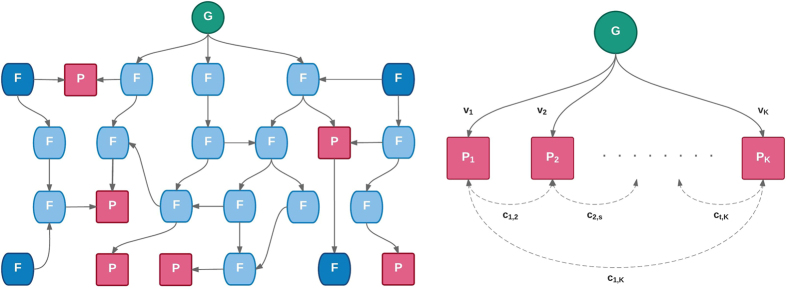
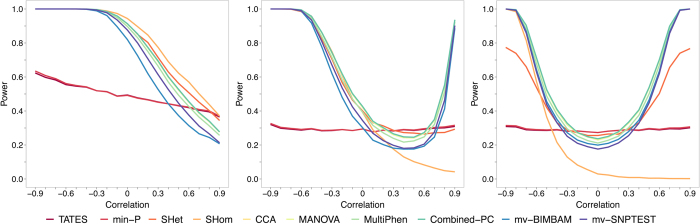
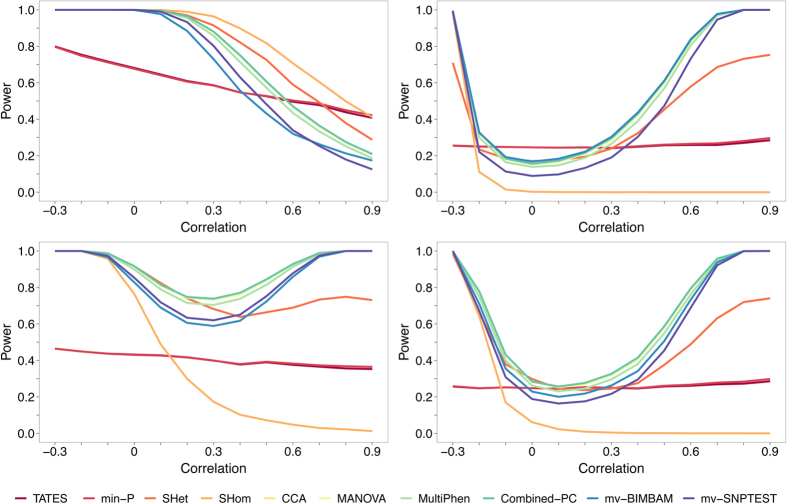
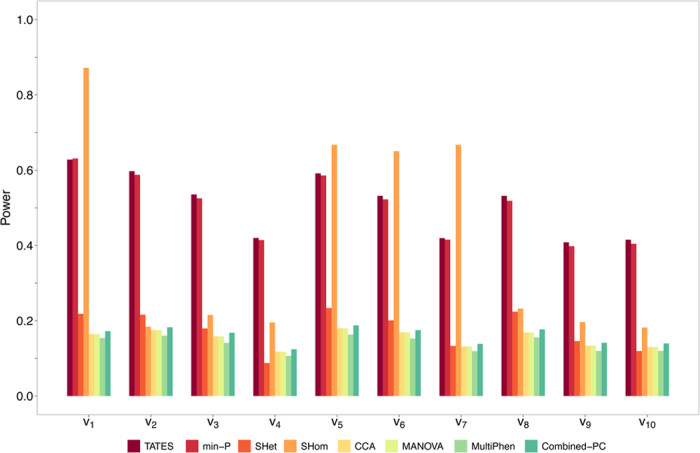
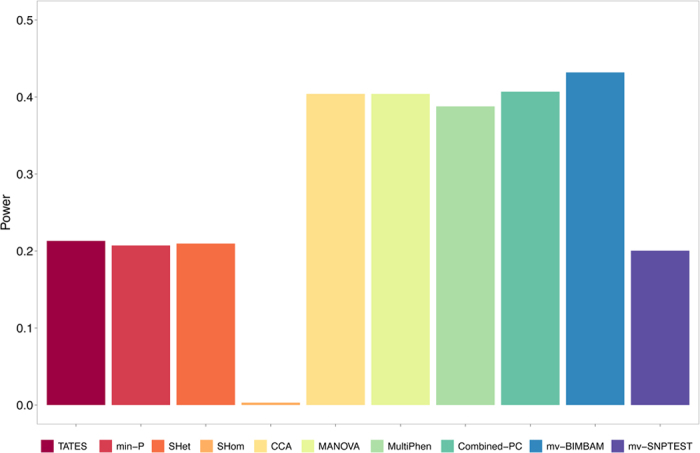
Burgeoning availability of genome-wide association study (GWAS) results and national biobank data has led to growing interest in performing multi-trait genetic analyses. Numerous multi-trait GWAS methods that exploit either summary statistics or individual-level data have been developed, but their relative performance is unclear. Here we develop a simulation framework to model the complex networks underlying multivariate genetic epidemiology, enabling the vast model space of genetic effects on multiple correlated traits to be explored systematically. We perform a comprehensive comparison of the leading multi-trait GWAS methods, finding: (1) method performance is highly sensitive to the specific combination of genetic effects and phenotypic correlations, (2) most of the current multivariate methods have remarkably similar statistical power, and (3) multivariate methods may offer a substantial increase in the discovery of genetic variants over the standard univariate approach. We believe our findings offer the clearest picture to date of the relative performance of multi-trait GWAS methods and act as a guide for method selection. We provide a web application and open-source software program implementing our simulation framework, for: (i) further benchmarking of multivariate GWAS methods, (ii) power calculations for multivariate genetic studies, and (iii) generating data for testing any multivariate method in genetic epidemiology.


Conflict of interest statement

The authors declare no competing financial interests.

Figures

Figure 1
Figure 1. Modelling of multivariate biological network.
(a) A biological network illustrating a genetic variant (G) influencing a set of biological entities, such as enzymes, metabolites and disease outcomes. Most are unmeasured internal (light blue) or external (dark blue) factors (F), but a subset corresponds to measured phenotypes to be tested (P). (b) With no loss in generality, observed phenotype data from a biological network such as that represented in (a) (assuming no indirect genetic effects on observed phenotypes via other observed phenotypes) can be depicted and parameterised by v and c as shown. Values of v and c differ from their marginal values when observed risk factors are controlled for.
Figure 2
Figure 2. Power of methods under simulation of scenario 1 with two traits.
(a) The genetic variant explains 0.5% variance in two traits (v1). (b) The genetic variant explains 0.5% variance in one trait and 0.1% in the other (v2). (c) The genetic variant explains 0.5% variance in one trait and has no effect on the other (v3).
Figure 3
Figure 3. Power of methods under simulation of scenario 1 with four traits.
Power comparisons from simulations of scenario 1 (S1), based on (a) v1, (b) v4, (c) v8 and (d) v10 (see Table 2) applied to data on 4 phenotypes. For all scenario 1 (S1) results the correlations between all phenotypes are the same. Correlations <−0.3 are not possible across 4 phenotypes, hence the truncation in these – and subsequent - results across the correlation range. Full results for scenario 1 (S1) are shown in Supplementary Figures 1–4.
Figure 4
Figure 4. Power of methods under simulation of scenario 3 with 20 traits.
Power comparisons for all simulations of scenario 3 (S3) involving 20 phenotypes. In this scenario the phenotypic correlations are chosen to reflect the relative genetic effect sizes defined by the 10 genetic effect vectors (see Table 2 and description under S3 sub-heading of main text). mv-BIMBAM was not computationally feasible, and mv-SNPTEST not hard-coded, for 20 or more phenotypes and so were excluded here. All other results for scenario 3 (S3) are shown in Supplementary Figure 10.
Figure 5
Figure 5. Power of methods in real data informed simulations with 12 traits.
Power comparisons for the real data informed simulations of scenario 4b (S4b) involving 12 phenotypes. In this scenario both genetic effects and corresponding phenotypic correlations are drawn directly from real data on the same set of traits. All other results for this scenario are shown in Supplementary Figure 13.

References

    1. Burton P. R. et al.. Genome-wide association study of 14,000 cases of seven common diseases and 3,000 shared controls. Nature 447, 661–678 (2007). - PMC - PubMed
    1. The International Consortium for Blood Pressure. Genetic variants in novel pathways influence blood pressure and cardiovascular disease risk. Nature 478, 103–109 (2011). - PMC - PubMed
    1. Teslovich T. M. et al.. Biological, clinical and population relevance of 95 loci for blood lipids. Nature 466, 707–713 (2010). - PMC - PubMed
    1. Bulik-Sullivan B. et al.. An atlas of genetic correlations across human diseases and traits. Nat. Genet. 47, 1236–1241 (2015). - PMC - PubMed
    1. Kauwe J. S. K. et al.. Genome-Wide Association Study of CSF Levels of 59 Alzheimer’s Disease Candidate Proteins: Significant Associations with Proteins Involved in Amyloid Processing and Inflammation. PLoS Genet 10, e1004758 (2014). - PMC - PubMed

Publication types

MeSH terms

LinkOut - more resources