Review
. 2017 Mar-Apr;37(2):462-483.
doi: 10.1148/rg.2017160157.

Soft-Tissue Sarcomas of the Abdomen and Pelvis: Radiologic-Pathologic Features, Part 1-Common Sarcomas: From the Radiologic Pathology Archives

Affiliations
Review

Soft-Tissue Sarcomas of the Abdomen and Pelvis: Radiologic-Pathologic Features, Part 1-Common Sarcomas: From the Radiologic Pathology Archives

Angela D Levy et al. Radiographics. 2017 Mar-Apr.

Abstract

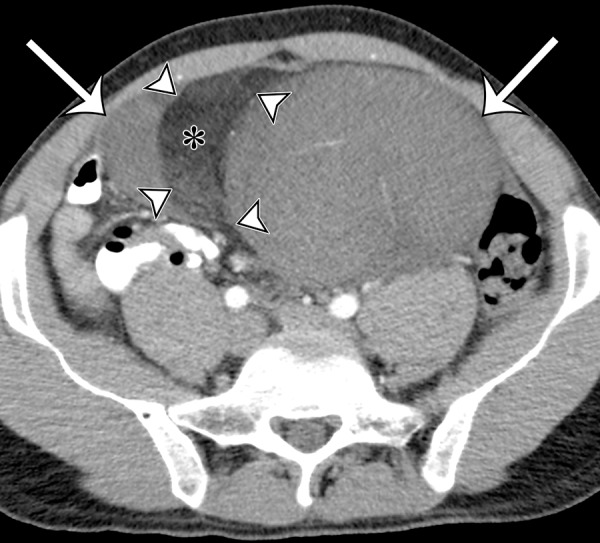
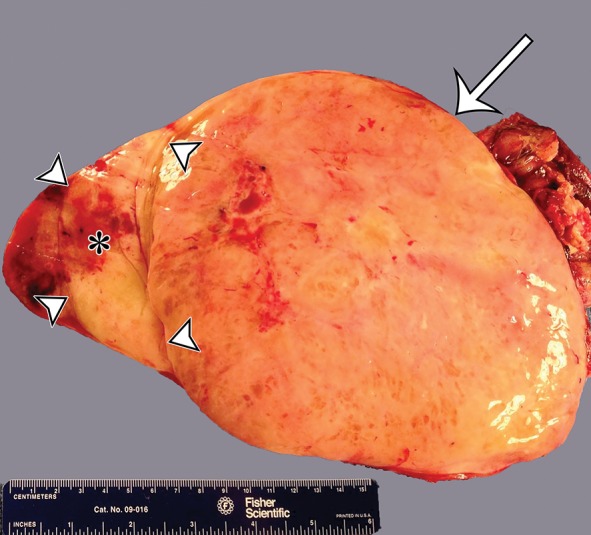
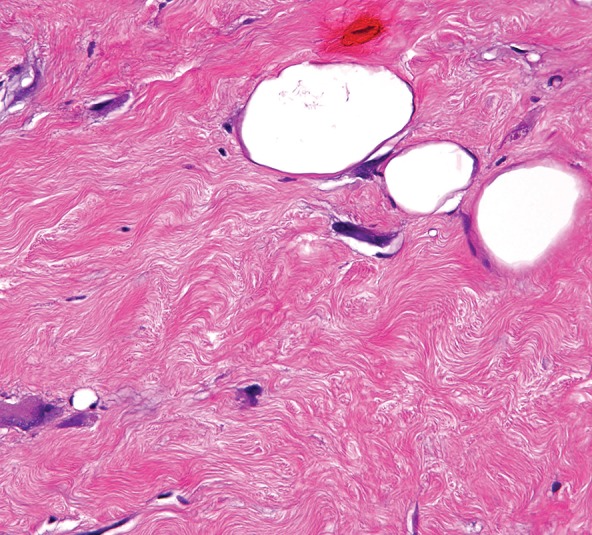
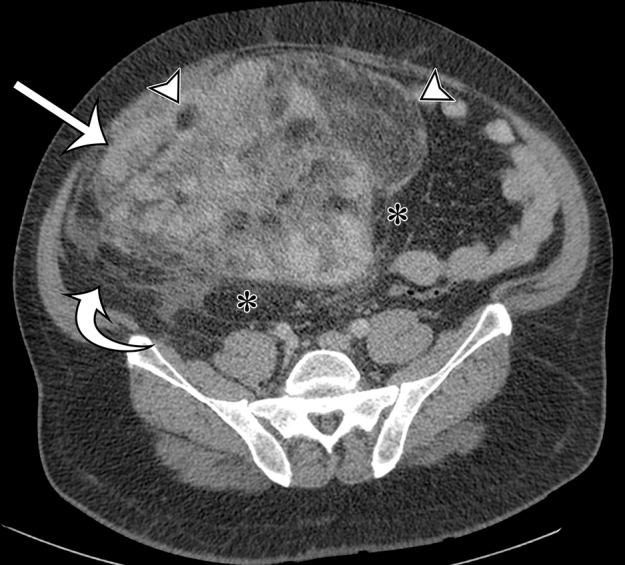
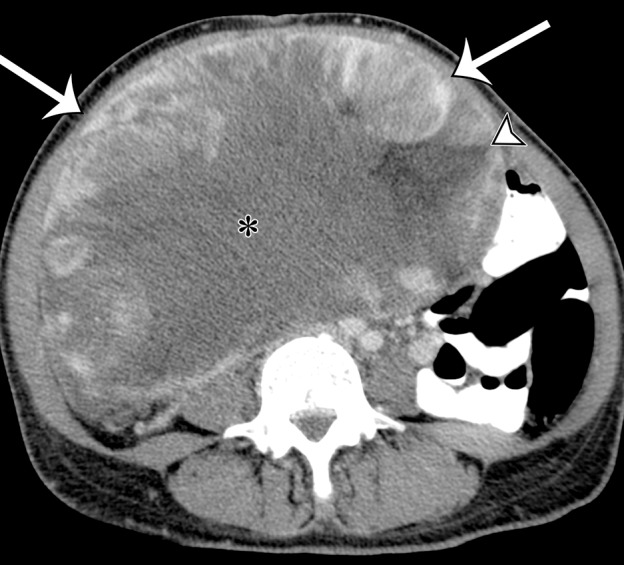
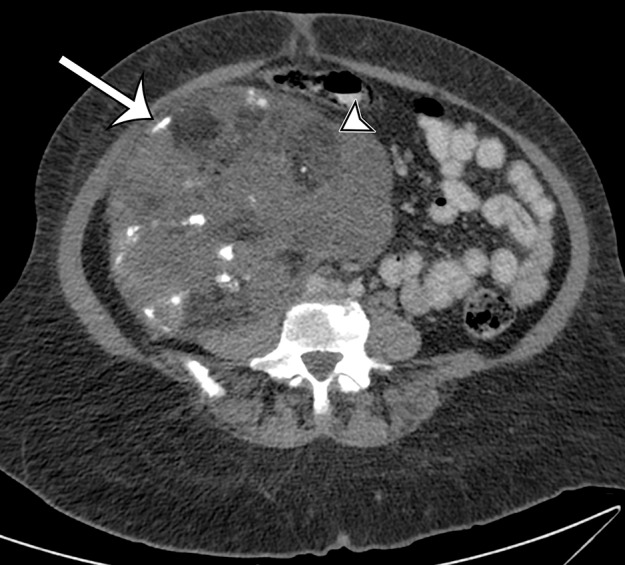
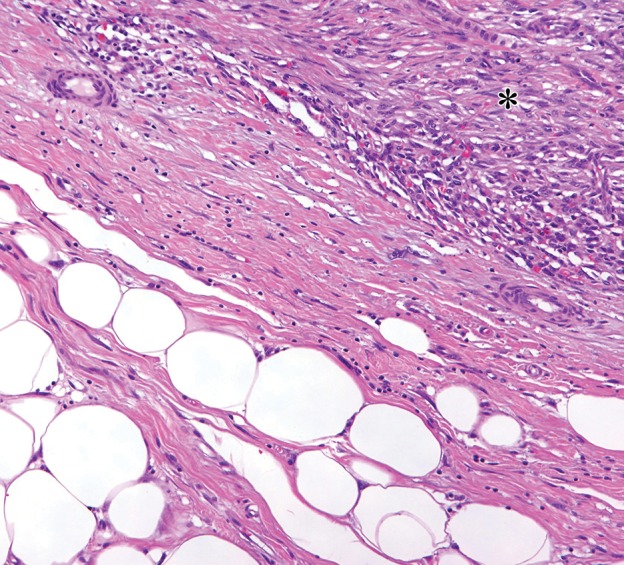
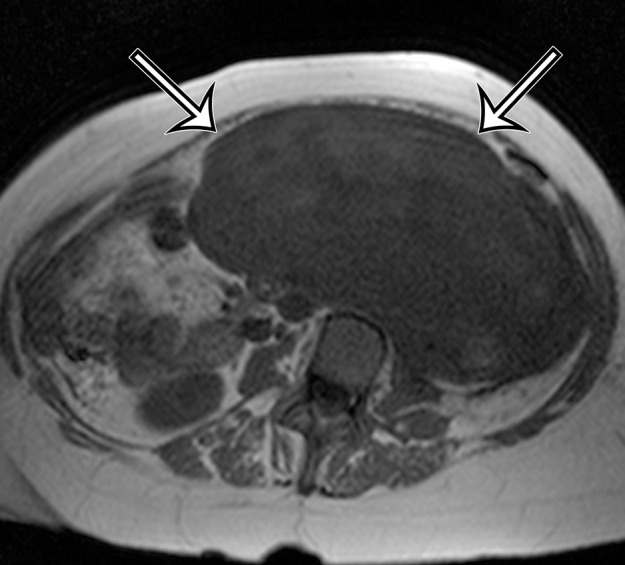
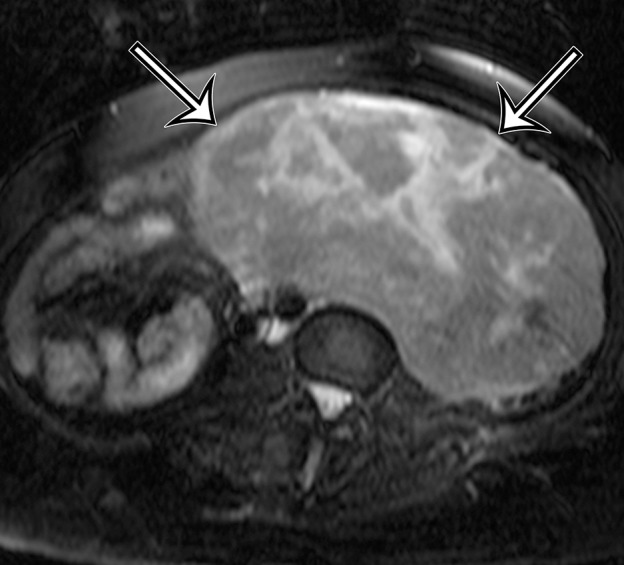
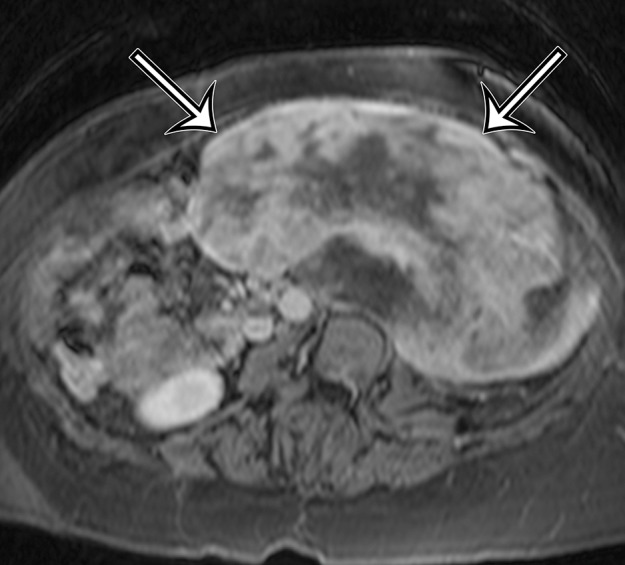
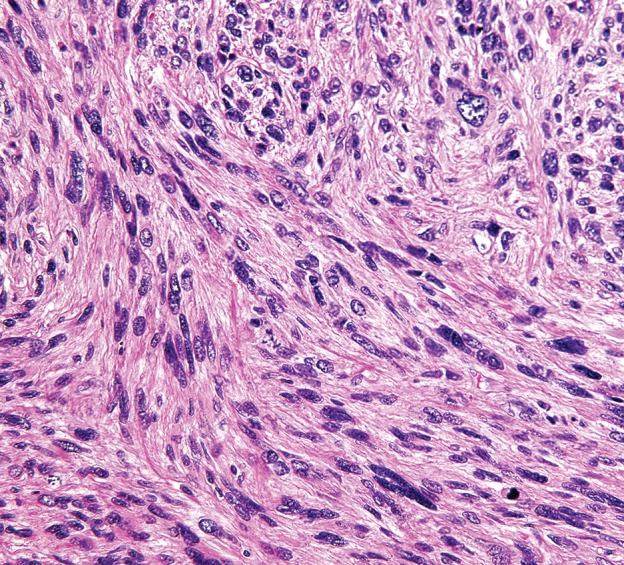
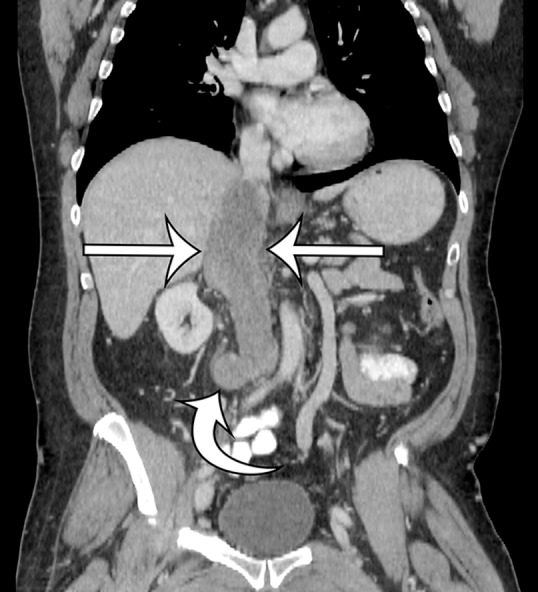
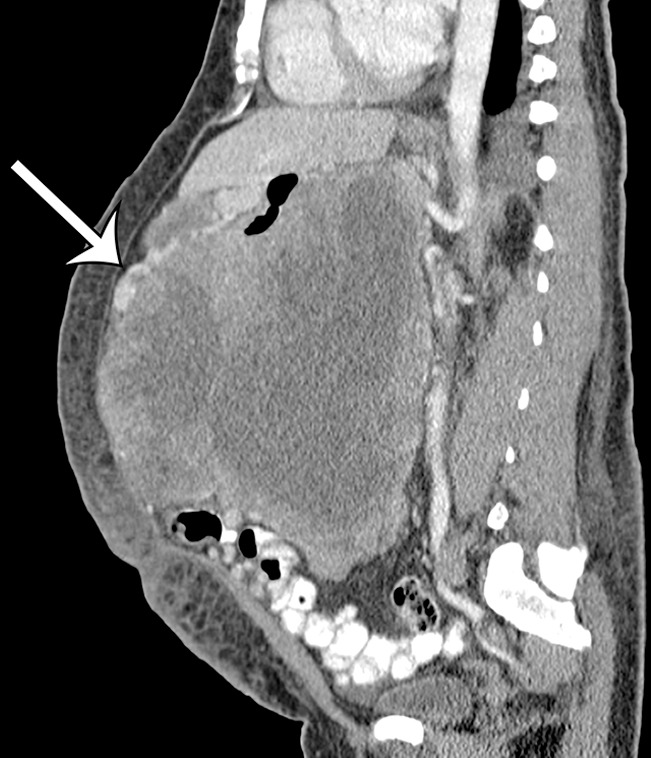
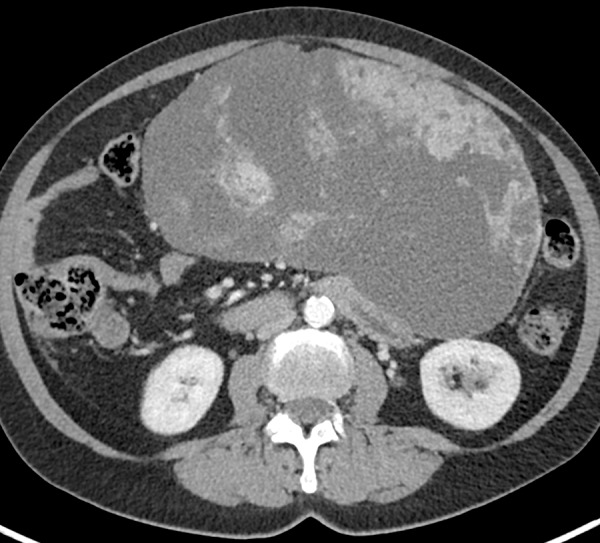
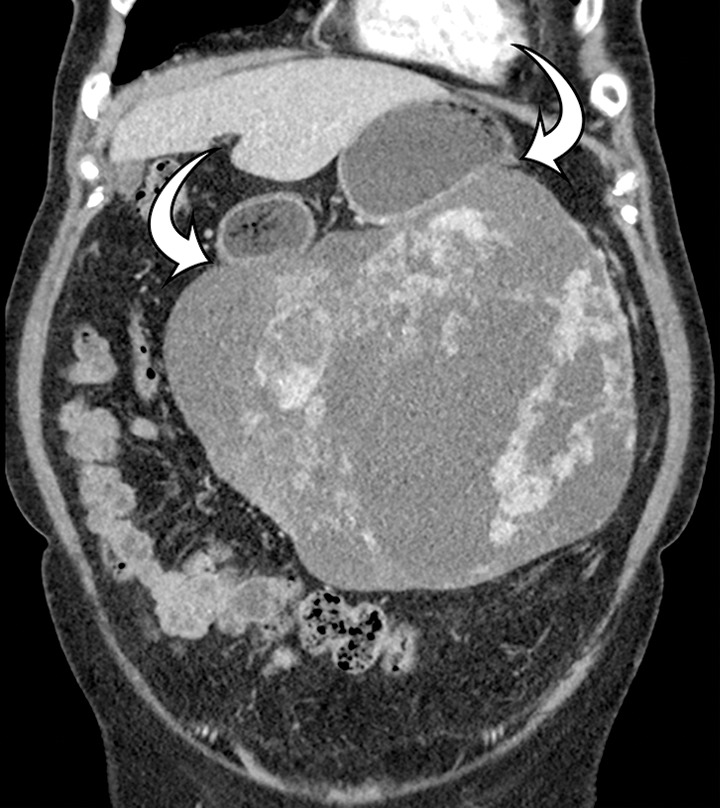
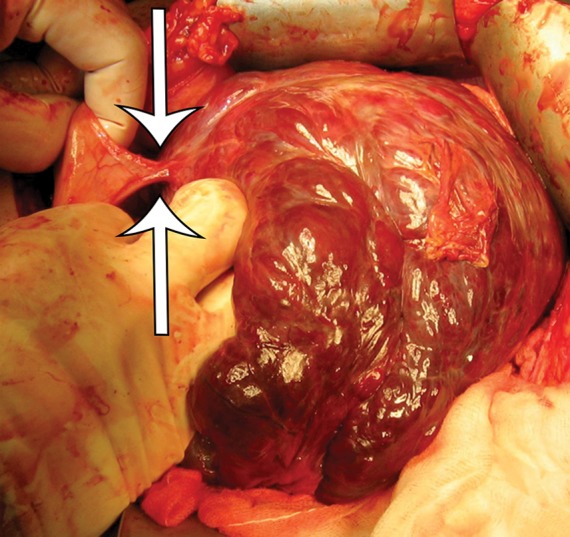
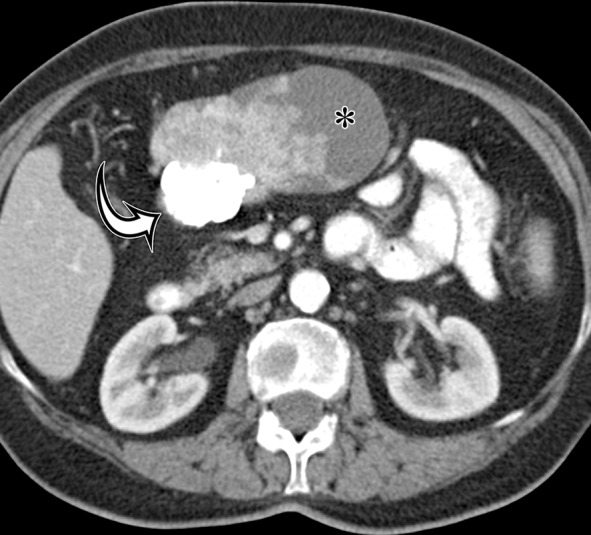
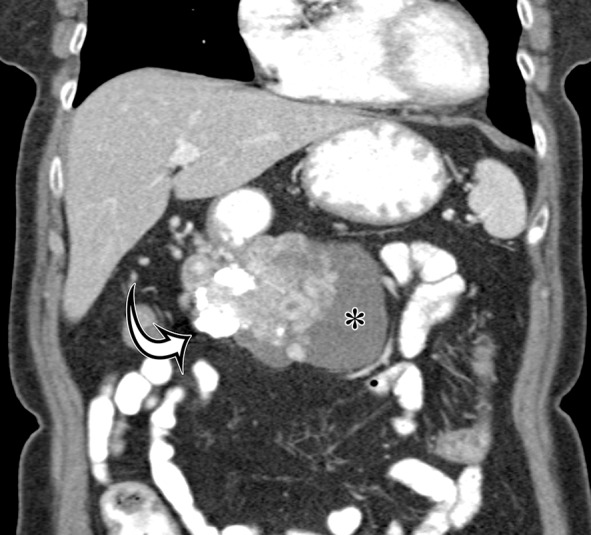
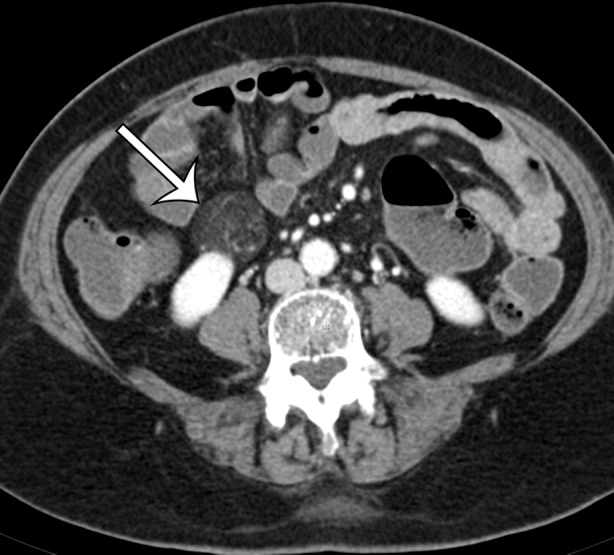
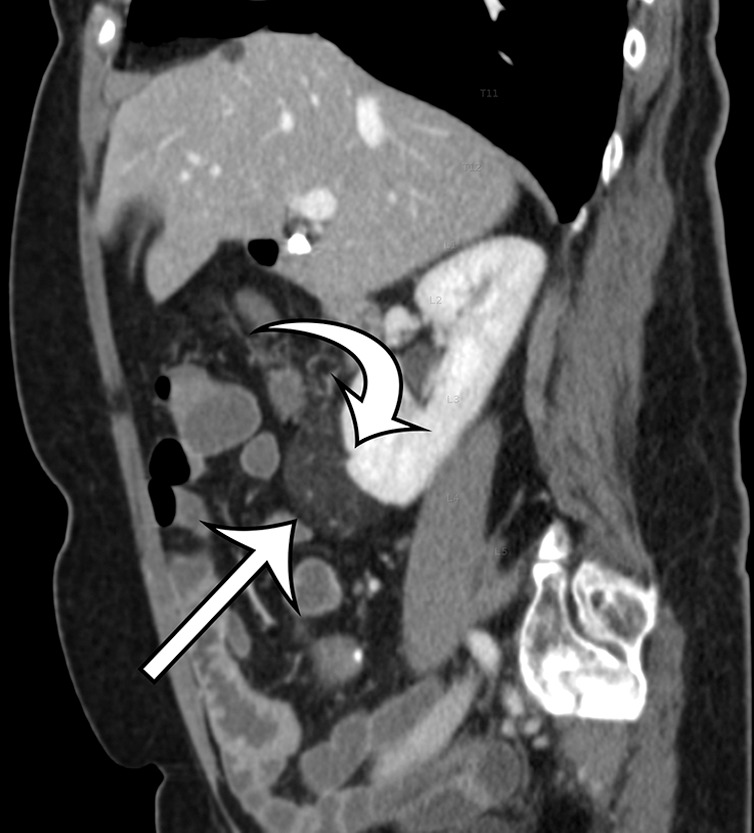
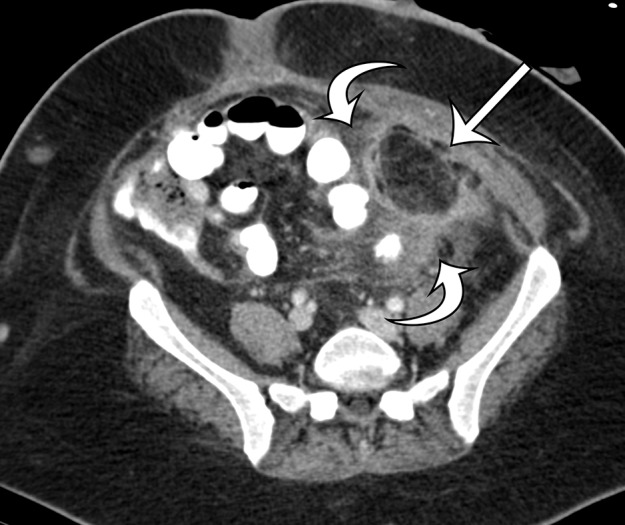
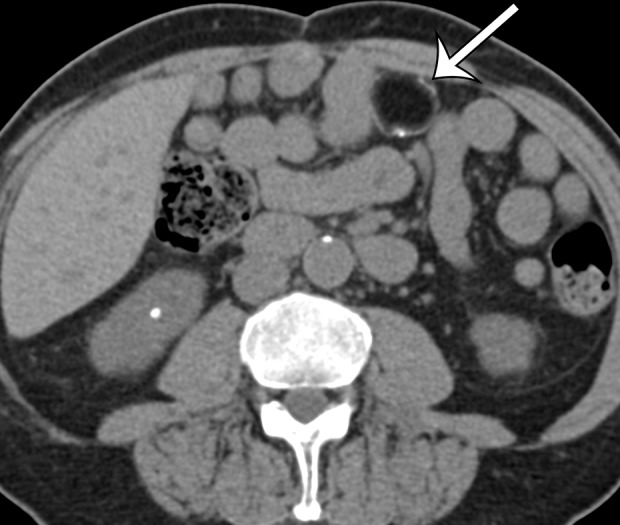
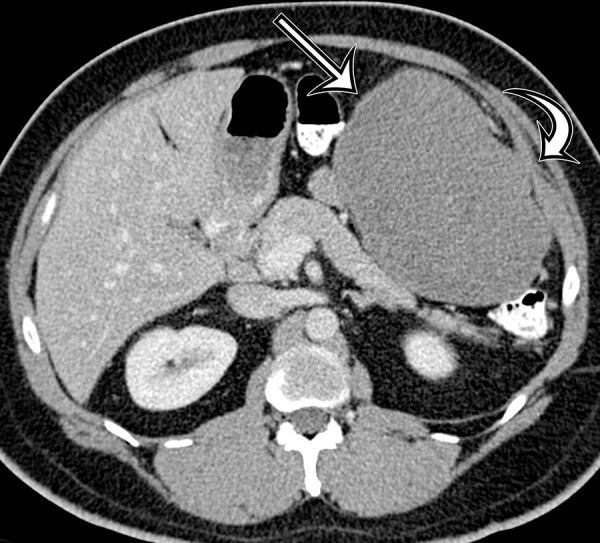
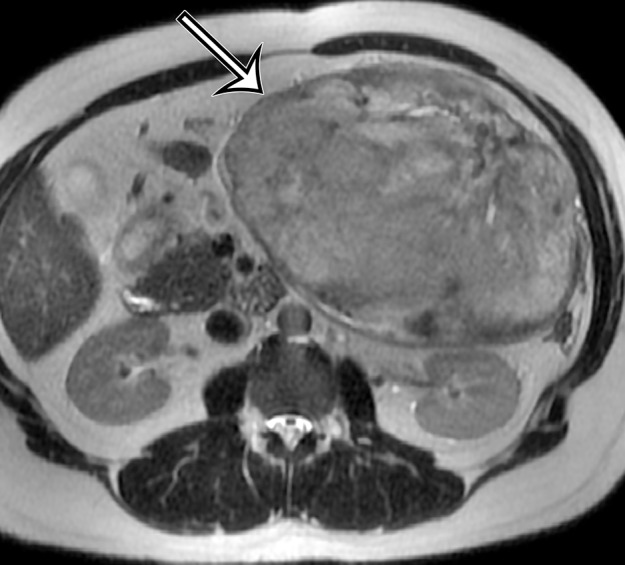
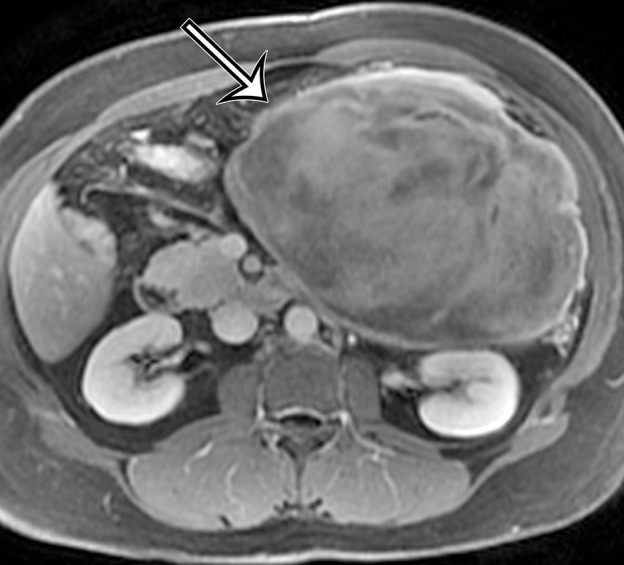
Soft-tissue sarcomas are a diverse group of rare mesenchymal malignancies that can arise at any location in the body and affect all age groups. These sarcomas are most common in the extremities, trunk wall, retroperitoneum, and head and neck. In the adult population, soft-tissue sarcomas arising in the abdomen and pelvis are often large masses at the time of diagnosis because they are usually clinically silent or cause vague or mild symptoms until they invade or compress vital organs. In contrast, soft-tissue sarcomas arising from the abdominal wall come to clinical attention earlier in the course of disease because they cause a palpable mass, abdominal wall deformity, or pain that is more clinically apparent. The imaging features of abdominal and pelvic sarcomas and abdominal wall sarcomas can be nonspecific and overlap with more common pathologic conditions, making diagnosis difficult or, in some cases, delaying diagnosis. Liposarcoma (well-differentiated and dedifferentiated liposarcomas), leiomyosarcoma, and gastrointestinal stromal tumor (GIST) are the most common intra-abdominal primary sarcomas. Any soft-tissue sarcoma can arise in the abdominal wall. Knowledge of the classification and pathologic features of soft-tissue sarcomas, the anatomic locations where they occur, and their cross-sectional imaging features helps the radiologist establish the diagnosis or differential diagnosis so that patients with soft-tissue sarcomas can receive optimal treatment and management. In part 1 of this article, the most common soft-tissue sarcomas (liposarcoma, leiomyosarcoma, and GIST) are reviewed, with a discussion on anatomic locations, classification, clinical considerations, and differential diagnosis. Part 2 will focus on the remainder of the soft-tissue sarcomas occurring in the abdomen and pelvis.


Figures

Figure 1.
Figure 1.
Compartments within the retroperitoneum as defined by fascial planes. Drawing of the abdominal compartments in the axial plane shows the peritoneal cavity (blue) separated from the retroperitoneum (various shades of green) by the posterior parietal peritoneum (straight white arrow). The retroperitoneal compartments include the anterior pararenal space (light green), the perirenal space (medium green) bounded by the Gerota fascia (*), and the posterior pararenal space (dark green). The fusion of the Gerota and Zuckerkandl fasciae forms the lateral conal fascia (curved white arrows), which separates the lateral anterior pararenal space from the posterior pararenal space. In the anterior abdominal wall, the rectus abdominis muscles (R) are in the midline and contained in the rectus sheath. The external oblique (E), internal oblique (I), and transverse abdominis (T) muscles form the muscular layers of the anterolateral abdominal wall.
Figure 2a.
Figure 2a.
Fascial planes of the abdomen and pelvis. (a) Drawing of the retroperitoneum (green) in the sagittal plane shows the superior boundary formed by fusion of the posterior parietal peritoneum, Gerota fascia, and Zuckerkandl fascia with the undersurface of the diaphragm (arrow). (b) Drawing of the abdomen and pelvis in the sagittal plane shows the peritoneal cavity (blue) distinct from the retroperitoneal and extraperitoneal spaces.
Figure 2.
Figure 2.
Fascial planes of the abdomen and pelvis. (a) Drawing of the retroperitoneum (green) in the sagittal plane shows the superior boundary formed by fusion of the posterior parietal peritoneum, Gerota fascia, and Zuckerkandl fascia with the undersurface of the diaphragm (arrow). (b) Drawing of the abdomen and pelvis in the sagittal plane shows the peritoneal cavity (blue) distinct from the retroperitoneal and extraperitoneal spaces.
Figure 3a.
Figure 3a.
Well-differentiated liposarcoma in a 67-year-old man who complained of abdominal distention and pain. Axial (a) and coronal (b) nonenhanced CT images show a large well-defined, predominantly fat-attenuation mass, with thin septa (curved arrow) and small soft-tissue nodules (straight arrows).
Figure 3b.
Figure 3b.
Well-differentiated liposarcoma in a 67-year-old man who complained of abdominal distention and pain. Axial (a) and coronal (b) nonenhanced CT images show a large well-defined, predominantly fat-attenuation mass, with thin septa (curved arrow) and small soft-tissue nodules (straight arrows).
Figure 4a.
Figure 4a.
MR imaging features of well-differentiated liposarcoma in a 74-year-old woman with worsening back pain. (a) Axial T2-weighted MR image shows a well-defined high-signal-intensity mass (straight arrow) in the left retroperitoneum; the mass has internal septa (curved arrow). (b) Axial contrast material–enhanced T1-weighted fat-suppressed MR image shows that the mass (straight arrow) demonstrates a loss of signal intensity, with signal intensity similar to that of the subcutaneous fat. The thin septa (curved arrow) are enhanced. (c) Sagittal T2-weighted MR image shows longitudinal growth of the mass in the retroperitoneum, with well-defined margins (arrows) between the mass and the retroperitoneal fat superiorly.
Figure 4b.
Figure 4b.
MR imaging features of well-differentiated liposarcoma in a 74-year-old woman with worsening back pain. (a) Axial T2-weighted MR image shows a well-defined high-signal-intensity mass (straight arrow) in the left retroperitoneum; the mass has internal septa (curved arrow). (b) Axial contrast material–enhanced T1-weighted fat-suppressed MR image shows that the mass (straight arrow) demonstrates a loss of signal intensity, with signal intensity similar to that of the subcutaneous fat. The thin septa (curved arrow) are enhanced. (c) Sagittal T2-weighted MR image shows longitudinal growth of the mass in the retroperitoneum, with well-defined margins (arrows) between the mass and the retroperitoneal fat superiorly.
Figure 4c.
Figure 4c.
MR imaging features of well-differentiated liposarcoma in a 74-year-old woman with worsening back pain. (a) Axial T2-weighted MR image shows a well-defined high-signal-intensity mass (straight arrow) in the left retroperitoneum; the mass has internal septa (curved arrow). (b) Axial contrast material–enhanced T1-weighted fat-suppressed MR image shows that the mass (straight arrow) demonstrates a loss of signal intensity, with signal intensity similar to that of the subcutaneous fat. The thin septa (curved arrow) are enhanced. (c) Sagittal T2-weighted MR image shows longitudinal growth of the mass in the retroperitoneum, with well-defined margins (arrows) between the mass and the retroperitoneal fat superiorly.
Figure 5a.
Figure 5a.
Sclerosing type of well-differentiated liposarcoma in a 37-year-old man with severe abdominal pain. (a) Axial contrast-enhanced CT image shows a large multinodular tumor with a fat-attenuation component (*) separated from the soft-tissue enhancing components (arrows) by thin septa (arrowheads). (b) Photograph of the cut surface of the gross specimen shows a similar configuration, with pale-yellow tissue correlating with the fat component (*) shown on a, and with pink-yellow tissue correlating with the soft-tissue components (arrow); the components are separated by fibrous septa (arrowheads). (c) Photomicrograph of the sclerosing type of well-differentiated liposarcoma shows a few adipocytes and nonlipomatous cells in a collagenous matrix. (Hematoxylin-eosin [H-E] stain; original magnification, ×40.)
Figure 5b.
Figure 5b.
Sclerosing type of well-differentiated liposarcoma in a 37-year-old man with severe abdominal pain. (a) Axial contrast-enhanced CT image shows a large multinodular tumor with a fat-attenuation component (*) separated from the soft-tissue enhancing components (arrows) by thin septa (arrowheads). (b) Photograph of the cut surface of the gross specimen shows a similar configuration, with pale-yellow tissue correlating with the fat component (*) shown on a, and with pink-yellow tissue correlating with the soft-tissue components (arrow); the components are separated by fibrous septa (arrowheads). (c) Photomicrograph of the sclerosing type of well-differentiated liposarcoma shows a few adipocytes and nonlipomatous cells in a collagenous matrix. (Hematoxylin-eosin [H-E] stain; original magnification, ×40.)
Figure 5c.
Figure 5c.
Sclerosing type of well-differentiated liposarcoma in a 37-year-old man with severe abdominal pain. (a) Axial contrast-enhanced CT image shows a large multinodular tumor with a fat-attenuation component (*) separated from the soft-tissue enhancing components (arrows) by thin septa (arrowheads). (b) Photograph of the cut surface of the gross specimen shows a similar configuration, with pale-yellow tissue correlating with the fat component (*) shown on a, and with pink-yellow tissue correlating with the soft-tissue components (arrow); the components are separated by fibrous septa (arrowheads). (c) Photomicrograph of the sclerosing type of well-differentiated liposarcoma shows a few adipocytes and nonlipomatous cells in a collagenous matrix. (Hematoxylin-eosin [H-E] stain; original magnification, ×40.)
Figure 6a.
Figure 6a.
Spectrum of imaging appearances of dedifferentiated liposarcoma in three different patients. (a) Axial intravenous contrast material–enhanced CT image of dedifferentiated liposarcoma in a 58-year-old man shows areas of sharply demarcated fat (*) and blended fat (arrowheads), as well as larger enhancing solid components (straight arrow), with a less well-defined margin (curved arrow). (b) Axial intravenous and oral contrast material–enhanced CT image of dedifferentiated liposarcoma in a 72-year-old man shows progression to fewer areas of blended fat (arrowhead), with larger myxoid (*) and solid enhancing (arrows) components. (c) Axial intravenous and oral contrast material–enhanced CT image of dedifferentiated liposarcoma in a 68-year-old woman shows that in addition to blended fat (arrowhead) in a larger solid mass, coarse calcification (arrow) correlating with metaplasia or chondro-osseous components can also be depicted. (d) Photomicrograph of dedifferentiated liposarcoma with well-differentiated components shows an abrupt transition between the nonlipogenic highly cellular dedifferentiated component (*) and the well-differentiated lipomatous component. (H-E stain; original magnification, ×40.)
Figure 6b.
Figure 6b.
Spectrum of imaging appearances of dedifferentiated liposarcoma in three different patients. (a) Axial intravenous contrast material–enhanced CT image of dedifferentiated liposarcoma in a 58-year-old man shows areas of sharply demarcated fat (*) and blended fat (arrowheads), as well as larger enhancing solid components (straight arrow), with a less well-defined margin (curved arrow). (b) Axial intravenous and oral contrast material–enhanced CT image of dedifferentiated liposarcoma in a 72-year-old man shows progression to fewer areas of blended fat (arrowhead), with larger myxoid (*) and solid enhancing (arrows) components. (c) Axial intravenous and oral contrast material–enhanced CT image of dedifferentiated liposarcoma in a 68-year-old woman shows that in addition to blended fat (arrowhead) in a larger solid mass, coarse calcification (arrow) correlating with metaplasia or chondro-osseous components can also be depicted. (d) Photomicrograph of dedifferentiated liposarcoma with well-differentiated components shows an abrupt transition between the nonlipogenic highly cellular dedifferentiated component (*) and the well-differentiated lipomatous component. (H-E stain; original magnification, ×40.)
Figure 6c.
Figure 6c.
Spectrum of imaging appearances of dedifferentiated liposarcoma in three different patients. (a) Axial intravenous contrast material–enhanced CT image of dedifferentiated liposarcoma in a 58-year-old man shows areas of sharply demarcated fat (*) and blended fat (arrowheads), as well as larger enhancing solid components (straight arrow), with a less well-defined margin (curved arrow). (b) Axial intravenous and oral contrast material–enhanced CT image of dedifferentiated liposarcoma in a 72-year-old man shows progression to fewer areas of blended fat (arrowhead), with larger myxoid (*) and solid enhancing (arrows) components. (c) Axial intravenous and oral contrast material–enhanced CT image of dedifferentiated liposarcoma in a 68-year-old woman shows that in addition to blended fat (arrowhead) in a larger solid mass, coarse calcification (arrow) correlating with metaplasia or chondro-osseous components can also be depicted. (d) Photomicrograph of dedifferentiated liposarcoma with well-differentiated components shows an abrupt transition between the nonlipogenic highly cellular dedifferentiated component (*) and the well-differentiated lipomatous component. (H-E stain; original magnification, ×40.)
Figure 6d.
Figure 6d.
Spectrum of imaging appearances of dedifferentiated liposarcoma in three different patients. (a) Axial intravenous contrast material–enhanced CT image of dedifferentiated liposarcoma in a 58-year-old man shows areas of sharply demarcated fat (*) and blended fat (arrowheads), as well as larger enhancing solid components (straight arrow), with a less well-defined margin (curved arrow). (b) Axial intravenous and oral contrast material–enhanced CT image of dedifferentiated liposarcoma in a 72-year-old man shows progression to fewer areas of blended fat (arrowhead), with larger myxoid (*) and solid enhancing (arrows) components. (c) Axial intravenous and oral contrast material–enhanced CT image of dedifferentiated liposarcoma in a 68-year-old woman shows that in addition to blended fat (arrowhead) in a larger solid mass, coarse calcification (arrow) correlating with metaplasia or chondro-osseous components can also be depicted. (d) Photomicrograph of dedifferentiated liposarcoma with well-differentiated components shows an abrupt transition between the nonlipogenic highly cellular dedifferentiated component (*) and the well-differentiated lipomatous component. (H-E stain; original magnification, ×40.)
Figure 7a.
Figure 7a.
Incidentally identified intra-abdominal leiomyosarcoma in a 55-year-old woman. (a–c) Axial T1-weighted (a), T2-weighted (b), and gadolinium-enhanced T1-weighted fat-suppressed (c) MR images show a large relatively homogeneous, non–fat-containing solid intra-abdominal mass that is isointense to skeletal muscle on T1-weighted images (arrows on a), heterogeneously T2 hyperintense (arrows on b), and heterogeneously enhanced (arrows on c). (d) Photomicrograph of leiomyosarcoma shows elongated atypical spindle cells with blunt-ended nuclei with mitotic activity. (H-E stain; original magnification, ×80.)
Figure 7b.
Figure 7b.
Incidentally identified intra-abdominal leiomyosarcoma in a 55-year-old woman. (a–c) Axial T1-weighted (a), T2-weighted (b), and gadolinium-enhanced T1-weighted fat-suppressed (c) MR images show a large relatively homogeneous, non–fat-containing solid intra-abdominal mass that is isointense to skeletal muscle on T1-weighted images (arrows on a), heterogeneously T2 hyperintense (arrows on b), and heterogeneously enhanced (arrows on c). (d) Photomicrograph of leiomyosarcoma shows elongated atypical spindle cells with blunt-ended nuclei with mitotic activity. (H-E stain; original magnification, ×80.)
Figure 7c.
Figure 7c.
Incidentally identified intra-abdominal leiomyosarcoma in a 55-year-old woman. (a–c) Axial T1-weighted (a), T2-weighted (b), and gadolinium-enhanced T1-weighted fat-suppressed (c) MR images show a large relatively homogeneous, non–fat-containing solid intra-abdominal mass that is isointense to skeletal muscle on T1-weighted images (arrows on a), heterogeneously T2 hyperintense (arrows on b), and heterogeneously enhanced (arrows on c). (d) Photomicrograph of leiomyosarcoma shows elongated atypical spindle cells with blunt-ended nuclei with mitotic activity. (H-E stain; original magnification, ×80.)
Figure 7d.
Figure 7d.
Incidentally identified intra-abdominal leiomyosarcoma in a 55-year-old woman. (a–c) Axial T1-weighted (a), T2-weighted (b), and gadolinium-enhanced T1-weighted fat-suppressed (c) MR images show a large relatively homogeneous, non–fat-containing solid intra-abdominal mass that is isointense to skeletal muscle on T1-weighted images (arrows on a), heterogeneously T2 hyperintense (arrows on b), and heterogeneously enhanced (arrows on c). (d) Photomicrograph of leiomyosarcoma shows elongated atypical spindle cells with blunt-ended nuclei with mitotic activity. (H-E stain; original magnification, ×80.)
Figure 8a.
Figure 8a.
Intraluminal and extraluminal leiomyosarcoma in the IVC of a 46-year-old man who presented with a 5-month history of progressive leg swelling. Coronal (a) and sagittal (b) contrast-enhanced CT images show a heterogeneously enhancing mass expanding the IVC (straight arrows), with a small round extraluminal component inferiorly (curved arrow on a).
Figure 8b.
Figure 8b.
Intraluminal and extraluminal leiomyosarcoma in the IVC of a 46-year-old man who presented with a 5-month history of progressive leg swelling. Coronal (a) and sagittal (b) contrast-enhanced CT images show a heterogeneously enhancing mass expanding the IVC (straight arrows), with a small round extraluminal component inferiorly (curved arrow on a).
Figure 9a.
Figure 9a.
Leiomyosarcoma arising in the left renal vein in a 59-year-old man with progressive left flank pain. (a, b) Axial T1-weighted (a) and T2-weighted (b) MR images show a homogeneous mass intimately associated with the left renal vein, with an extraluminal component that is isointense to skeletal muscle on T1-weighted images (arrows on a) and mildly hyperintense to skeletal muscle on T2-weighted images (arrows on b). (c) Coronal gadolinium-enhanced T1-weighted fat-suppressed MR image shows enhancement of the central vein component (straight arrows) and the intraluminal tumor extending into the infrahepatic IVC (curved arrow). (d) Photograph of the gross specimen shows the intraluminal component adherent to the wall of the left renal vein (straight arrows) and the contiguous smooth gray-tan tumor thrombus extending beyond the resected renal vein margin (curved arrows); the tumor thrombus was milked from the IVC.
Figure 9b.
Figure 9b.
Leiomyosarcoma arising in the left renal vein in a 59-year-old man with progressive left flank pain. (a, b) Axial T1-weighted (a) and T2-weighted (b) MR images show a homogeneous mass intimately associated with the left renal vein, with an extraluminal component that is isointense to skeletal muscle on T1-weighted images (arrows on a) and mildly hyperintense to skeletal muscle on T2-weighted images (arrows on b). (c) Coronal gadolinium-enhanced T1-weighted fat-suppressed MR image shows enhancement of the central vein component (straight arrows) and the intraluminal tumor extending into the infrahepatic IVC (curved arrow). (d) Photograph of the gross specimen shows the intraluminal component adherent to the wall of the left renal vein (straight arrows) and the contiguous smooth gray-tan tumor thrombus extending beyond the resected renal vein margin (curved arrows); the tumor thrombus was milked from the IVC.
Figure 9c.
Figure 9c.
Leiomyosarcoma arising in the left renal vein in a 59-year-old man with progressive left flank pain. (a, b) Axial T1-weighted (a) and T2-weighted (b) MR images show a homogeneous mass intimately associated with the left renal vein, with an extraluminal component that is isointense to skeletal muscle on T1-weighted images (arrows on a) and mildly hyperintense to skeletal muscle on T2-weighted images (arrows on b). (c) Coronal gadolinium-enhanced T1-weighted fat-suppressed MR image shows enhancement of the central vein component (straight arrows) and the intraluminal tumor extending into the infrahepatic IVC (curved arrow). (d) Photograph of the gross specimen shows the intraluminal component adherent to the wall of the left renal vein (straight arrows) and the contiguous smooth gray-tan tumor thrombus extending beyond the resected renal vein margin (curved arrows); the tumor thrombus was milked from the IVC.
Figure 9d.
Figure 9d.
Leiomyosarcoma arising in the left renal vein in a 59-year-old man with progressive left flank pain. (a, b) Axial T1-weighted (a) and T2-weighted (b) MR images show a homogeneous mass intimately associated with the left renal vein, with an extraluminal component that is isointense to skeletal muscle on T1-weighted images (arrows on a) and mildly hyperintense to skeletal muscle on T2-weighted images (arrows on b). (c) Coronal gadolinium-enhanced T1-weighted fat-suppressed MR image shows enhancement of the central vein component (straight arrows) and the intraluminal tumor extending into the infrahepatic IVC (curved arrow). (d) Photograph of the gross specimen shows the intraluminal component adherent to the wall of the left renal vein (straight arrows) and the contiguous smooth gray-tan tumor thrombus extending beyond the resected renal vein margin (curved arrows); the tumor thrombus was milked from the IVC.
Figure 10a.
Figure 10a.
Leiomyosarcoma arising in the anterior abdominal wall of a 65-year-old woman with abdominal pain. (a) Axial contrast-enhanced CT image of the upper pelvis shows a homogeneous ovoid mass (arrow) arising within the anterolateral abdominal wall musculature. (b) Axial T1-weighted MR image shows that the mass (arrow) is mildly hyperintense to skeletal muscle. (c) Axial T2-weighted MR image shows that the mass (arrow) is heterogeneous, with curvilinear bands of T2 hyperintensity. (d) Axial contrast-enhanced T1-weighted fat-suppressed MR image shows heterogeneous enhancement of the mass (arrow). (e) Photograph of the gross specimen shows a tan-pink soft-tissue mass with a whorled surface.
Figure 10b.
Figure 10b.
Leiomyosarcoma arising in the anterior abdominal wall of a 65-year-old woman with abdominal pain. (a) Axial contrast-enhanced CT image of the upper pelvis shows a homogeneous ovoid mass (arrow) arising within the anterolateral abdominal wall musculature. (b) Axial T1-weighted MR image shows that the mass (arrow) is mildly hyperintense to skeletal muscle. (c) Axial T2-weighted MR image shows that the mass (arrow) is heterogeneous, with curvilinear bands of T2 hyperintensity. (d) Axial contrast-enhanced T1-weighted fat-suppressed MR image shows heterogeneous enhancement of the mass (arrow). (e) Photograph of the gross specimen shows a tan-pink soft-tissue mass with a whorled surface.
Figure 10c.
Figure 10c.
Leiomyosarcoma arising in the anterior abdominal wall of a 65-year-old woman with abdominal pain. (a) Axial contrast-enhanced CT image of the upper pelvis shows a homogeneous ovoid mass (arrow) arising within the anterolateral abdominal wall musculature. (b) Axial T1-weighted MR image shows that the mass (arrow) is mildly hyperintense to skeletal muscle. (c) Axial T2-weighted MR image shows that the mass (arrow) is heterogeneous, with curvilinear bands of T2 hyperintensity. (d) Axial contrast-enhanced T1-weighted fat-suppressed MR image shows heterogeneous enhancement of the mass (arrow). (e) Photograph of the gross specimen shows a tan-pink soft-tissue mass with a whorled surface.
Figure 10d.
Figure 10d.
Leiomyosarcoma arising in the anterior abdominal wall of a 65-year-old woman with abdominal pain. (a) Axial contrast-enhanced CT image of the upper pelvis shows a homogeneous ovoid mass (arrow) arising within the anterolateral abdominal wall musculature. (b) Axial T1-weighted MR image shows that the mass (arrow) is mildly hyperintense to skeletal muscle. (c) Axial T2-weighted MR image shows that the mass (arrow) is heterogeneous, with curvilinear bands of T2 hyperintensity. (d) Axial contrast-enhanced T1-weighted fat-suppressed MR image shows heterogeneous enhancement of the mass (arrow). (e) Photograph of the gross specimen shows a tan-pink soft-tissue mass with a whorled surface.
Figure 10e.
Figure 10e.
Leiomyosarcoma arising in the anterior abdominal wall of a 65-year-old woman with abdominal pain. (a) Axial contrast-enhanced CT image of the upper pelvis shows a homogeneous ovoid mass (arrow) arising within the anterolateral abdominal wall musculature. (b) Axial T1-weighted MR image shows that the mass (arrow) is mildly hyperintense to skeletal muscle. (c) Axial T2-weighted MR image shows that the mass (arrow) is heterogeneous, with curvilinear bands of T2 hyperintensity. (d) Axial contrast-enhanced T1-weighted fat-suppressed MR image shows heterogeneous enhancement of the mass (arrow). (e) Photograph of the gross specimen shows a tan-pink soft-tissue mass with a whorled surface.
Figure 11a.
Figure 11a.
Intra-abdominal leiomyosarcoma in a 75-year-old man complaining of increasing abdominal girth and abdominal pain. Axial (a) and coronal (b) contrast-enhanced CT images show a large intra-abdominal mass (straight arrows) displacing bowel loops laterally; the mass has central necrosis (*) despite prominent blood vessels. This leiomyosarcoma was metastatic at manifestation, with similar-appearing masses depicted in the liver (curved arrows on b).
Figure 11b.
Figure 11b.
Intra-abdominal leiomyosarcoma in a 75-year-old man complaining of increasing abdominal girth and abdominal pain. Axial (a) and coronal (b) contrast-enhanced CT images show a large intra-abdominal mass (straight arrows) displacing bowel loops laterally; the mass has central necrosis (*) despite prominent blood vessels. This leiomyosarcoma was metastatic at manifestation, with similar-appearing masses depicted in the liver (curved arrows on b).
Figure 12a.
Figure 12a.
Histologic features of GIST. (a) Photomicrograph shows that the tumor is composed of uniform spindle cells demonstrating mitotic activity. (H-E stain; original magnification, ×80.) (b) Photomicrograph shows that the tumor cells are strongly positive for KIT. (KIT immunohistochemical stain; original magnification, ×100.)
Figure 12b.
Figure 12b.
Histologic features of GIST. (a) Photomicrograph shows that the tumor is composed of uniform spindle cells demonstrating mitotic activity. (H-E stain; original magnification, ×80.) (b) Photomicrograph shows that the tumor cells are strongly positive for KIT. (KIT immunohistochemical stain; original magnification, ×100.)
Figure 13a.
Figure 13a.
GIST arising from the stomach in a 62-year-old man with abdominal distention. (a) Axial contrast-enhanced CT image shows a large mass with areas of low attenuation (*) in the upper abdomen. The mass compresses the superior mesenteric vein. (b) Coronal maximum intensity projection image shows that the mass is arising from the greater curvature of the stomach, with a polypoid intraluminal component (curved arrow). (c) Sagittal maximum intensity projection image shows prominent collateral vessels draped over the anterior superior tumor (arrow).
Figure 13b.
Figure 13b.
GIST arising from the stomach in a 62-year-old man with abdominal distention. (a) Axial contrast-enhanced CT image shows a large mass with areas of low attenuation (*) in the upper abdomen. The mass compresses the superior mesenteric vein. (b) Coronal maximum intensity projection image shows that the mass is arising from the greater curvature of the stomach, with a polypoid intraluminal component (curved arrow). (c) Sagittal maximum intensity projection image shows prominent collateral vessels draped over the anterior superior tumor (arrow).
Figure 13c.
Figure 13c.
GIST arising from the stomach in a 62-year-old man with abdominal distention. (a) Axial contrast-enhanced CT image shows a large mass with areas of low attenuation (*) in the upper abdomen. The mass compresses the superior mesenteric vein. (b) Coronal maximum intensity projection image shows that the mass is arising from the greater curvature of the stomach, with a polypoid intraluminal component (curved arrow). (c) Sagittal maximum intensity projection image shows prominent collateral vessels draped over the anterior superior tumor (arrow).
Figure 14a.
Figure 14a.
GIST arising from the stomach in a 62-year-old woman who had pain when lying in the prone position, early satiety, and a palpable abdominal mass. (a) Axial contrast-enhanced CT image shows a large predominantly low-attenuation (cystic-appearing) mass within the upper abdomen. (b) Coronal maximum intensity projection image shows that the mass is inseparable from the greater curvature of the stomach (arrows) but is without a distinct intramural or intraluminal component. (c) Intraoperative photograph shows that the large lobulated well-defined mass is attached to the stomach with a thin strand of tissue (arrows).
Figure 14b.
Figure 14b.
GIST arising from the stomach in a 62-year-old woman who had pain when lying in the prone position, early satiety, and a palpable abdominal mass. (a) Axial contrast-enhanced CT image shows a large predominantly low-attenuation (cystic-appearing) mass within the upper abdomen. (b) Coronal maximum intensity projection image shows that the mass is inseparable from the greater curvature of the stomach (arrows) but is without a distinct intramural or intraluminal component. (c) Intraoperative photograph shows that the large lobulated well-defined mass is attached to the stomach with a thin strand of tissue (arrows).
Figure 14c.
Figure 14c.
GIST arising from the stomach in a 62-year-old woman who had pain when lying in the prone position, early satiety, and a palpable abdominal mass. (a) Axial contrast-enhanced CT image shows a large predominantly low-attenuation (cystic-appearing) mass within the upper abdomen. (b) Coronal maximum intensity projection image shows that the mass is inseparable from the greater curvature of the stomach (arrows) but is without a distinct intramural or intraluminal component. (c) Intraoperative photograph shows that the large lobulated well-defined mass is attached to the stomach with a thin strand of tissue (arrows).
Figure 15a.
Figure 15a.
GIST arising from the gastric antrum in an asymptomatic 74-year-old woman. Axial (a) and coronal (b) contrast-enhanced CT images show a mixed-attenuation mass with areas of low attenuation (*) and extensive high-attenuation calcification (curved arrow) extending along the omentum.
Figure 15b.
Figure 15b.
GIST arising from the gastric antrum in an asymptomatic 74-year-old woman. Axial (a) and coronal (b) contrast-enhanced CT images show a mixed-attenuation mass with areas of low attenuation (*) and extensive high-attenuation calcification (curved arrow) extending along the omentum.
Figure 16a.
Figure 16a.
Renal angiomyolipoma incidentally discovered in a 66-year-old woman at CT enterography performed for gastrointestinal bleeding. Axial (a) and sagittal (b) contrast-enhanced CT images show a well-circumscribed fat-containing lesion (straight arrow) with thin internal septa and small blood vessels. The sagittal image best shows a subtle renal cortical defect (curved arrow on b).
Figure 16b.
Figure 16b.
Renal angiomyolipoma incidentally discovered in a 66-year-old woman at CT enterography performed for gastrointestinal bleeding. Axial (a) and sagittal (b) contrast-enhanced CT images show a well-circumscribed fat-containing lesion (straight arrow) with thin internal septa and small blood vessels. The sagittal image best shows a subtle renal cortical defect (curved arrow on b).
Figure 17a.
Figure 17a.
Acute and chronic manifestations of fat necrosis in two patients. (a) Axial contrast-enhanced CT image of acute fat necrosis in a 45-year-old woman after surgery shows a partially defined fatty mass (straight arrow) in the anterior left abdomen, with substantial surrounding postoperative and inflammatory stranding and fluid (curved arrows). (b) Axial contrast-enhanced CT image of chronic fat necrosis in a 50-year-old man shows a well-circumscribed fatty mass (arrow) with peripheral thin calcification in the anterior left abdomen.
Figure 17b.
Figure 17b.
Acute and chronic manifestations of fat necrosis in two patients. (a) Axial contrast-enhanced CT image of acute fat necrosis in a 45-year-old woman after surgery shows a partially defined fatty mass (straight arrow) in the anterior left abdomen, with substantial surrounding postoperative and inflammatory stranding and fluid (curved arrows). (b) Axial contrast-enhanced CT image of chronic fat necrosis in a 50-year-old man shows a well-circumscribed fatty mass (arrow) with peripheral thin calcification in the anterior left abdomen.
Figure 18a.
Figure 18a.
Desmoid tumor in a 50-year-old man with vague pain in the left upper quadrant. (a) Axial contrast-enhanced CT image shows a well-circumscribed mass (straight arrow), which has low attenuation compared with the adherent transversus abdominis muscle (curved arrow). (b, c) Axial T2-weighted (b) and contrast-enhanced T1-weighted fat-suppressed (c) MR images show heterogeneous intrinsic high T2 signal intensity within the mass (arrow on b), with avid enhancement of the mass (arrow on c).
Figure 18b.
Figure 18b.
Desmoid tumor in a 50-year-old man with vague pain in the left upper quadrant. (a) Axial contrast-enhanced CT image shows a well-circumscribed mass (straight arrow), which has low attenuation compared with the adherent transversus abdominis muscle (curved arrow). (b, c) Axial T2-weighted (b) and contrast-enhanced T1-weighted fat-suppressed (c) MR images show heterogeneous intrinsic high T2 signal intensity within the mass (arrow on b), with avid enhancement of the mass (arrow on c).
Figure 18c.
Figure 18c.
Desmoid tumor in a 50-year-old man with vague pain in the left upper quadrant. (a) Axial contrast-enhanced CT image shows a well-circumscribed mass (straight arrow), which has low attenuation compared with the adherent transversus abdominis muscle (curved arrow). (b, c) Axial T2-weighted (b) and contrast-enhanced T1-weighted fat-suppressed (c) MR images show heterogeneous intrinsic high T2 signal intensity within the mass (arrow on b), with avid enhancement of the mass (arrow on c).

References

    1. Fletcher CDM, Bridge JA, Hogendoorn PCW, Mertens F, eds. WHO classification of tumours of soft tissue and bone. 4th ed. Lyon, France: IARC, 2013; 10–11.
    1. Siegel RL, Miller KD, Jemal A. Cancer statistics, 2016. CA Cancer J Clin 2016;66(1):7–30. - PubMed
    1. Cormier JN, Pollock RE. Soft tissue sarcomas. CA Cancer J Clin 2004;54(2):94–109. - PubMed
    1. Baheti AD, O’Malley RB, Kim S, et al. Soft-tissue sarcomas: an update for radiologists based on the revised 2013 World Health Organization classification. AJR Am J Roentgenol 2016;206(5):924–932. - PubMed
    1. Gerota D. Beitrage zur kenntnis des befestigungsapparates der niere. Arch Anat Entwicklungsgesch 1895;19:265–286.

MeSH terms

LinkOut - more resources