. 2017 Mar 13:2:17032.
doi: 10.1038/nmicrobiol.2017.32.

Trypanosoma brucei metabolism is under circadian control

Affiliations

Trypanosoma brucei metabolism is under circadian control

Filipa Rijo-Ferreira et al. Nat Microbiol. .

Abstract

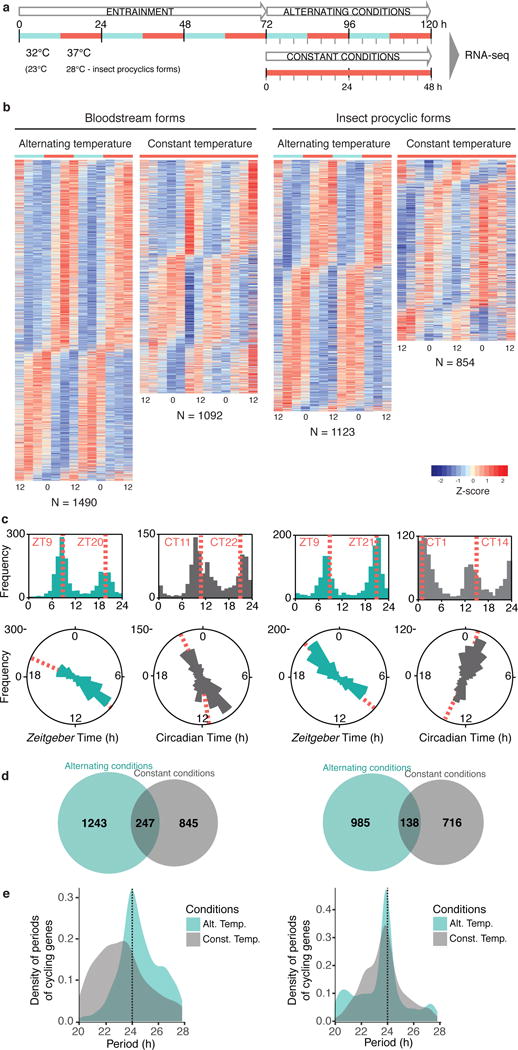
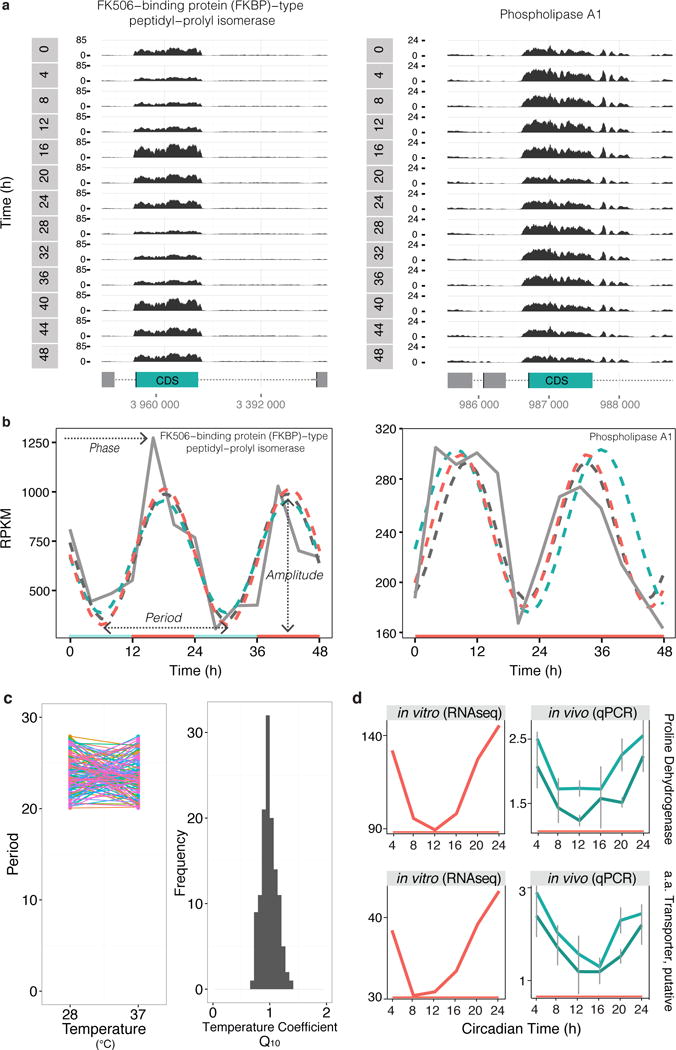
The Earth's rotation forced life to evolve under cyclic day and night environmental changes. To anticipate such daily cycles, prokaryote and eukaryote free-living organisms evolved intrinsic clocks that regulate physiological and behavioural processes. Daily rhythms have been observed in organisms living within hosts, such as parasites. Whether parasites have intrinsic molecular clocks or whether they simply respond to host rhythmic physiological cues remains unknown. Here, we show that Trypanosoma brucei, the causative agent of human sleeping sickness, has an intrinsic circadian clock that regulates its metabolism in two different stages of the life cycle. We found that, in vitro, ∼10% of genes in T. brucei are expressed with a circadian rhythm. The maximum expression of these genes occurs at two different phases of the day and may depend on a post-transcriptional mechanism. Circadian genes are enriched in cellular metabolic pathways and coincide with two peaks of intracellular adenosine triphosphate concentration. Moreover, daily changes in the parasite population lead to differences in suramin sensitivity, a drug commonly used to treat this infection. These results demonstrate that parasites have an intrinsic circadian clock that is independent of the host, and which regulates parasite biology throughout the day.


Conflict of interest statement

The authors declare no competing financial interests.

Figures

Fig. 1
Fig. 1
T. brucei has a circadian transcriptome in two stages of the life cycle, mammalian bloodstream and insect procyclic-forms. (a) Populations of parasites were entrained to 12h: 12h temperature intervals for three days, after which they were kept in alternating conditions or released into constant conditions for two days. During these two days, RNA was collected every 4h for RNA-seq (see Methods and Supplementary Fig. 3). (b) Gene expression heatmap views of temperature-entrained cycling genes of bloodstream and procyclic-forms. Each row represents a gene, ordered vertically by phase, determined by ARSER. N=Total number of cycling genes identified. Supplementary Data 1–2. (c) Phase distribution of cycling genes entrained by temperature. The phase of each gene’s rhythm across the day is represented in a histogram plot (top) and rose plot (bottom). The mean circular phase of the different phase clusters is indicated by an orange dashed line. (d) Venn diagram of number of cycling genes identified in temperature-entrained cycling and constant conditions for bloodstream (left) and insect procyclic-forms (right). (e) Period distribution of genes cycling in alternating (teal) and constant (grey) temperature in both life cycle stages. The total area under the curve is one for each condition. In alternating temperature conditions, the period of cycling genes is centred around 24h, while in constant temperature, the distribution of period of cycling genes is broader. The dashed line indicates the expected entraining period of 24h for the alternating conditions.
Fig. 2
Fig. 2
Circadian expression is temperature compensated and detected in vivo during a mouse infection. (a) Genome browser views of RNA-seq coverage from bloodstream-form parasites in temperature-entrained conditions for two genes: Tb927.10.16100, FK506-binding protein (FKBP)-type peptidyl-prolyl isomerase, putative and Tb927.1.4830, phospholipase A1 (genes represented in teal) out of the ~1100 genes cycling. CDS (coding sequence) is represented as a green rectangle and intergenic regions as gray dotted line. Reads coverage is shown in black as reads per million total reads (RPM) across 48h. (b) RPKM (reads per kilobase of transcript per million mapped reads) quantification of RNA-seq read coverage and circadian algorithm fits. ARSER fit is represented in a dark gray dashed line, JTK_CYCLE in teal and Fisher’s G-Test in orange. Represented genes are same as above: FKBP (JTK_CYCLE, ARSER and Fisher’s G-Test p<0.01) and phospholipase A1 (ARSER and Fisher’s G-Test p<0.05). (c) Period of oscillation of 127 common cycling genes at constant temperatures of 28°C and 37°C. Distribution of the estimated temperature coefficient (Q10) for the period of the 127 common cycling genes. (d) Expression of two representative cycling genes in vitro (left) and in vivo (right) (9 genes cycled in vivo out of the 11 genes tested, more examples in Supplementary Fig. 5). Transcript values in vitro were retrieved from RNA-seq analysis of bloodstream-form transcriptome in constant temperature. To measure transcript levels in vivo, RNA was extracted from parasites in the blood of infected mice. Transcript levels of proline dehydrogenase (Tb927.7.210) and putative amino acid transporter (Tb927.8.7650) were normalized to non-cycling transcripts of zinc finger protein 3 (ZFP3, Tb927.3.720, teal) and acidic phosphatase (Tb927.5.610, dark teal). N = 18 (3 mice/time point). Error bars represent standard error. Genes were found cycling significantly by ARSER, p<0.05.
Fig. 3
Fig. 3
T. brucei cycling gene expression is post-transcriptionally regulated. (a–b) Distribution of cycling genes genes across chromosomes 1, 2 and 3 (all 11 chromosomes are represented in Supplementary Fig. 8). The transcription start site (TSS) at the beginning of each polycistronic unit (PCUs) and direction of transcription is indicated by a vertical black flag. Genes are either: gray when non-cycling; orange when cycling with maximal expression between Circadian time CT3-CT18 for (a) bloodstream or CT18-CT9 for (b) insect procyclic-forms; and teal when cycling with maximal expression between CT19-CT2 for (a) bloodstream or CT10-CT19 for (b) insect procyclic-forms. (c–d) Cycling genes with different phases of expression encoded in the same PCU in (c) bloodstream-forms and in (d) insect procyclic-forms. A representative PCU from each of the first three chromosomes is depicted (chromosomes 1–3 have 11, 17 and 12 PCUs, respectively. From these, in bloodstream-forms, 8/11, 10/17 and 10/12 PCUs have cycling genes. In procyclic-forms 7/11, 6/17 and 10/12 PCUs have cycling genes). (e) Cell cycle profile analysis of bloodstream parasites throughout the 4th day of alternating temperature. Parasites were fixed and stained with propidium iodide and analysed by FACS. ZT refers to Zeitgeiber time, in which ZT = 0h corresponds to the beginning of the cold period (32°C). Error bars represent standard error. N=3 biological replicates. (f) Expression profile of two cell cycle associated genes (DNA topoisomerase II, putative (TOP2), Tb927.11.11540 and cdc2-related kinase 3, putative (CRK3), Tb927.10.4990) measured with RNA-seq from cultures in constant temperature. RPKM refers to reads per kilobase of transcript per million mapped reads.
Fig. 4
Fig. 4
The T. brucei circadian transcriptome regulates metabolism related genes. (a) Heatmap view of GO term enrichment of both bloodstream and insect-stage parasite circadian gene expression throughout the day (2h phase cluster, p<0.05, Hypergeometric test, Supplementary Data 4). Side plots show individual gene expression profile of the manually curated most significantly enriched GO term in the selected clusters. In each plot, we have indicated the number of cycling genes with the designated phase, out of the total number of genes in the specific GO term. Relative expression refers to relative expression calculated by RPKM (reads per kilobase of transcript per million mapped reads) levels of each gene normalized by its mean across the 13 time points. (b) Metabolic pathways are enriched in intrinsic cycling genes expressed at different times of the day. The total area under the curve is one for each pathway. Genes belonging to six out of the 55 KEGG pathways are shown. (c) Parasite intracellular ATP concentrations were measured on day four from cultures in alternating or constant temperature from two independent experiments from a minimum of six biological replicates per condition.
Fig. 5
Fig. 5
The T. brucei circadian transcriptome affects the sensitivity of the parasite to stresses. (a) Dose response curve from oxidative stress sensitivity challenge and the respective IC50 calculated at different times of the day. Bloodstream-form parasites were treated with serial dilution of H2O2 concentrations. Non-linear regression (variable slope, four parameters) comparison shows LogIC50 is different (p<0.0001) between time points. N = 6 biological replicates. Error bars represent the standard error. CT refers to Circadian Time. (b) Dose response curve from suramin treatment of parasites at different times of the day and the respective IC50 calculated for each time point. Bloodstream-form parasites were collected around the clock and treated with serial dilution of suramin concentrations and viability measured. Non-linear regression (variable slope, four parameters) comparison shows LogIC50 is different (p<0.0001) between time points. N = 9 biological replicates tested in three independent experiments. Error bars represent the standard error. CT refers to Circadian Time, in which CT0 is the time when cultures would be transitioned to the cold (32°C) during the entrainment period, but instead here they are kept in constant temperature (37°C) free-running conditions.

References

    1. Young MW, Kay SA. Time zones: a comparative genetics of circadian clocks. Nat Rev Genet. 2001;2:702–715. doi: 10.1038/35088576. - DOI - PubMed
    1. Rosbash M. The implications of multiple circadian clock origins. PLoS Biol. 2009;7:e62. doi: 10.1371/journal.pbio.1000062. - DOI - PMC - PubMed
    1. Bell-Pedersen D, et al. Circadian rhythms from multiple oscillators: lessons from diverse organisms. Nat Rev Genet. 2005;6:544–556. doi: 10.1038/nrg1633. - DOI - PMC - PubMed
    1. Welsh DK, Yoo SH, Liu AC, Takahashi JS, Kay SA. Bioluminescence imaging of individual fibroblasts reveals persistent, independently phased circadian rhythms of clock gene expression. Curr Biol. 2004;14:2289–2295. doi:S0960982204009157 [pii] 10.1016/j.cub.2004.11.057. - PMC - PubMed
    1. Balsalobre A, Damiola F, Schibler U. A serum shock induces circadian gene expression in mammalian tissue culture cells. Cell. 1998;93:929–937. - PubMed

MeSH terms