. 2017 May;18(5):541-551.
doi: 10.1038/ni.3690. Epub 2017 Mar 13.

NLRP12 attenuates colon inflammation by maintaining colonic microbial diversity and promoting protective commensal bacterial growth

Affiliations

NLRP12 attenuates colon inflammation by maintaining colonic microbial diversity and promoting protective commensal bacterial growth

Liang Chen et al. Nat Immunol. 2017 May.

Erratum in

Abstract

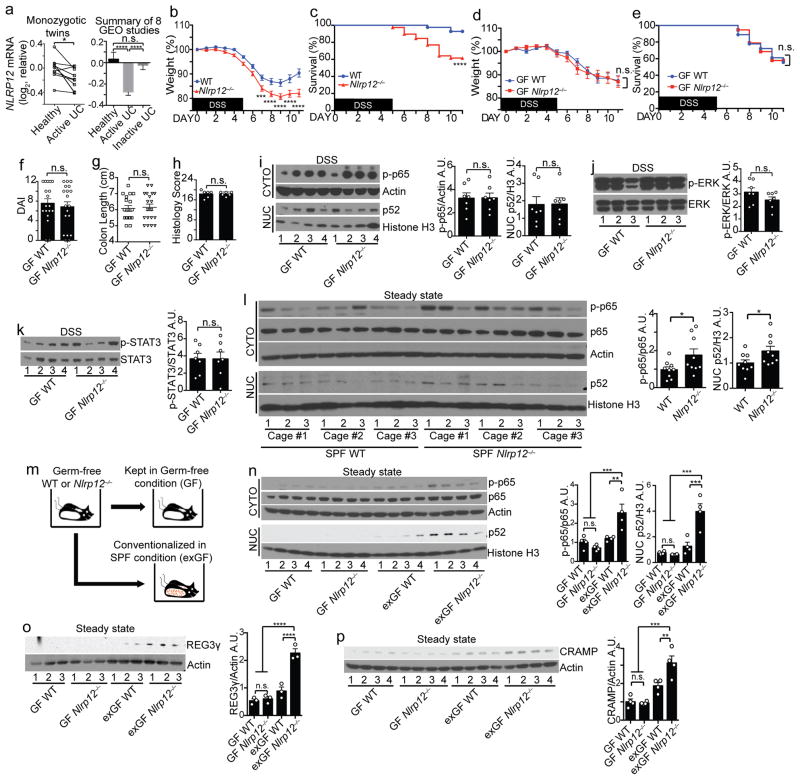
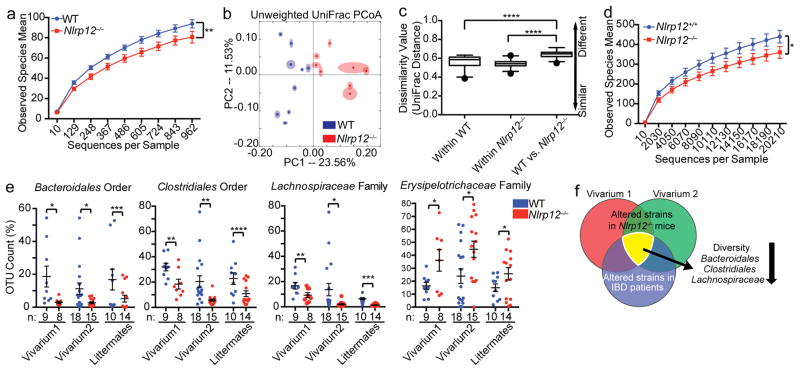
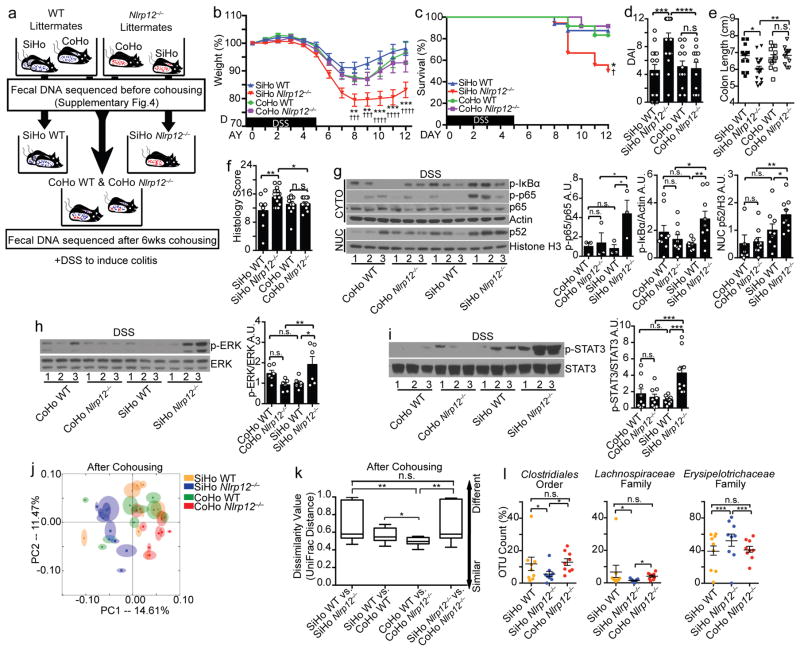
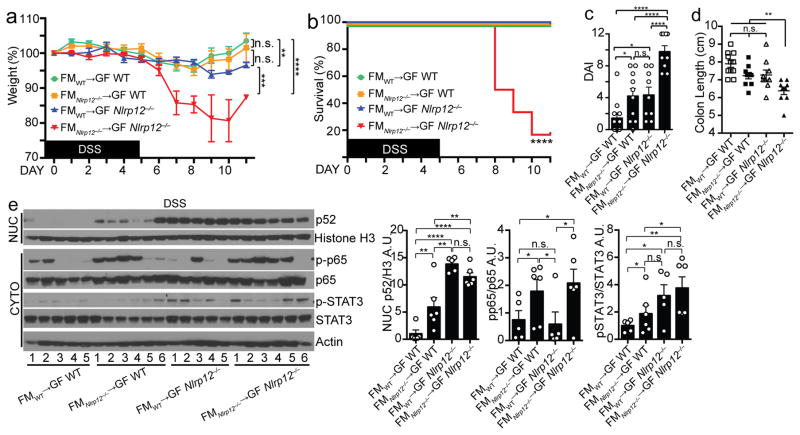
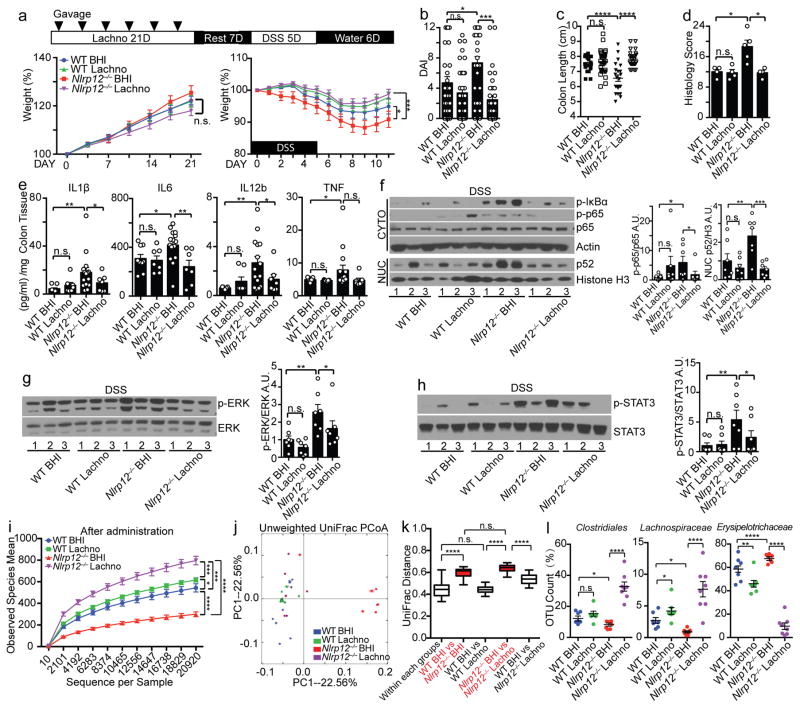
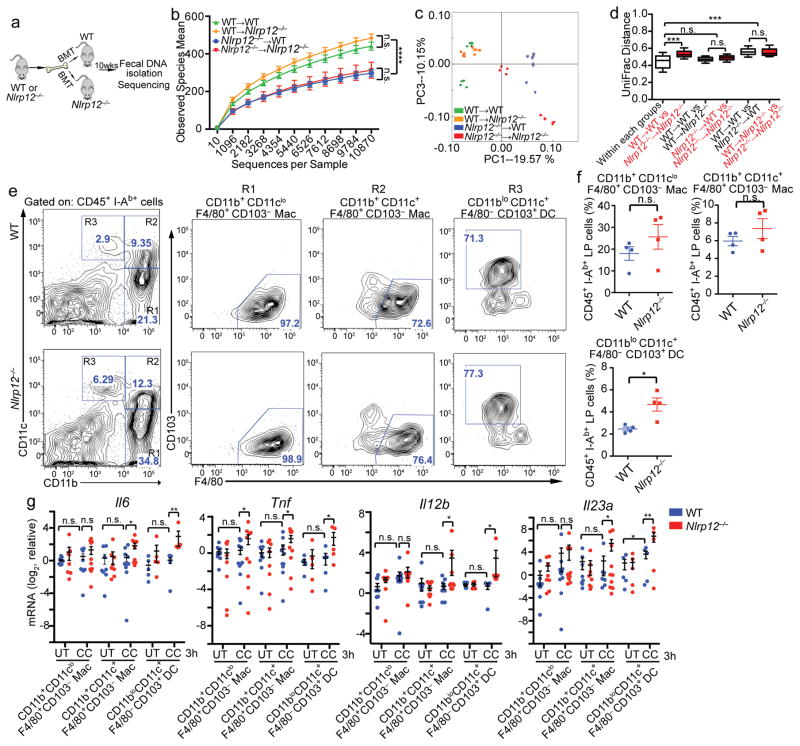
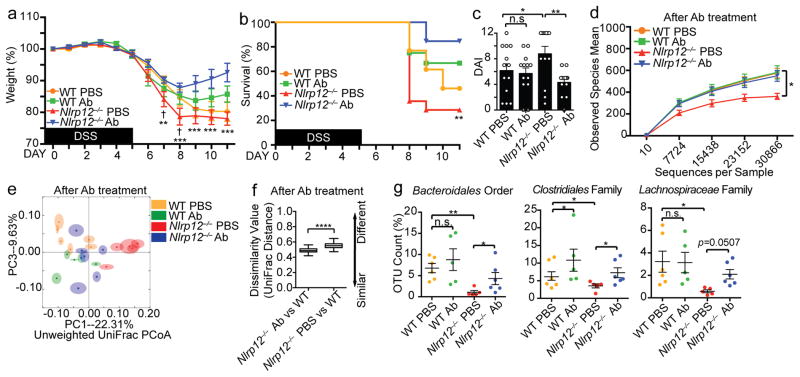
Inflammatory bowel diseases involve the dynamic interaction of host genetics, the microbiome and inflammatory responses. Here we found lower expression of NLRP12 (which encodes a negative regulator of innate immunity) in human ulcerative colitis, by comparing monozygotic twins and other patient cohorts. In parallel, Nlrp12 deficiency in mice caused increased basal colonic inflammation, which led to a less-diverse microbiome and loss of protective gut commensal strains (of the family Lachnospiraceae) and a greater abundance of colitogenic strains (of the family Erysipelotrichaceae). Dysbiosis and susceptibility to colitis associated with Nlrp12 deficency were reversed equally by treatment with antibodies targeting inflammatory cytokines and by the administration of beneficial commensal Lachnospiraceae isolates. Fecal transplants from mice reared in specific-pathogen-free conditions into germ-free Nlrp12-deficient mice showed that NLRP12 and the microbiome each contributed to immunological signaling that culminated in colon inflammation. These findings reveal a feed-forward loop in which NLRP12 promotes specific commensals that can reverse gut inflammation, while cytokine blockade during NLRP12 deficiency can reverse dysbiosis.


Conflict of interest statement

Competing Financial Interests: The authors declare no competing financial interests

Figures

Figure 1
Figure 1
Microbiota differentiates colitis severity between WT and Nlrp12−/− mice. (a) NLRP12 gene expression between 10 pairs of monozygotic healthy and UC twins (left panel). Composite of 8 NCBI GEO ulcerative colitis (UC) studies (right panel) (Supplementary Fig. 1 shows the other seven individual studies). (b) Body weight and (c) percent survival of conventionally-raised mice treated with 3% DSS (WT, n=41; Nlrp12−/−, n=42), compiled from 4 independent experiments. (d) Body weight, (e) percent survival, (f) disease-associated index (DAI) and (g) colon length of germ-free (GF) WT (n=18) and Nlrp12−/− (n=19) mice given 1.5% DSS, compiled from 2 independent experiments. (h) Blinded histopathology scoring of colons (n=6/group). (i–k) Representative immunoblots and densitometry of distal colon proteins from DSS-treated GF mice from 2 independent experiments (n=7/group). (l) Immunoblots and densitometry of distal colon cytosolic (CYTO) and nuclear (NUC) protein fractions from untreated specific-pathogen free (SPF) mice (n=9/group). (m) Schematic comparing GF and conventionalized (exGF) mice. (n–p) Immunoblots and densitometry of distal colon proteins from untreated GF and exGF mice (n,p, n=4/group; o, n=3/group). One dot or one lane represents one mouse. Error bars show SEM. *p<0.05, **p<0.01, ***p<0.001 and ****p<0.0001, and n.s. means no significance by two-tailed paired t test (a, left panel), unpaired t test (a, right panel, b, d, f–l, n–p) or Log-rank (Mantel Cox) test (c and e).
Figure 2
Figure 2
Nlrp12-deficiency results in a dysbiotic colonic microbiome. (a) Bacterial diversity and (b) unweighted UniFrac principal coordinate analysis (PCoA) showing microbiota compositional differences between WT (n=9) and Nlrp12−/− (n=8) mice from one experiment in vivarium #1. A second independent experiment was performed in vivarium #2 (Supplementary Fig. 3). Each symbol represents one mouse. (c) Quantification of UniFrac distance from (b) indicated as dissimilarity values. (d) Bacterial diversity of Nlrp12+/+ (n=10) and Nlrp12−/− (n=14) littermates, compiled from 2 independent experiments. (e) Consistently altered intestinal bacterial groups in Nlrp12−/− vs. WT mice from experiments described in (a–d and Supplementary Fig. 3). (f) Venn diagram showing overlapped microbiota changes between Nlrp12−/− vs. WT mice and IBD vs. healthy individuals (Supplementary Table 4 provides detailed information). Error bars denote SEM. *p<0.05, **p<0.01, ***p<0.001 and ****p<0.0001 determined by two-tailed unpaired t test (a, d, and e) or ANOSIM test (c). The Tukey’s boxplot indicates the first (bottom of the box) and third quartiles (top of the box). The line inside the box represents the median, and the ends of the whiskers indicate the 1.5 interquartile ranges of the upper or lower quartiles (c).
Figure 3
Figure 3
Nlrp12−/− mice co-housed with WT mice display attenuated colitis. (a) Schematic of cohousing (CoHo) vs. single-housing (SiHo) strategy, fecal microbiome sequencing and DSS treatment of WT and Nlrp12−/− mice. (b) Body weight and (c) percent survival ( indicates statistical significance between SiHo WT vs. SiHo Nlrp12−/−, and * indicates significance between SiHo Nlrp12−/− vs. CoHo Nlrp12−/−), (d) DAI and (e) colon length of littermate mice treated as illustrated in (a) (SiHo WT, n=16; SiHo Nlrp12−/−, n=18; CoHo WT, n=12; CoHo Nlrp12−/−, n=12), compiled from 3 independent experiments. (f) Histopathology scoring of colons (n=10/group). (g–i) Representative immunoblots and densitometry of distal colon proteins from the single- and cohoused mice from 3 independent experiments. (j) PCoA plot showing fecal microbial composition after cohousing (n=9/group). (k) Quantification of UniFrac distance between mice from (j) after cohousing, indicated as dissimilarity values. (l) Significantly altered strains identified by two-way ANOVA test from all sequenced bacteria in SiHo WT, SiHo and CoHo Nlrp12−/− mice (n=9/group). One dot or one lane represents one mouse. Error bars show SEM. *p<0.05, **p<0.01, ***p<0.001, ****p<0.0001 and n.s. means no significance determined using two-tailed unpaired t test (b), Log-rank (Mantel Cox) test (c), one-way ANOVA Fisher’s LSD test (d–i), ANOSIM test (k) and two-way ANOVA (l).
Figure 4
Figure 4
Transferring microbiota from Nlrp12−/− mice induces colonic inflammation. (a) Body weight, (b) percent survival, (c) DAI and (d) colon length of GF WT vs. GF Nlrp12−/− mice reconstituted with fecal material (FM) from SPF WT or Nlrp12−/− mice and treated with DSS (FMWT→GF WT, n=11; FMNlrp12−/−→GF WT, n=10; FMWT→GF Nlrp12−/−, n=9; and FMNlrp12−/−→GF Nlrp12−/−, n=9), compiled from 2 independent experiments. (e) Immunoblots and densitometry of distal colon proteins from mice described in (a–d). Error bars show SEM. *p<0.05, **p<0.01, ***p<0.001, ****p<0.0001 and n.s. indicates no significance determined using two-tailed unpaired t test (a, e), Log-rank (Mantel Cox) test (b) and one-way ANOVA Fisher’s LSD test (c–d).
Figure 5
Figure 5
Administration of Lachnospiraceae suppresses colitis in Nlrp12−/− mice. (a) Body weight of WT and Nlrp12−/− mice administered Lachnospiraceae (Lachno) or BHI vehicle (left panel) and DSS (right panel), with (b) DAI and (c) colon length after DSS treatment (WT BHI, n=24; WT Lachno, n=33; Nlrp12−/− BHI, n=22; Nlrp12−/− Lachno, n=22), compiled from 3 independent experiments. (d) Histopathology scoring of BHI- or Lachno-treated mice given DSS (WT BHI, n=4; WT Lachno, n=4; Nlrp12−/− BHI, n=5; Nlrp12−/− Lachno, n=4). (e) Colon explant culture cytokines (WT BHI, n=9; WT Lachno, n=9; Nlrp12−/− BHI, n=14; Nlrp12−/− Lachno, n=8), and (f–h) representative immunoblots with densitometry of distal colon proteins from DSS-treated mice given BHI or Lachno from 3 independent experiments (n=7/group). (i) Bacterial diversity and (j) PCoA plot showing microbiome compositional differences quantified by (k) UniFrac distances among the mice administered Lachno or BHI prior to DSS (WT BHI, n=7; WT Lachno, n=8; Nlrp12−/− BHI, n=7; Nlrp12−/− Lachno, n=8). (l) Significantly altered strains among all identified intestinal bacteria by 16s rRNA gene sequencing following Lachno administration. One dot or one lane represents one mouse. Error bars show SEM. *p<0.05, **p<0.01, ***p<0.001, ****p<0.0001 and n.s. means no significance determined using unpaired t test (a, i), one-way ANOVA Fisher’s LSD test (b–h), ANOSIM test (k) and two-way ANOVA (l).
Figure 6
Figure 6
NLRP12 expression by hematopoietic cells prevents intestinal dysbiosis. (a) Schematic illustrating bone-marrow transplantation (BMT) and fecal DNA collection for microbiome analysis. (b) Bacterial diversity, (c) PCoA plot and (d) UniFrac distance plots showing microbiome compositional differences in WT and Nlrp12−/− mice after BMT (n=8/group), compiled from 2 independent experiments. One dot represents one mouse. (e) Representative concatenated flow cytometry plots, and (f) quantification of colonic lamina propria macrophage and DC subpopulations in SPF mice. Each dot contains pooled cells isolated and sorted from the colons of 2–3 mice. (g) RT-qPCR of proinflammatory cytokines expressed by colon resident macrophages (9 technical replicates/group) and DCs (6 technical replicates/group) stimulated with cecal contents, compiled from 2 independent experiments. Error bars show SEM. *p<0.05, **p<0.01, ***p<0.001, ****p<0.0001 and n.s. means no significance determined using two-tailed unpaired t test (b, f and g) and ANOSIM test (d).
Figure 7
Figure 7
Anti-IL-6R and anti-TNF suppresses colitis and restores the missing bacterial groups in Nlrp12−/− mice. (a) Body weight, (b) percent survival ( indicates statistical significance between WT PBS vs. Nlrp12−/− PBS; * indicates significance between Nlrp12−/− PBS vs. Nlrp12−/− Ab) and (c) DAI of DSS-treated WT and Nlrp12−/− mice injected i.p. with anti-IL-6R and anti-TNF antibodies (Ab) or PBS (n=13/group), compiled from 3 independent experiments. (d) Intestinal microbial diversity, and (e) PCoA showing microbiota compositional differences in Ab-treated WT and Nlrp12−/− mice (n=6/group). (f) Quantification of UniFrac distances from (e). (g) Significantly altered groups from sequenced bacteria in Ab- vs. PBS-treated animals. Error bars show SEM. *p<0.05, **p<0.01, ***p<0.001, ****p<0.0001 and n.s. indicates no significance determined by two-tailed unpaired t test (a and d), Log-rank (Mantel Cox) test (b), one-way ANOVA Fisher’s LSD test (c), ANOSIM test (f) or two-way ANOVA (g).

Comment in

References

    1. Kau AL, Ahern PP, Griffin NW, Goodman AL, Gordon JI. Human nutrition, the gut microbiome and the immune system. Nature. 2011;474:327–336. - PMC - PubMed
    1. Karrasch T, Jobin C. NF-kappaB and the intestine: friend or foe? Inflamm Bowel Dis. 2008;14:114–124. - PubMed
    1. Hugot JP, et al. Association of NOD2 leucine-rich repeat variants with susceptibility to Crohn’s disease. Nature. 2001;411:599–603. - PubMed
    1. Ogura Y, et al. A frameshift mutation in NOD2 associated with susceptibility to Crohn’s disease. Nature. 2001;411:603–606. - PubMed
    1. Couturier-Maillard A, et al. NOD2-mediated dysbiosis predisposes mice to transmissible colitis and colorectal cancer. J Clin Invest. 2013;123:700–711. - PMC - PubMed

Publication types

MeSH terms

Substances