Observational Study
. 2017 Apr;35(4):354-362.
doi: 10.1038/nbt.3826. Epub 2017 Mar 13.

The Asthma Mobile Health Study, a large-scale clinical observational study using ResearchKit

Affiliations
Observational Study

The Asthma Mobile Health Study, a large-scale clinical observational study using ResearchKit

Yu-Feng Yvonne Chan et al. Nat Biotechnol. 2017 Apr.

Abstract

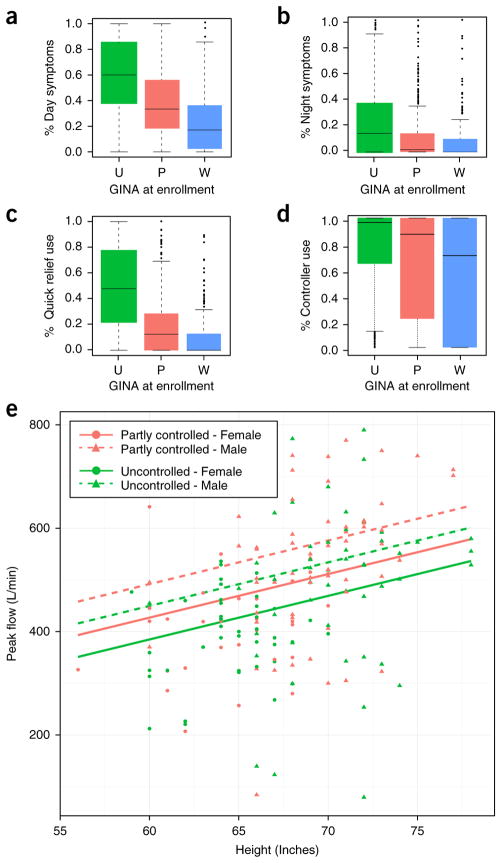
The feasibility of using mobile health applications to conduct observational clinical studies requires rigorous validation. Here, we report initial findings from the Asthma Mobile Health Study, a research study, including recruitment, consent, and enrollment, conducted entirely remotely by smartphone. We achieved secure bidirectional data flow between investigators and 7,593 participants from across the United States, including many with severe asthma. Our platform enabled prospective collection of longitudinal, multidimensional data (e.g., surveys, devices, geolocation, and air quality) in a subset of users over the 6-month study period. Consistent trending and correlation of interrelated variables support the quality of data obtained via this method. We detected increased reporting of asthma symptoms in regions affected by heat, pollen, and wildfires. Potential challenges with this technology include selection bias, low retention rates, reporting bias, and data security. These issues require attention to realize the full potential of mobile platforms in research and patient care.


Conflict of interest statement

COMPETING FINANCIAL INTERESTS

The authors declare competing financial interests: details are available in the online version of the paper.

Figures

Figure 1
Figure 1
Recruitment process, user experience, and geographic distribution. The flow chart on the left indicates the recruitment process. The upper-right panel illustrates the activities experienced by users of AHA. The map illustrates the geographic distribution of Baseline users (i.e., Enrolled users who submitted at least one study survey). The box in the bottom outlines the selection of several of the key sub-cohorts used in our analyses, along with their sample sizes (see Supplementary Fig. 1a for more details).
Figure 2
Figure 2
Enrollment and retention over time for Robust users. (ac) The distributions of gender and GINA control (a), the frequency of activity limitation (b), and the frequency of daily asthma symptoms (c) are all significantly different between the first and the second halves of the study. Specifically, in the latter half of the study, the Robust users have a higher percentage of females (chi-squared = 4.74, d.f. = 1, P = 0.03, and n = 719), a higher percentage of users with uncontrolled asthma (chi-squared = 8.97, P = 0.01, and n = 2,295), and an increased frequency of symptoms (chi-squared = 22.3, d.f. = 5, P = 0.001, n = 2,308) and activity limitation (chi-squared = 36.9, d.f. = 5, P = 0.0004, n = 2,308). (d,e) Daily survey participation survival curves stratified by study entry month and reported age (Robust users, n = 537 participants, >90 d of post-enrollment follow-up). (d) Kaplan-Meier survival curve of daily survey participation stratified by study entry month and excluding participants entering after May (n = 15 participants). Study entry month of the participant was statistically significantly associated with daily survey participation longevity using a Cox proportional hazards model, P = 2.99−23, hazard ratio 1.847 (95% CI, 1.64–2.08) for each passing month. (e) Kaplan-Meier survival curve of daily survey participation stratified by age (18–40 years and >40 years of age). Age was statistically significantly associated with daily survey participation longevity using a Cox proportional hazards model, P = 1.59 × 10⁻⁷, hazard ratio 0.976 (95% CI, 0.806–0.96) for each additional year of age. Colored bands show 95% confidence intervals for each strata.
Figure 3
Figure 3
Concordance between GINA control at enrollment and prospectively collected daily symptoms reports during the study. (ad) Distributions of frequencies of daytime symptoms (Kruskal–Wallis test; H(2) = 471.94, P < 2.2−16, n = 2,295) (a), nighttime symptoms (Kruskal–Wallis test; H(2) = 232.23, P < 2.2−16, n = 2,295) (b), inhaler puffs usage (Kruskal–Wallis test; H(2) = 677.12, P < 2.2−16, n = 2,295) (c), and controller medicine usage (Kruskal–Wallis test; H(2) = 63.73, P = 1.4−14, n = 2,285), and (d) among Robust users stratified according to their GINA control level at enrollment. (U, uncontrolled; P, partly controlled; W, well controlled). (e) Based on data from 183 Robust users, the lines illustrate a multiple linear regression model for peak flow trained on users’ daily peak flow responses, GINA control assessed at enrollment, and HealthKit physique data, which demonstrates that male sex (β = 64.847, t(179) = 2.836, P = 0.005), controlled asthma β = 42.224, t(179) = 2.364, P = 0.02), and height (β = 8.435, t(179) = 2.695, P = 0.002) are associated with greater peak flows.
Figure 4
Figure 4
Geographic and seasonal trends in asthma triggers for Robust users. (a) The percentages of users reporting pollen, extreme heat or air quality as an asthma trigger (y axis) for southern (red) and northern (blue) regions of the contiguous US in the spring (March–May) and summer (Jun–Aug) respectively (based on n = 545 Robust users). (b) The percentage of users reporting pollen as an asthma trigger (solid) and the monthly pollen level (dashed) for southern (red) and northern (blue) regions of the US (based on n = 64 Robust users). (c) The percentage of users reporting extreme heat as their asthma triggers in southern and northern US regions for the spring and summer months (based on n = 545 Robust users). (d) The percentage of users reporting air quality as an asthma trigger for Washington state wildfires (solid, left y axis) and daily PM2.5 concentration (dashed, right-axis) in the same area (based on n = 37 Robust users). In (bd), the shaded regions represent the ± 1 s.d. interval bands.
Figure 5
Figure 5
Positive impact of the app on user group. (a) The percentage of users reporting activity-limitation in their first week versus their last week in the summer (top, based on n = 331 Robust users) and in the entire 6-month study period (bottom, based on n = 1,926 Robust users). (b) The percent distribution of GINA control for all cohorts at enrollment (top three) and after 6-months of study participation (bottom). (c) Feedback and Milestone survey results based on data from Milestone users.

Comment in

References

    1. Topol EJ, Steinhubl SR, Torkamani A. Digital medical tools and sensors. J Am Med Assoc. 2015;313:353–354. - PMC - PubMed
    1. Ritter S. Apple’s research kit development framework for iPhone apps enables innovative approaches to medical research data collection. J Clin Trials. 2015;5:2–3.
    1. Jardine J, Fisher J, Carrick B. Apple’s ResearchKit: smart data collection for the smartphone era? J R Soc Med. 2015;108:294–296. - PMC - PubMed
    1. Morgan A, Mooney S, Aronow B, Brenner S. Precision Medicine: Data and Discovery for Improved Health and Therapy. [Accessed May 7, 2016];Pacific Symposium on Biocomputing. 2016 http://psb.stanford.edu/psb-online/proceedings/psb16/intro-pm.pdf. - PMC - PubMed
    1. Savage N. Mobile data: Made to measure. Nature. 2015;527:S12–S13. - PubMed

Publication types

MeSH terms