. 2017 Apr;14(4):427-434.
doi: 10.1038/nmeth.4221. Epub 2017 Mar 13.

Genetically encoded biosensors for visualizing live-cell biochemical activity at super-resolution

Affiliations

Genetically encoded biosensors for visualizing live-cell biochemical activity at super-resolution

Gary C H Mo et al. Nat Methods. 2017 Apr.

Abstract

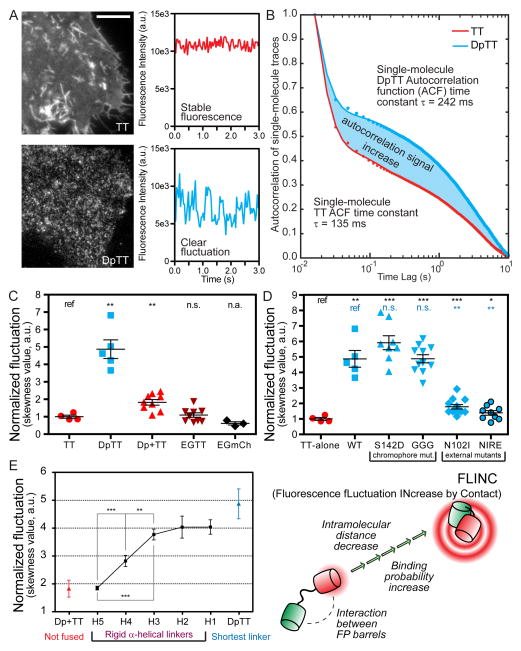
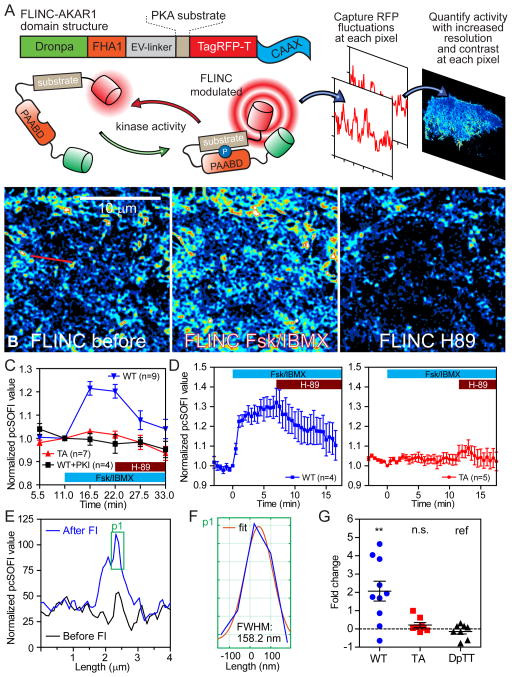
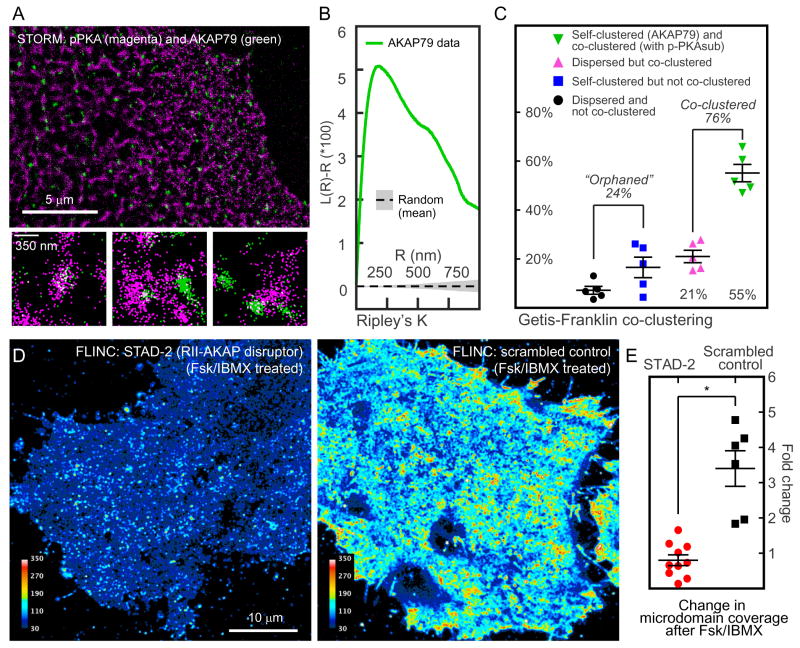
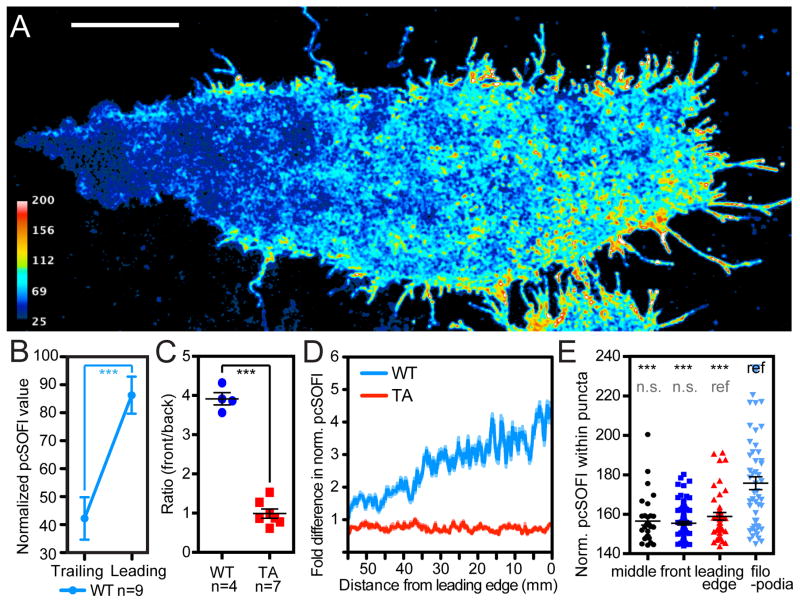
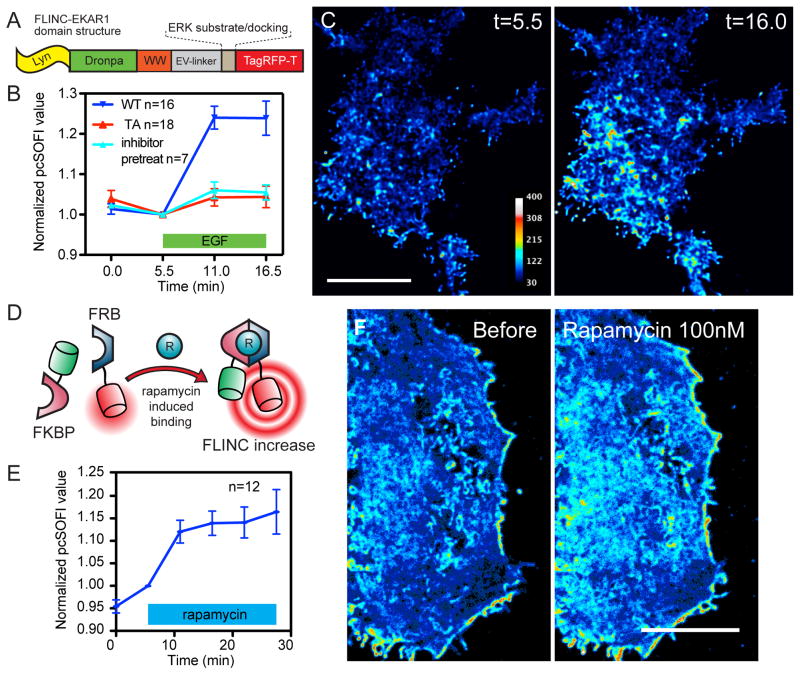
Compartmentalized biochemical activities are essential to all cellular processes, but there is no generalizable method to visualize dynamic protein activities in living cells at a resolution commensurate with cellular compartmentalization. Here, we introduce a new class of fluorescent biosensors that detect biochemical activities in living cells at a resolution up to threefold better than the diffraction limit. These 'FLINC' biosensors use binding-induced changes in protein fluorescence dynamics to translate kinase activities or protein-protein interactions into changes in fluorescence fluctuations, which are quantifiable through stochastic optical fluctuation imaging. A protein kinase A (PKA) biosensor allowed us to resolve minute PKA activity microdomains on the plasma membranes of living cells and to uncover the role of clustered anchoring proteins in organizing these activity microdomains. Together, these findings suggest that biochemical activities of the cell are spatially organized into an activity architecture whose structural and functional characteristics can be revealed by these new biosensors.


Figures

Figure 1
Figure 1. TagRFP-T (TT) red fluorescence fluctuations can be increased by proximity of Dronpa (Dp) in a distance-dependent manner
(A) Representative images and single-pixel fluorescence intensity traces in HeLa cells expressing DpTT (Dronpa-linker-TagRFP-T) and TagRFP-T alone when excited by 561 nm laser; Scale bar: 10 μm. (B) Aggregated mean normalized autocorrelation function (ACF) of many single molecule fluorescence traces from purified fluorescent DpTT and TagRFP-T. The amplitude increase demonstrates the clear gain in autocorrelation signal from increased millisecond fluctuations of DpTT. (C) Quantified fluctuation in various constructs demonstrating the specific nature of the fluctuation increase; n (cell) numbers are: TT (n = 8), DpTT (n = 7), Dp+TT (n = 9), EGTT (EGFP-linker-TagRFP-T, n = 8), and EGFP-linker-mCherry (EGmCh, n = 9). (D) Quantified fluctuation in various mutant constructs demonstrating Dronpa’s chromophore is not involved but external Dronpa residues are important for the phenomenon. n (cell) numbers are: TT-alone (n = 8), WT (n = 7); chromophore mutants: Dp[S142D]-TT (S142D, n = 8), Dp[C62G/Y63G]-TT (GGG, n = 11); FP surface mutants: Dp[N102I]-TT (N102I, n = 12), Dp[N102I/R149E]-TT (NIRE, n = 9). (E) A variable number of rigid helical repeats permit measurement of distance dependence and sensitivity of the change in fluctuation. Hn represents the number (n) of rigid (EAAAK) repeats; DpTT (short linker) and Dp+TT (not fused) were included as comparisons. H2–H5 linkers are marked with nominal FP distances reported in literature. All constructs in (E) were targeted to the plasma membrane of HeLa cells by the lyn sequence and examined at the n (cell) numbers as follows: DpTT (n = 5), H1 (n = 7), H2 (n = 6), H3 (n = 14), H4 (n = 17), H5 (n = 10), Dp+TT (n = 9). Pair-wise t-test results in (C), (D), and (E) are marked where data were compared with the construct marked “ref”. n.s.: not-significant; *: p<0.05; **: p<0.01; ***: p<0.001 where applicable. In all dot plots and (E), center line and whiskers mark the average and s.e.m. values, respectively.
Figure 2
Figure 2. FLINC resolves PKA activity microdomains on the plasma membrane at superresolution
(A) Schematic of the FLINC-KAR design principle, the domain structure of FLINC-AKAR1, and the acquisition of superresolution activity images using pcSOFI. (B) FLINC-AKAR1 superresolution images clearly resolves the response to Fsk/IBMX stimulation (Fsk 50 μM, IBMX 100 μM) and inhibition (H-89 20 μM), and detailed spatial information on membrane PKA activity emerges. Color scale are identical. (C) The mean normalized pcSOFI response time course from live HeLa cells expressing wild-type (WT, n = 9 cells) FLINC-AKAR1, non-phosphorylatable mutant (TA, n = 7), and WT co-expressed with PKI (WT+PKI, n = 4) upon PKA stimulation and inhibition. (D) The normalized pcSOFI responses time course from live HeLa cells expressing wild-type (WT, n = 4) FLINC-AKAR1 and non-phosphorylatable mutant (TA, n = 5) upon PKA stimulation and inhibition using a fast acquisition imaging scheme. (E) A profile line at the same position across the pcSOFI images before and after Fsk/BIMX (“FI”) stimulation clearly demonstrate sensing of PKA activity at superresolution; the profile has been marked by a red line in B. (F) Zoom view of the active PKA feature in F showing the Gaussian fitting and FWHM size of this sub-diffraction limit PKA activity microdomain resolved. (G) A comparison of the changes in the fraction of membrane area occupied by punctate structures after stimulation across various FLINC constructs, all targeted using the same CAAX motif. In FLINC-AKAR1 experiments (WT, n = 10; TA, n = 8), cells were stimulated with Fsk/IBMX; DpTT experiments (n = 8) received no drug treatment. Unless indicated otherwise, pair-wise t-test results are marked where data were compared with the construct marked “ref”. n.s.: not-significant; *: p<0.05; **: p<0.01; ***: p<0.001 where applicable. In (C) and (D), center line and whiskers mark the average and s.e.m. values, respectively.
Figure 3
Figure 3. A Kinase Anchoring Proteins (AKAPs) are co-clustered with PKA activity microdomains and are required for their formation
(A) A representative two-color STORM image of p-PKAsub (magenta) and AKAP79 (green) with specific examples of p-PKAsub/AKAP79 relationship beneath. (B) Ripley’s K analysis of AKAP79 localizations show clear clustering above random sampling. (C) Getis-Franklin co-clustering analyses of the two-color STORM images identify populations with different p-PKAsub/AKAP79 relationships; a majority (55 + 21 = 76%) of AKAP79 are associated with p-PKAsub (n = 5 cells). (D) Representative live cell superresolution FLINC-AKAR1 images of stimulated PKA activity after the disruption of AKAP-PKA RII interactions using a synthetic AKAP disruptor, STAD-2, in comparison with its scrambled control. Scale bar: 10 μm. The color scales are identical. (E) The effect of RII-AKAP disruption on PKA activity microdomains quantified by fold change in microdomain coverage. Cells were either pretreated with STAD-2 (n = 10) or scrambled peptide control (n = 6) before Fsk/IBMX stimulation. Unless indicated otherwise, pair-wise t-test results are marked where data were compared with the construct marked “ref”; n numbers are marked inside the corresponding bars. n.s.: not-significant; *: p<0.05; **: p<0.01 where applicable. In (C) and (E), center line and whiskers mark the average and s.e.m. values, respectively.
Figure 4
Figure 4. PKA activity gradient of a migrating cell at superresolution
(A) The PKA activity gradient in a migrating α4CHO cell expressing the wild-type (WT) FLINC-AKAR1. Scale bar: 10 μm. (B) Average normalized pcSOFI values within leading/trailing edge regions of migrating cells show clearly different PKA activities. (C) Migrating α4CHO cells expressing wild-type FLINC-AKAR1 show a significant gradient in terms of normalized pcSOFI values compared to cells expressing non-phosphorylatable TA mutant. Pair-wise t-test results are marked. (D) Representative PKA activity profile observed along the migration direction using FLINC-AKAR1 and its TA mutant. (E) Representative data showing that active microdomains within the filopodia harbor significantly higher PKA activity compared to elsewhere on the basal membrane of migrating CHO cells; basal membrane regions are indicated for their increasing distance from the leading edge of the migration direction (filopodia, leading-edge, front, and middle) (n = 9 cells). Unless indicated otherwise, pair-wise t-test results are marked where data were compared with the construct marked “ref”. n.s.: not-significant; *: p<0.05; **: p<0.01 where applicable. In (C) and (E), center line and whiskers mark the average and s.e.m. values, respectively.
Figure 5
Figure 5. FLINC-based design is generalizable
(A) The domain structure of FLINC-EKAR1. (B) The normalized pcSOFI response time course from live HEK293 cells expressing wild-type FLINC-EKAR1 (WT, n = 16 cells), non-phosphorylatable mutant (TA, n = 18) FLINC-EKAR1, and cells expressing WT but pre-treated with the ERK upstream inhibitor U0126 (20 μM; inhibitor-pretreat, n = 7), all subjected to growth-factor stimulation (EGF 100 μM). (C) Representative superresolution images of ERK activity dynamics after growth-factor stimulation and chemical inhibition. Scale bar: 10 μm. (D) Schematic of the design and (E) Normalized pcSOFI time course of the bimolecular protein-protein interaction sensor based on FKBP-rapamycin-FRB (n = 12) in response to rapamycin (100 nM). (F) Normalized pcSOFI images of a HeLa cell before and after stimulation with rapamycin to induce the dimerization between FKBP and FRB. Scale bars: 10 μm. The color scales for the before/after images are identical within panels (C) and (F), respectively.

References

    1. Avraham R, Yarden Y. Feedback regulation of EGFR signalling: decision making by early and delayed loops. Nature Reviews Molecular Cell Biology. 2011;12:104–117. - PubMed
    1. Ganesan A, Zhang J. How cells process information: Quantification of spatiotemporal signaling dynamics. Protein Science. 2012;21:918–928. - PMC - PubMed
    1. Wong W, Scott JD. AKAP signalling complexes: Focal points in space and time. Nature Reviews Molecular Cell Biology. 2004;5:959–970. - PubMed
    1. Rizzuto R, Pozzan T. Microdomains of intracellular Ca2+: Molecular determinants and functional consequences. Physiol Rev. 2006;86:369–408. - PubMed
    1. Cambi A, Lidke DS. Nanoscale Membrane Organization: Where Biochemistry Meets Advanced Microscopy. Acs Chemical Biology. 2012;7:139–149. - PMC - PubMed

METHODS-ONLY REFERENCES

    1. Sawano A, Miyawaki A. Directed evolution of green fluorescent protein by a new versatile PCR strategy for site-directed and semi-random mutagenesis. Nucleic acids research. 2000;28:E78–E78. - PMC - PubMed
    1. Ovesny M, Krizek P, Borkovec J, Svindrych ZK, Hagen GM. ThunderSTORM: a comprehensive ImageJ plug-in for PALM and STORM data analysis and super-resolution imaging. Bioinformatics. 2014;30:2389–2390. - PMC - PubMed
    1. Dean KM, et al. Analysis of Red-Fluorescent Proteins Provides Insight into Dark-State Conversion and Photodegradation. Biophysical Journal. 2011;101:961–969. - PMC - PubMed
    1. Manna P, Jimenez R. Time and Frequency-Domain Measurement of Ground-State Recovery Times in Red Fluorescent Proteins. Journal of Physical Chemistry B. 2015;119:4944–4954. - PubMed

MeSH terms

Substances