Variation in Physician Spending and Association With Patient Outcomes
- PMID: 28288254
- PMCID: PMC5470365
- DOI: 10.1001/jamainternmed.2017.0059
Variation in Physician Spending and Association With Patient Outcomes
Abstract
Importance: While the substantial variation in health care spending across regions and hospitals is well known, key clinical decisions are ultimately made by physicians. However, the degree to which spending varies across physicians and the clinical consequences of that variation are unknown.
Objective: To investigate variation in spending across physicians and its association with patient outcomes.
Design, setting, and participants: For this retrospective data analysis, we analyzed a 20% random sample of Medicare fee-for-service beneficiaries 65 years and older who were hospitalized with a nonelective medical condition and treated by a general internist between January 1, 2011, and December 31, 2014. We first quantified the proportion of variation in Medicare Part B spending attributable to hospitals, physicians, and patients. We then examined the association between physician spending and patient outcomes, adjusted for patient and physician characteristics and hospital fixed effects (effectively comparing physicians within the same hospital). Our primary analysis focused on hospitalist physicians, whose patients are plausibly quasirandomized within a hospital based on physician work schedule. A secondary analysis focused on general internists overall. To ensure that patient illness severity did not directly affect physician spending estimates, we calculated physicians' spending levels in 2011 through 2012 and examined outcomes of their patients in 2013 and 2014.
Exposures: Physicians' adjusted Part B spending level in 2011 through 2012.
Main outcomes and measures: Patients' 30-day mortality and readmission rates in 2013 and 2014.
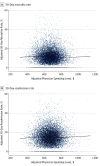
Results: To determine the amount of variation across physicians we included 485 016 hospitalizations treated by 21 963 physicians at 2837 acute care hospitals for the analysis of hospitalists and 839 512 hospitalizations treated by 50 079 physicians at 3195 acute care hospitals for the analysis of general internists. Variation in spending across physicians within hospital was larger than variation across hospitals (for hospitalists, 8.4% across physicians vs 7.0% across hospitals; for general internists, 10.5% across physicians vs 6.2% across hospitals). Higher physician spending was not associated with lower 30-day mortality (adjusted odds ratio [aOR] for additional $100 in physician spending, 1.00; 95% CI, 0.98-1.01; P = .47) or readmissions (aOR, 1.00; 95% CI, 0.99-1.01; P = .54) for hospitalists within the same hospital. We observed similar patterns among general internists.
Conclusions and relevance: Health care spending varies more across individual physicians than across hospitals. However, higher physician spending is not associated with better outcomes of hospitalized patients. Our findings suggest policies targeting both physicians and hospitals may be more effective in reducing wasteful spending than policies focusing solely on hospitals.
Conflict of interest statement
Figures


Comment in
-
Physician Spending and Patient Outcomes.JAMA Intern Med. 2017 May 1;177(5):682. doi: 10.1001/jamainternmed.2017.0068. JAMA Intern Med. 2017. PMID: 28288251 No abstract available.
References
Publication types
MeSH terms
Grants and funding
LinkOut - more resources
Full Text Sources
Other Literature Sources

