. 2017 May 16;37(11):e00027-17.
doi: 10.1128/MCB.00027-17. Print 2017 Jun 1.

Coordinated Hsp110 and Hsp104 Activities Power Protein Disaggregation in Saccharomyces cerevisiae

Affiliations

Coordinated Hsp110 and Hsp104 Activities Power Protein Disaggregation in Saccharomyces cerevisiae

Jayasankar Mohanakrishnan Kaimal et al. Mol Cell Biol. .

Abstract

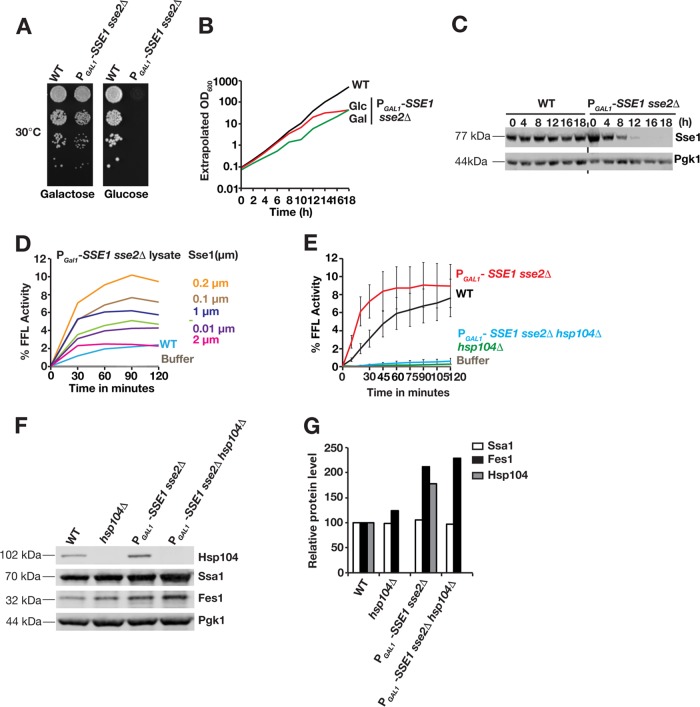
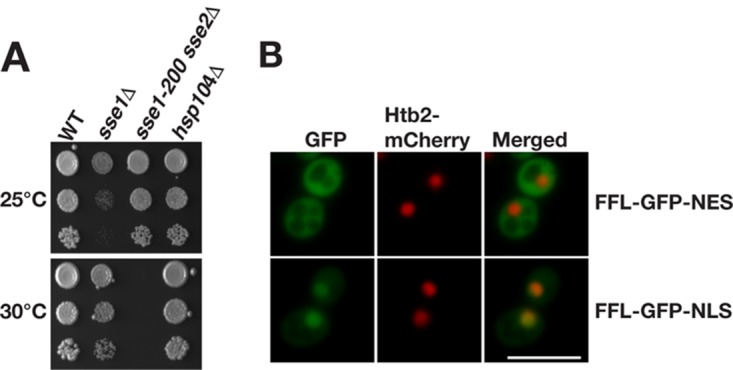
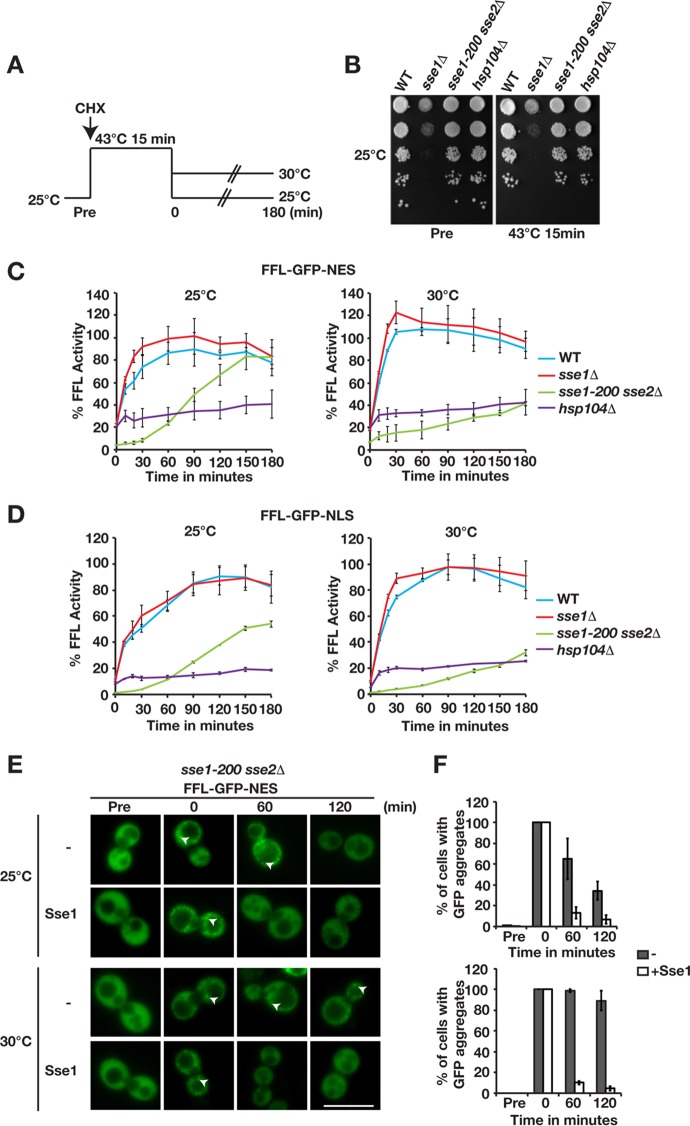
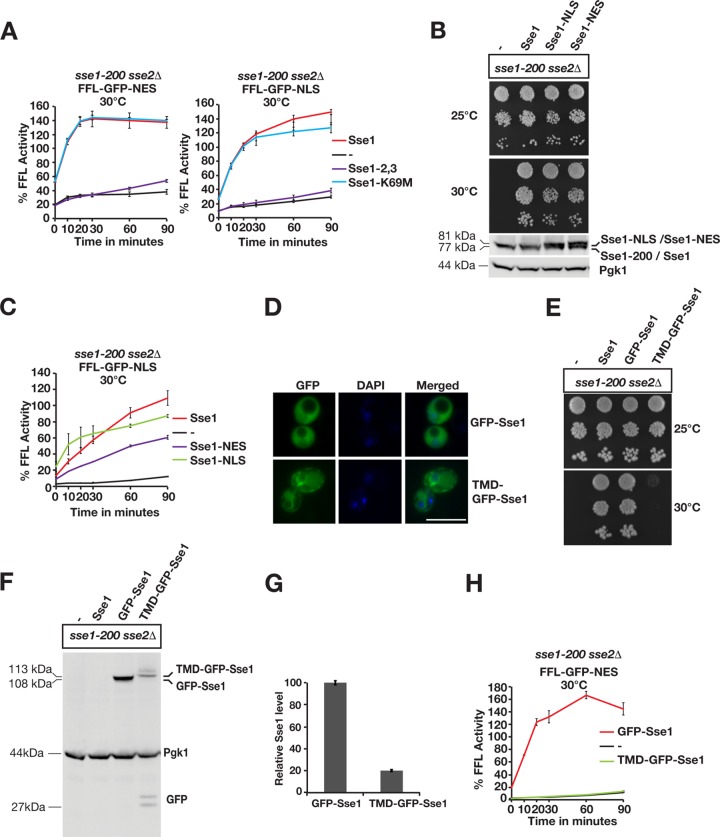
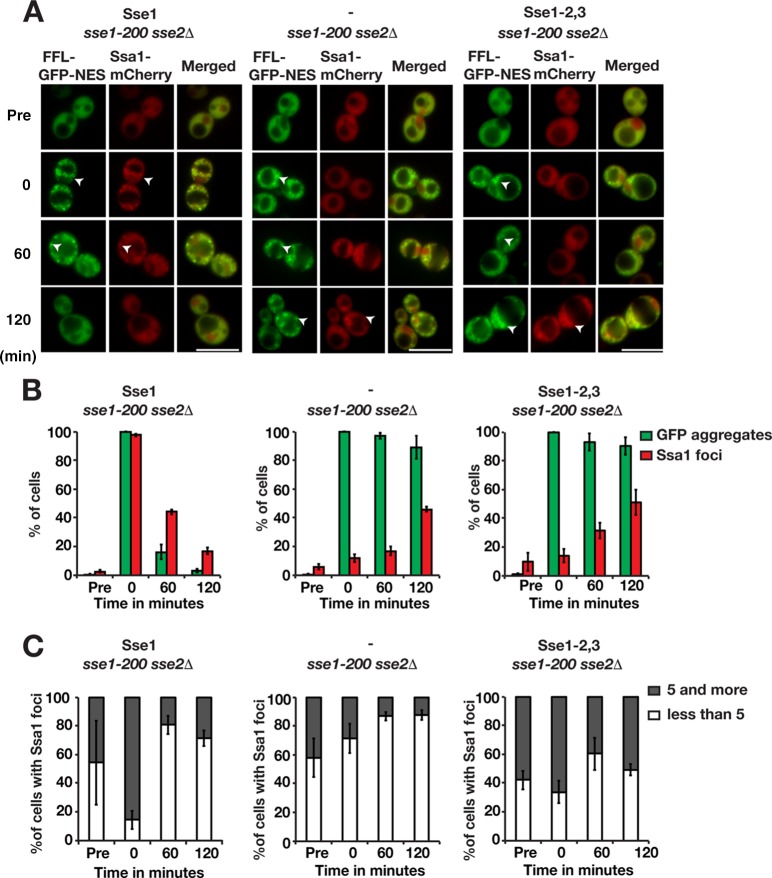
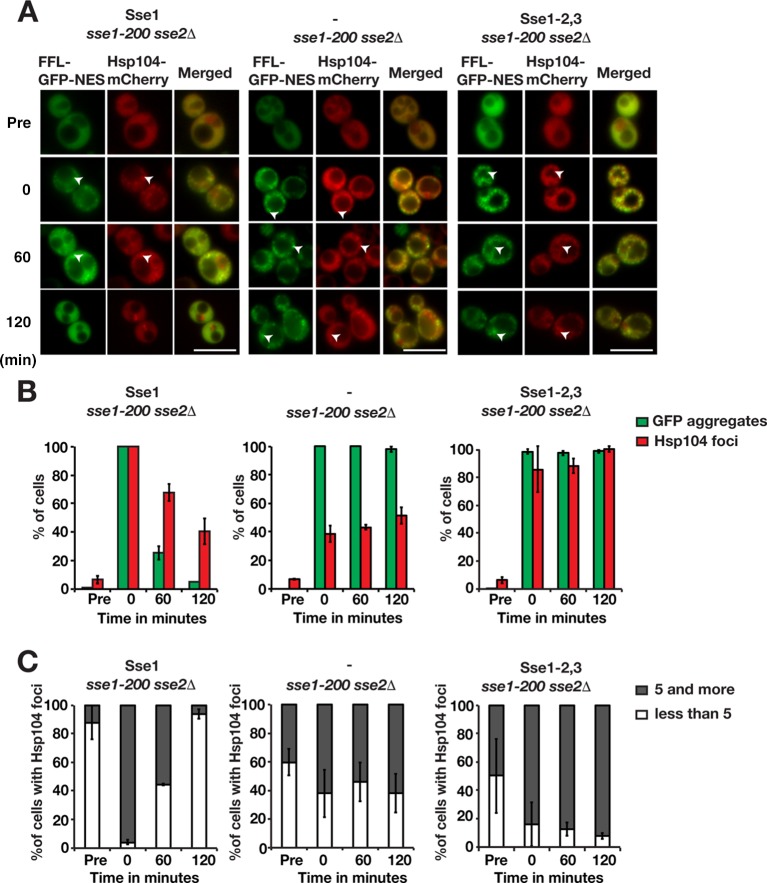
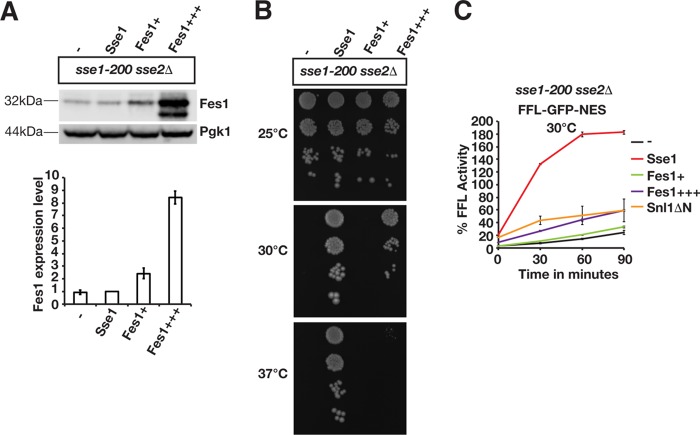
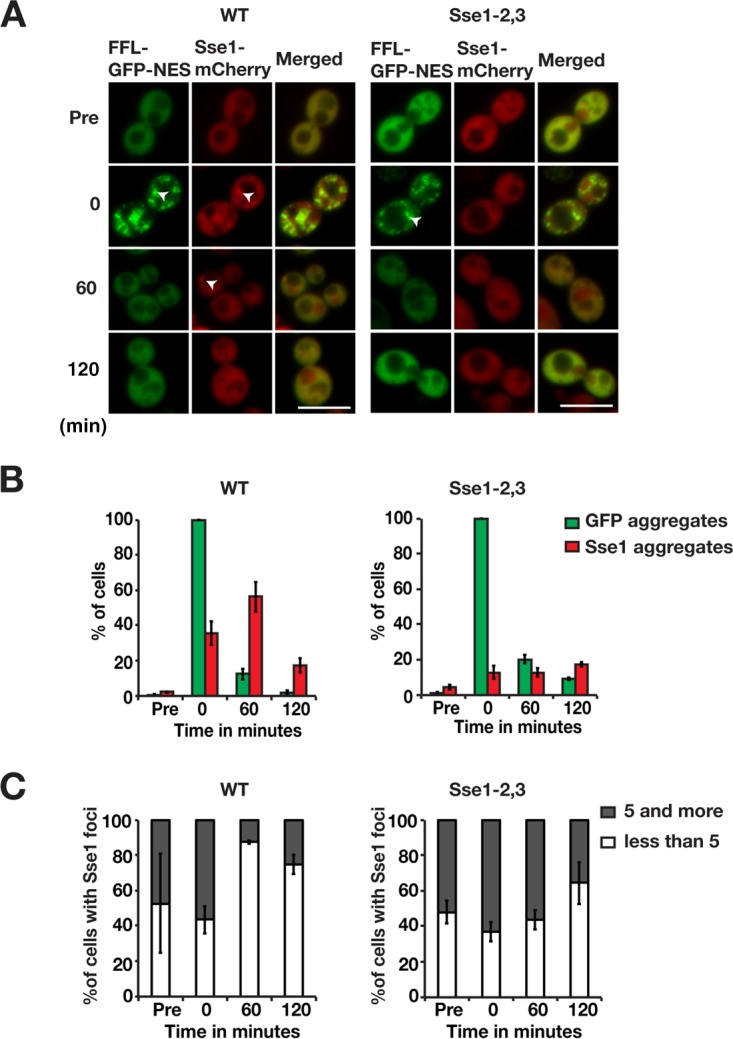
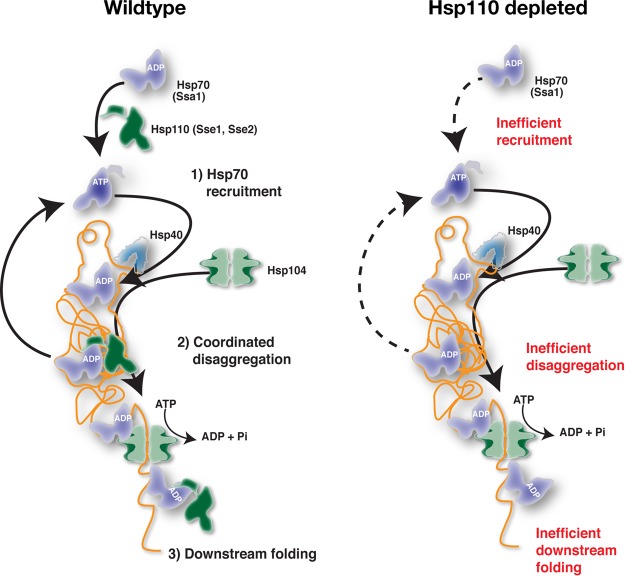
Protein aggregation is intimately associated with cellular stress and is accelerated during aging, disease, and cellular dysfunction. Yeast cells rely on the ATP-consuming chaperone Hsp104 to disaggregate proteins together with Hsp70. Hsp110s are ancient and abundant chaperones that form complexes with Hsp70. Here we provide in vivo data showing that the Saccharomyces cerevisiae Hsp110s Sse1 and Sse2 are essential for Hsp104-dependent protein disaggregation. Following heat shock, complexes of Hsp110 and Hsp70 are recruited to protein aggregates and function together with Hsp104 in the disaggregation process. In the absence of Hsp110, targeting of Hsp70 and Hsp104 to the aggregates is impaired, and the residual Hsp104 that still reaches the aggregates fails to disaggregate. Thus, coordinated activities of both Hsp104 and Hsp110 are required to reactivate aggregated proteins. These findings have important implications for the understanding of how eukaryotic cells manage misfolded and amyloid proteins.

Keywords: Hsp104; Hsp110; Ssa1; Sse1; Sse2; chaperone; heat shock; protein disaggregation; protein folding; protein misfolding; protein quality control; stress proteins.


Figures

FIG 1
FIG 1
Sse1 accelerates Hsp104-dependent reactivation of chemically aggregated firefly luciferase in cytosolic lysates. (A) Growth of WT and PGAL1-SSE1 sse2Δ strains on media with galactose and glucose as carbon sources. Tenfold serially diluted cell suspensions were plated, and photographs were taken following 3 days of incubation at 30°C. (B) Growth of the strains in panel A was monitored by optical density determinations (extrapolated optical density at 600 nm [OD600]) following inoculation of cells in liquid glucose and galactose media. Cells were regularly diluted in prewarmed fresh medium to avoid the effects of nutrient depletion. (C) Western analysis of Sse1 expression levels following the transfer of cells from galactose medium to glucose medium as described above for panel B. Pgk1 functions as a loading control. (D) Reactivation of chemically aggregated firefly luciferase by cytosolic lysates prepared from WT and Sse1-depleted PGAL1-SSE1 sse2Δ cells grown for 18 h in glucose medium. Purified Sse1 was added to the Sse1-depleted lysates at the indicated concentrations. The reactivated fraction of the original firefly luciferase activity (% FFL Activity) was determined by luminescence measurements. (E) Reactivation of chemically aggregated firefly luciferase by cytosolic lysates prepared from WT, hsp104Δ, PGAL1-SSE1 sse2Δ, and PGAL1-SSE1 sse2Δ hsp104Δ cells grown for 18 h in glucose medium. The reactivated fraction of the original firefly luciferase activity (% Activity) was determined by bioluminescence measurements. Error bars indicate standard errors of data from triplicate experiments. (F) Western analysis of the cytosolic lysates used for panel A. (G) Quantification of the relative expression levels in panel B.
FIG 2
FIG 2
Temperature-sensitive phenotype of sse1-200 sse2Δ cells and localization of firefly luciferase reporters. (A) Growth of WT, sse1Δ, sse1-200 sse2Δ, and hsp104Δ strains after 3 days at 25°C and 30°C. (B) Micrographs showing the localization of the firefly luciferase fusion proteins FFL-GFP-NES and FFL-GFP-NLS. Histone 2B fused to mCherry (Htb2-mCherry) functions as a nuclear marker. Bar = 5 μm.
FIG 3
FIG 3
Sse1 and Sse2 are essential for Hsp104-dependent reactivation of heat-aggregated firefly luciferase. (A) Schematic representation of the in vivo firefly luciferase reactivation assay. Cells expressing firefly luciferase fused to GFP were pregrown to the logarithmic phase at 25°C. Translation was arrested by the addition of cycloheximide (CHX) followed by 15 min of heat shock at 43°C and recovery at 25°C or 30°C. (B) WT, sse1Δ, sse1-200 sse2Δ, and hsp104Δ cells growing at 25°C (Pre) were subjected to heat shock at 43°C for 15 min, and viability was assessed by the ability of cells to form colonies at 25°C. Photographs were taken 3 days after platting. (C) Reactivation of cytosolic firefly luciferase (FFL-GFP-NES) was monitored by bioluminescence measurements. Error bars represent standard errors of data from triplicate experiments. (D) Reactivation of nuclear firefly luciferase (FFL-GFP-NLS) was monitored as described above for panel C. (E) Micrographs of the disaggregation of FFL-GFP-NES in sse1-200 sse2Δ cells transformed with either a centromeric plasmid vector (−) or a derivative that expresses Sse1. Arrowheads show aggregates. Bar = 5 μm. (F) Quantification of the results shown in panel E. Error bars represent standard errors of data from biological triplicates with ≥100 cells for each time point.
FIG 4
FIG 4
Sse1-dependent protein disaggregation requires interaction with Hsp70 and is compartment specific. (A) Reactivation of cytosolic firefly luciferase (FFL-GFP-NES) and nuclear firefly luciferase (FFL-GFP-NLS) in sse1-200 sse2Δ cells was monitored at 30°C after a 15-min heat shock at 43°C by bioluminescence measurements. Cells were transformed with either a centromeric plasmid vector (−) or derivatives that express Sse1, Sse1-2,3, or Sse1-K69M. Error bars represent standard errors of data from triplicate experiments. (B) Growth of sse1-200 sse2Δ cells transformed with an empty plasmid vector (−) or derivatives that express Sse1, Sse1-NLS, or Sse1-NES. Photographs of plates were taken 3 days after incubation at 25°C and 30°C. Western blots show the relative expression levels of the Sse1 variants in the strains. (C) Reactivation of nuclear firefly luciferase (FFL-GFP-NLS) was monitored as described above for panel A, but cells were transformed with either a centromeric plasmid vector or derivatives that express Sse1, Sse1-NLS, or Sse1-NES. (D) Fluorescence microscopy image showing the localization of GFP-Sse1 and TMD-GFP-Sse1 in sse1-200 sse2Δ cells grown at 25°C. DNA was stained with DAPI (4′,6-diamidino-2-phenylindole) for nuclear localization. (E) Analysis of the growth of sse1-200 sse2Δ cells expressing GFP-Sse1 and TMD-GFP-Sse1 as described above for panel B. (F) Western analysis of the strains in panel B. GFP antibodies were used to visualize GFP-Sse1 and TMD-GFP-Sse1. (G) Quantification of the relative expression levels of GFP-Sse1 and TMD-GFP-Sse1 in panel F. (H) Reactivation of cytosolic firefly luciferase (FFL-GFP-NES) was monitored as described above for panel A, but cells were transformed with plasmids that express GFP-Sse1 or TMD-GFP-Sse1. Bar = 5 μm.
FIG 5
FIG 5
Sse1 is required for the efficient recruitment of Hsp70 to protein aggregates. (A) Fluorescence microscopy images of FFL-GFP-NES and Ssa1-mCherry in sse1-200 sse2Δ cells transformed with an empty plasmid vector control (−) or derivatives that express Sse1 or Sse1-2,3. Cells were pregrown at 25°C (Pre), heat shocked at 43°C for 15 min, and maintained at 30°C as outlined in the legend to Fig. 3A. Arrowheads show aggregates. Bars = 5 μm. (B) Quantification of the fraction of cells in panel A with FFL-GFP-NES aggregates and Ssa1-mCherry foci. Error bars represent standard errors from biological triplicates with ≥100 cells for each time point. (C) Percentage of Ssa1 aggregate-harboring cells with 1 to 4 and ≥5 aggregates. Shown are quantifications of the results in panel A.
FIG 6
FIG 6
Sse1 is required for the efficient recruitment of Hsp104 to protein aggregates. (A) Fluorescence microscopy images of FFL-GFP-NES and Hsp104-mCherry in sse1-200 sse2Δ cells transformed with an empty plasmid vector control (−) or derivatives that express Sse1 or Sse1-2,3. Cells were pregrown at 25°C (Pre), heat shocked at 43°C for 15 min, and maintained at 30°C as outlined in the legend to Fig. 3A. Arrowheads show aggregates. Bars = 5 μm. (B) Quantification of the fraction of cells in panel A with FFL-GFP-NES aggregates and Hsp104-mCherry foci. Error bars represent standard errors from biological triplicates with ≥100 cells for each time point. (C) Percentage of Hsp104 aggregate-harboring cells with 1 to 4 and ≥5 aggregates. Shown are quantifications of the results shown in panel A.
FIG 7
FIG 7
Overexpressed Fes1 and Snl1ΔN do not replace the function of Sse1 and Sse2 in the reactivation of heat-aggregated firefly luciferase. (A) Western analysis of sse1-200 sse2Δ cells transformed with an empty vector control (−) or plasmids that express Sse1 or Fes1 at lower (Fes1+) or higher (Fes1+++) levels. Fes1 expression levels were determined relative to those of the strain transformed with the Sse1-expressing plasmid (bottom). B) Growth of sse1-200 sse2Δ cells transformed with an empty plasmid vector (−) or derivatives that express Sse1, Fes1+, or Fes1+++. (C) Reactivation of heat-aggregated cytosolic firefly luciferase (FFL-GFP-NES) in Fes1- and Snl1ΔN-overexpressing strains was monitored by bioluminescence measurements. Error bars represent standard errors of data from triplicate experiments.
FIG 8
FIG 8
Sse1 is targeted to protein aggregates depending on its association with Hsp70. (A) Fluorescence microscopy images of cells expressing FFL-GFP-NES and Sse1-mCherry (left) or Sse1-2,3–mCherry (right) following heat shock. Cells were pregrown to logarithmic phase at 25°C (Pre), heat shocked for 15 min at 43°C, and allowed to recover at 30°C (0, 60, and 120 min). Arrowheads show aggregates. Bars = 5 μm. (B) Quantification of the fraction of cells in panel A with FFL-GFP-NES aggregates and Sse1-mCherry foci. Error bars represent standard errors from biological triplicates with ≥100 cells for each time point. (C) Percentage of Sse1 aggregate-harboring cells with 1 to 4 and ≥5 aggregates. Shown are quantifications of the results shown in panel A.
FIG 9
FIG 9
Model for functions of Hsp110 in protein disaggregation. See Discussion for details.

Similar articles

Cited by

References

    1. Hartl FU, Bracher A, Hayer-Hartl M. 2011. Molecular chaperones in protein folding and proteostasis. Nature 475:324–332. doi:10.1038/nature10317. - DOI - PubMed
    1. Morimoto RI. 2008. Proteotoxic stress and inducible chaperone networks in neurodegenerative disease and aging. Genes Dev 22:1427–1438. doi:10.1101/gad.1657108. - DOI - PMC - PubMed
    1. Alberti S. 2012. Molecular mechanisms of spatial protein quality control. Prion 6:437–442. doi:10.4161/pri.22470. - DOI - PMC - PubMed
    1. Chen B, Retzlaff M, Roos T, Frydman J. 2011. Cellular strategies of protein quality control. Cold Spring Harb Perspect Biol 3:a004374. doi:10.1101/cshperspect.a004374. - DOI - PMC - PubMed
    1. Miller SB, Mogk A, Bukau B. 2015. Spatially organized aggregation of misfolded proteins as cellular stress defense strategy. J Mol Biol 427:1564–1574. doi:10.1016/j.jmb.2015.02.006. - DOI - PubMed

LinkOut - more resources