

Deletion of F4L (ribonucleotide reductase) in vaccinia virus produces a selective oncolytic virus and promotes anti-tumor immunity with superior safety in bladder cancer models
- PMID: 28289079
- PMCID: PMC5412795
- DOI: 10.15252/emmm.201607296
Deletion of F4L (ribonucleotide reductase) in vaccinia virus produces a selective oncolytic virus and promotes anti-tumor immunity with superior safety in bladder cancer models
Abstract
Bladder cancer has a recurrence rate of up to 80% and many patients require multiple treatments that often fail, eventually leading to disease progression. In particular, standard of care for high-grade disease, Bacillus Calmette-Guérin (BCG), fails in 30% of patients. We have generated a novel oncolytic vaccinia virus (VACV) by mutating the F4L gene that encodes the virus homolog of the cell-cycle-regulated small subunit of ribonucleotide reductase (RRM2). The F4L-deleted VACVs are highly attenuated in normal tissues, and since cancer cells commonly express elevated RRM2 levels, have tumor-selective replication and cell killing. These F4L-deleted VACVs replicated selectively in immune-competent rat AY-27 and xenografted human RT112-luc orthotopic bladder cancer models, causing significant tumor regression or complete ablation with no toxicity. It was also observed that rats cured of AY-27 tumors by VACV treatment developed anti-tumor immunity as evidenced by tumor rejection upon challenge and by ex vivo cytotoxic T-lymphocyte assays. Finally, F4L-deleted VACVs replicated in primary human bladder cancer explants. Our findings demonstrate the enhanced safety and selectivity of F4L-deleted VACVs, with application as a promising therapy for patients with BCG-refractory cancers and immune dysregulation.
Keywords: bladder cancer; immunotherapy; oncolytic virus; ribonucleotide reductase; vaccinia virus.
© 2017 The Authors. Published under the terms of the CC BY 4.0 license.
Figures
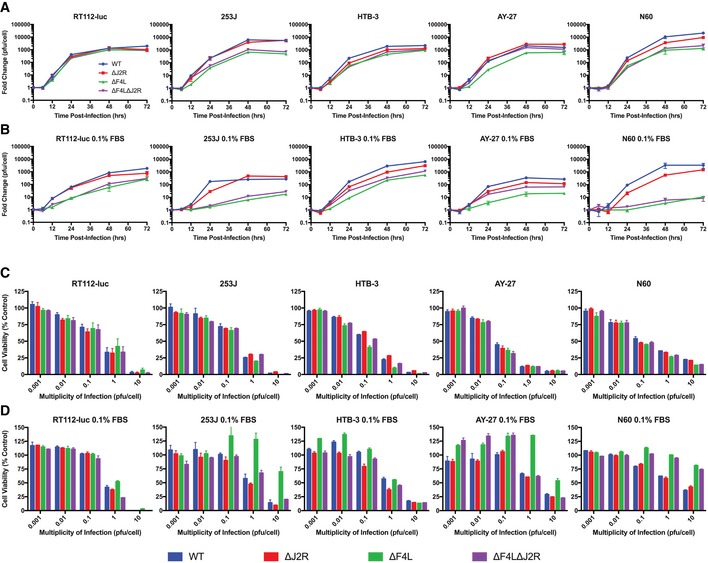
- A, B
Growth curves for the indicated VACV strains in subconfluent human bladder cancer cell lines, a rat bladder cancer cell line (AY‐27), and a normal human skin fibroblast line (N60). The cells were infected with 0.03 PFU/cell. (A) Panel of cells grown under normal serum conditions. (B) Panel of cells grown under low (0.1%) serum conditions. Cultures were harvested at the indicated times and titered on BSC‐40 cells.
- C, D
Survival of cell lines infected in vitro with the indicated VACV strains. Subconfluent cells were infected at the indicated multiplicities of infection (in PFU/cell). Uninfected cells were used as control. (C) Panel of cells grown under normal serum conditions. (D) Panel of cells grown under low (0.1%) serum conditions. The cells were incubated with resazurin to assess viability 3 days post‐infection relative to uninfected control cells.
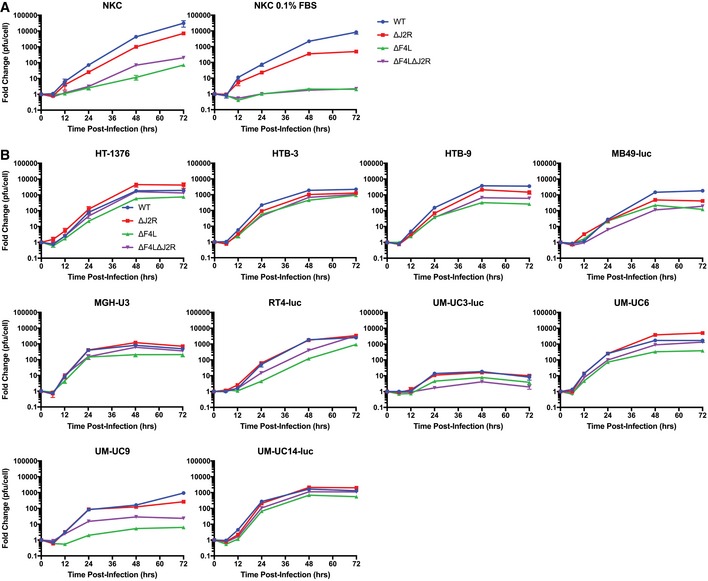
Normal human kidney epithelial cells grown under normal serum conditions (left) and 0.1% FBS (right).
Panel of human bladder cancer cell lines (exception: MB49‐luc, murine urothelial carcinoma) cultured in vitro with 10% FBS.
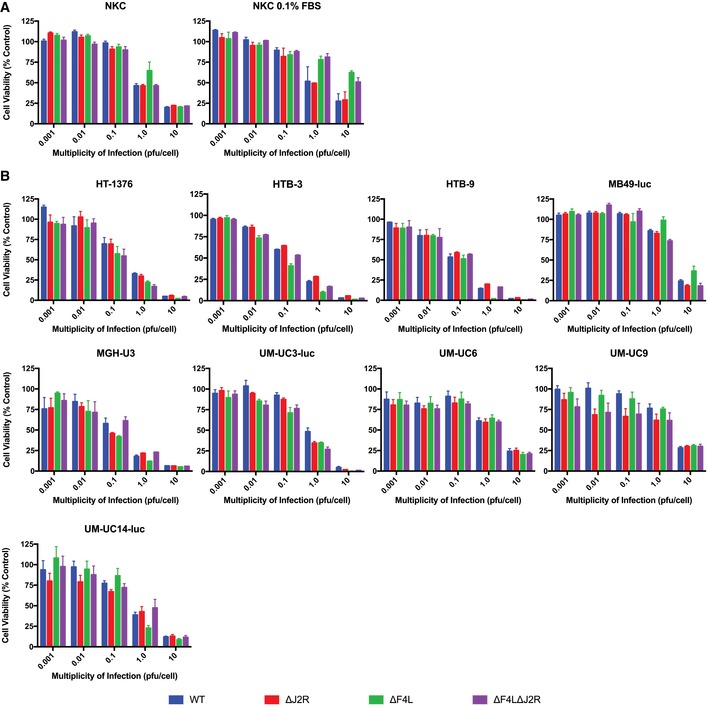
Normal human kidney epithelial cells grown under normal serum conditions (left) and 0.1% FBS (right).
Panel of human bladder cancer cell lines (exception: MB49‐luc, murine urothelial carcinoma) cultured in vitro with 10% FBS. The cells were incubated with resazurin to assess viability 3 days post‐infection relative to uninfected control cells. Uninfected cells were used as control.
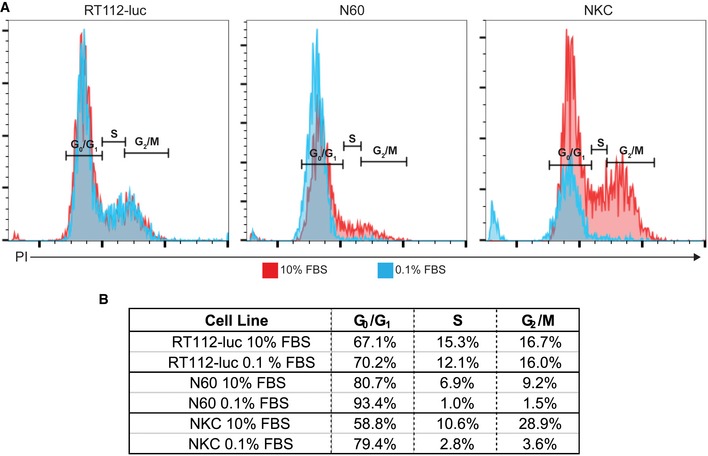
Indicated cells lines were grown in media supplemented with either 10% FBS or 0.1% FBS for 48 h, and then cell cycle distribution was monitored by flow cytometry after PI staining. Red traces indicate cells grown in 10% FBS and blue traces indicate cells grown in 0.1% FBS.
Analysis of cell cycle phase distribution.
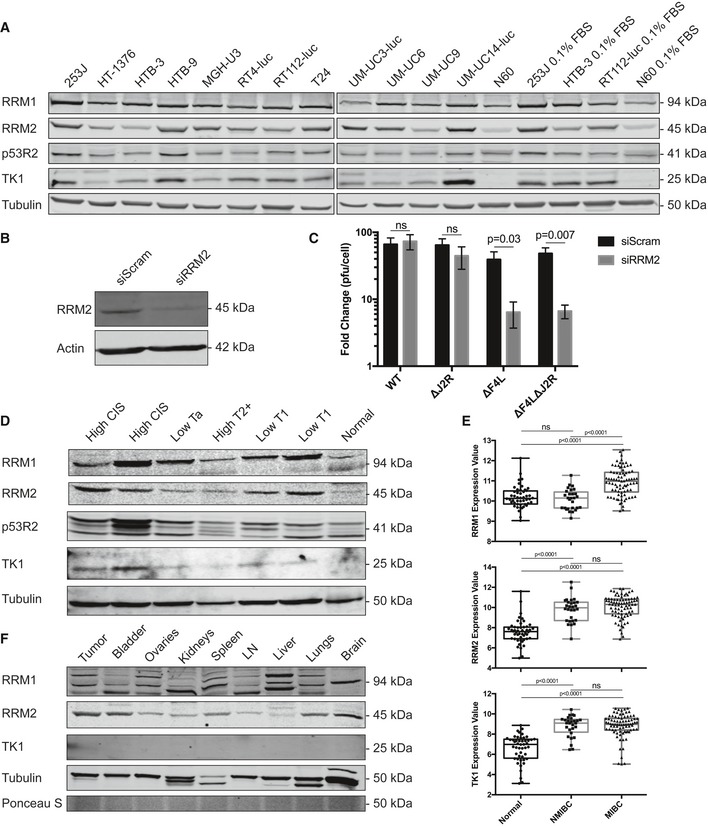
Western blot showing RRM1, RRM2, p53R2, and TK1 expression in human bladder cancer cell lines and N60 normal human fibroblasts. β‐tubulin is shown as a loading control.
siRNA depletion of RRM2 in HeLa cells 3 days post‐transfection as determined by Western blot analysis.
Growth of the indicated VACV strains in subconfluent HeLa cells. The cells were treated for 24 h with a scrambled control siRNA (“Scram”) or an RRM2‐targeted siRNA and then infected with the indicated viruses at 0.03 PFU/cell. The cultures were harvested 2 days later and titered on BSC‐40 cells.
Western blot showing RRM1, RRM2, p53R2, and TK1 expression levels in human primary tumor tissues and adjacent normal urothelium. β‐tubulin is shown as a loading control.
Analysis of RRM1, RRM2, and TK1 expression levels from publicly available patient bladder cancer microarray data (NMIBC: non‐muscle‐invasive bladder cancer; MIBC: muscle‐invasive bladder cancer). Data points denote log2‐transformed MAS5.0 normalized values. The box limits represent the upper and lower quartiles. The median is marked by the horizontal line inside the box. The whiskers extend to the highest and lowest observed values.
Western blot showing RRM1, RRM2, and TK1 expression in rat AY‐27 bladder tumor tissue and the indicated normal tissues. β‐tubulin and Ponceau S staining are shown as loading controls. In all Western blots, equal amounts of total protein (30 μg) were assayed.
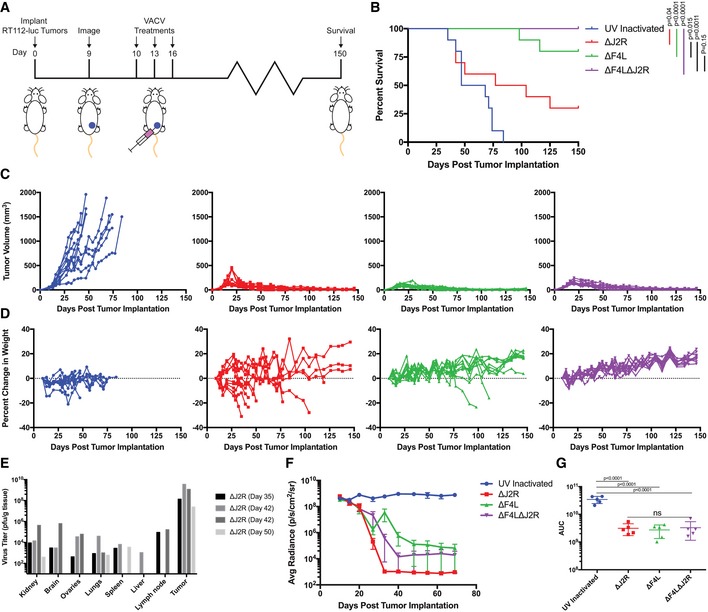
Experimental scheme. Balb/c nude mice were injected with 2 × 10⁶ RT112‐luc cells in the left flank at day zero. Then, 106 PFU of UV‐inactivated, ∆J2R, ∆F4L, or ∆F4L∆J2R VACV were injected into the tumors on days 10, 13, and 16 post‐implantation.
Overall survival of immunocompromised mice bearing RT112‐luc flank tumors following treatment with the indicated viruses (n = 10 per group).
Growth of individual virus‐treated RT112‐luc tumors. Legend as in (B).
Analysis of individual animal body weights plotted as mean change in body weight relative to day 10. Legend as in (B).
VACV titers in tissues taken from animals euthanized due to toxicity (note: only mice that had detectable (4/10) virus as determined by plaque assay are shown).
Quantification of average luminescence (an indication of live tumor cells) from bladder tumors corresponding to (B).
Area under the curve (AUC) calculation from the data in (F) (n = 5 per group).
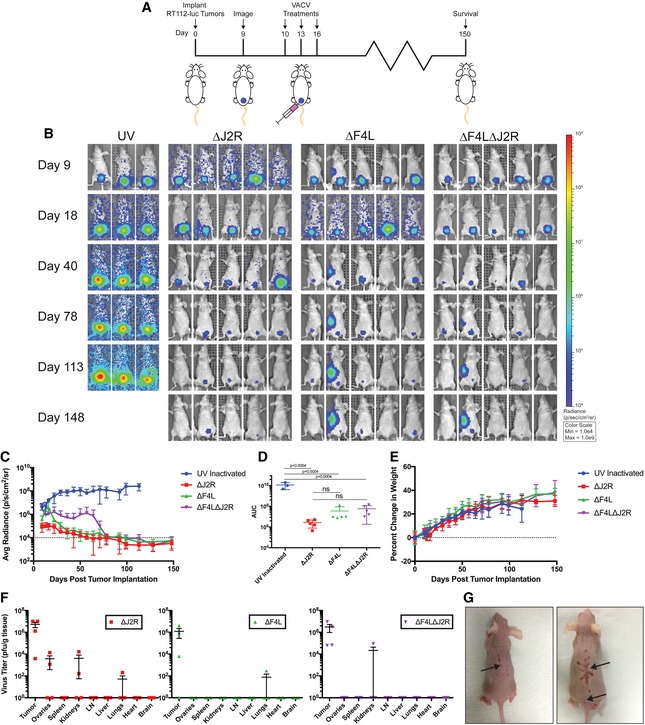
Experimental scheme. Balb/c nude mice were instilled with 2 × 10⁶ RT112‐luc cells on day zero. Mice were imaged for luciferase following luciferin injection on day 9 to verify tumor implantation. On each of days 10, 13, and 16 post‐tumor implantations, 106 PFU of UV‐inactivated, ∆J2R, ∆F4L, or ∆F4L∆J2R VACV was instilled into the bladder and left in‐dwell for 1 h. N = 5 per group.
Representative luminescence images from animals bearing orthotopic RT112‐luc tumors and treated with VACVs.
Quantification of average luminescence, the dashed line indicates limit of detection.
Area under the curve calculation from the data in (C).
Analysis of individual animal body weights plotted as mean change in body weight.
Virus titers in tissues on day 19. Organs were harvested, homogenized, and the virus was titered on BSC‐40 cells with n = 4 mice per group.
Representative images of lesions on two mice taken approximately 125 days post‐tumor implantation. Arrows indicate lesions.
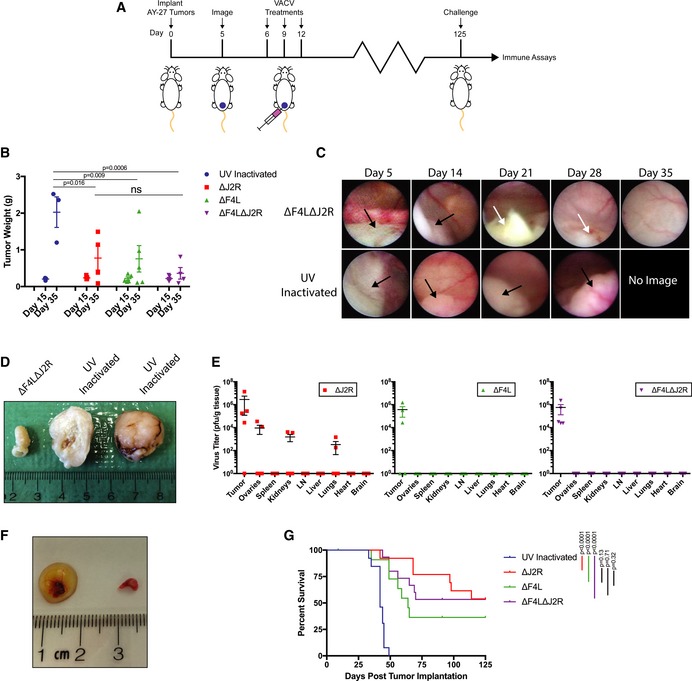
Experimental scheme. Rats were instilled in the bladder with 3 × 10⁶ AY‐27 cells on day zero and cystoscoped on day 5 to verify tumor engraftment. Then, 3 × 10⁸ PFU of UV‐inactivated, ∆J2R, ∆F4L, or ∆F4L∆J2R VACV were instilled into the bladder of each rat on each of days 6, 9, and 12.
Tumor weight from animals euthanized on days 15 and 35 (n = 5 for each day).
Representative cystoscope images of the bladders of a ∆F4L∆J2R virus‐treated rat and a UV‐inactivated virus‐treated rat on days 5, 14, 21, 28, and 35. Black arrow indicates tumor and white arrow indicates necrotic tumor tissues.
Images of rat bladders treated with ∆F4L∆J2R VACV (left image) or UV‐inactivated VACV (center and right images) on days 6, 9, and 12, and then excised on day 35. The tumor treated with UV‐inactivated virus has been cut in half. The center sample shows the tumor interior; the right sample shows the exterior.
Virus titers in tissues taken from animals euthanized on day 15 post‐implantations. Organs were harvested and homogenized and then lysates were titered on BSC‐40 cells. Data for each organ represent n = 5 rats per group.
Ovaries from rats euthanized 15 days post‐tumor implantations and 3 days following final treatment with ∆J2R VACV (left) or ∆F4L∆J2R VACV (right).
Overall survival of immunocompetent rats bearing AY‐27 bladder tumors following treatment with the indicated VACVs. Data represent combined survival of two independent experiments (n = 12–15).
- A
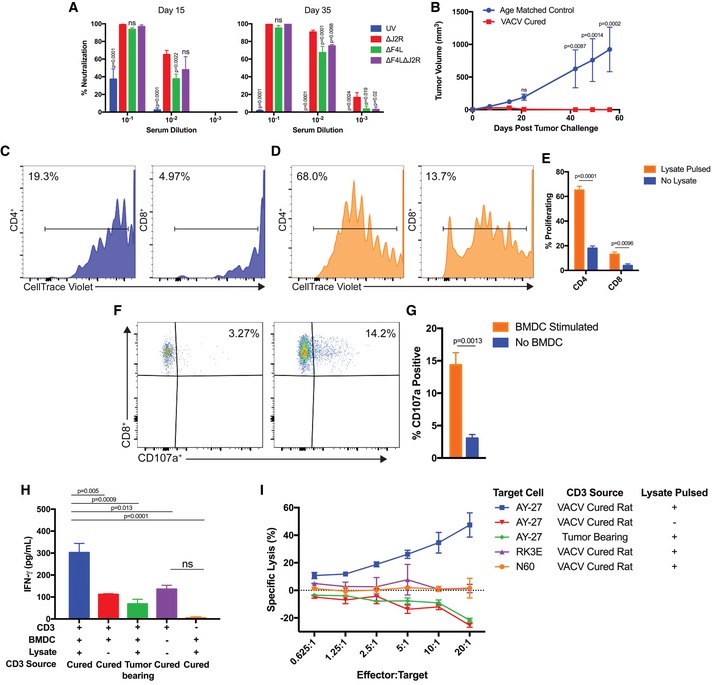
VACV‐neutralizing antibodies were measured in virus‐treated rats 15 and 35 days after implantation (n = 4–5 rats per group).
- B
Protection from subcutaneous tumor challenge after virus‐induced tumor clearance. AY‐27 cells were implanted in the flanks of cured rats (n = 6) and naïve age‐matched control rats (n = 4).
- C–E
T‐cell proliferation after co‐culturing with bone marrow‐derived dendritic cells (BMDCs). CD4+ and CD8+ cells were co‐cultured with BMDCs and proliferation assayed with CellTrace Violet. The representative plots show CD4+ and CD8+ T‐cell proliferation after co‐culture with either mock‐pulsed (C) or with tumor‐lysate‐pulsed BMDCs (D). Panel (E) shows the percentage of CD4+ and CD8+ T cells that proliferated in response to BMDC stimulation (n = 3).
- F, G
Ex vivo upregulation of CD107a by CD8+ T cells from challenged rats. (F) CD3+ cells were incubated +/− BMDCs for 1 h in the presence of anti‐CD107a antibody, incubated for 5 h with monensin and brefeldin A, and then stained with anti‐CD4 and anti‐CD8 antibodies. Events were gated for viable CD8+ T cells. Panel (G) shows the percentage of CD107a+ CD8+ T cells +/− BMDC stimulation (n = 3).
- H
IFN‐γ released after 24‐h co‐culture of CD3+ cells with BMDCs (n = 3–5).
- I
T cells activated ex vivo by tumor‐lysate‐pulsed DCs are cytotoxic. After 6 days of co‐culture with BMDC, CD3+ cells were incubated for 18 h with 10,000 target cells and at different effector‐to‐target ratios. Lysis was determined by LDH assay. RK3E are normal rat kidney cells (n = 2–3 performed in duplicate).
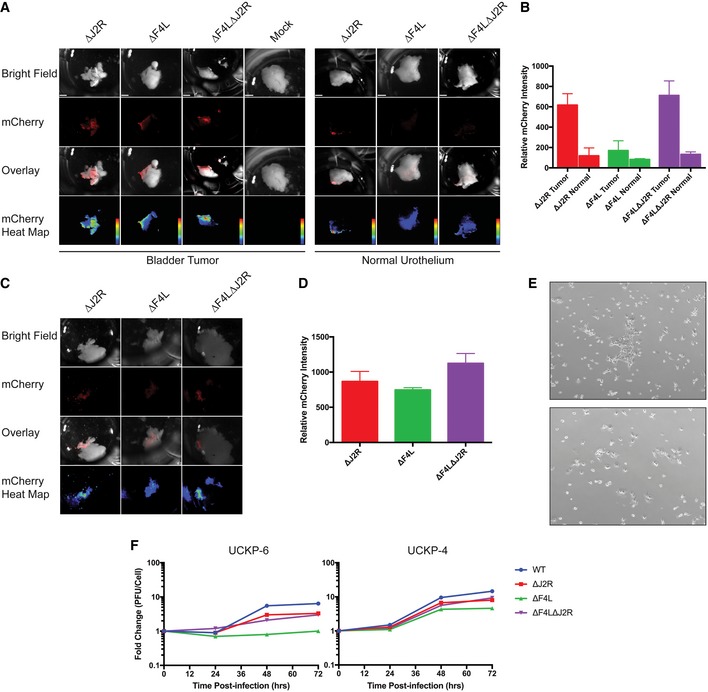
Viruses encoding mCherry fluorescent protein were used to infect primary low‐grade T1 (UCKP‐6) and normal urothelial tissue samples from patients undergoing transurethral resection of bladder tumors. Tissues were infected with 106 PFU of the indicated viruses using buffered saline as a negative control (mock). The images from top to bottom represent a white light tissue image, mCherry signal, an overlay, and a heat map image showing mCherry expression, respectively (scale bars = 1 mm).
Quantification of the mCherry expression in panel (A) at 24 h post‐infection. Mock‐infected cells were used as background correction. Represent one primary tissue that was analyzed as described in Data Information.
Ex vivo infection of high‐grade T2 (UCKP‐4) bladder tumor as in (A).
Quantification of the mCherry expression in panel (C) at 24 h post‐infection. Represent one primary tissue that was analyzed as described in Data Information..
Representative (4×) microscope pictures of the UCKP‐4 (top) and UCKP‐6 (bottom) primary cell cultures used in (F).
Growth of the indicated VACV strains in UCKP‐4 primary human bladder cancer cultures. The cells were infected at 0.03 PFU/cell, harvested at the indicated times, and titered on BSC‐40 cells. Data represent single lysates titered in duplicate.
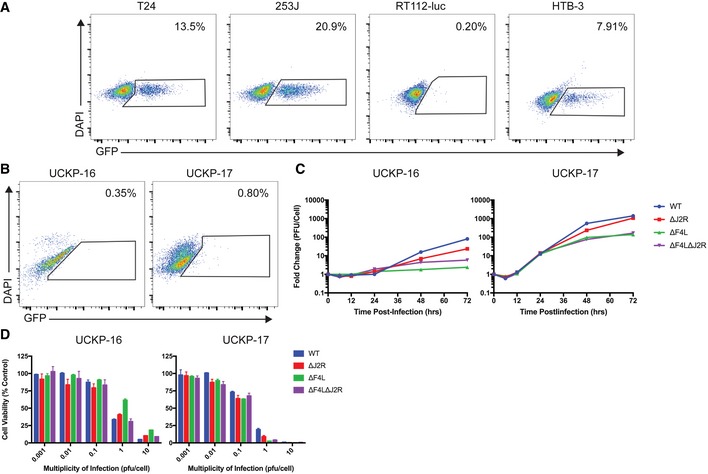
BCG uptake in different cell lines. Cells were incubated with BCG‐GFP for 24 h, and then BCG uptake was measured by flow cytometry. The numbers show the percentage of GFP‐positive events out of total events. DAPI was used as an empty channel and the gates were set based on uninfected cells.
BCG uptake by primary bladder tumor cultures. UCKP‐16 represents a low‐grade Ta tumor and UCKP‐17 represents a low‐grade T1 tumor. Cells were treated and analyzed as in (A).
Growth of the indicated VACV strains in subconfluent primary human bladder tumor cultures in vitro. Cells were infected at a multiplicity of infection of 0.03 PFU/cell, harvested at the indicated times, and titered on BSC‐40 cells.
VACV killing of UCKP‐16 and UCKP‐17 cells. Subconfluent cells were infected at the indicated multiplicities of infection (PFU/cell), cultured for 3 days, and assayed for viability with resazurin dye. Uninfected cells were used as control.
References
-
- Andtbacka R, Kaufman H, Collichio F, Amatruda T, Senzer N, Chesney J, Delman K, Spitler L, Puzanov I, Agarwala S et al (2015) Talimogene laherparepvec improves durable response rate in patients with advanced melanoma. J Clin Oncol 33: 2780–2788 - PubMed
-
- Asanuma H, Arai T, Seguchi K, Kawauchi S, Satoh H, Kikuchi M, Murai M (2003) Successful diagnosis of orthotopic rat superficial bladder tumor model by ultrathin cystoscopy. J Urol 169: 718–720 - PubMed
-
- Aye Y, Li M, Long M, Weiss R (2015) Ribonucleotide reductase and cancer: biological mechanisms and targeted therapies. Oncogene 34: 2011–2021 - PubMed
-
- Bachleitner‐Hofmann T, Stift A, Friedl J, Pfragner R, Radelbauer K, Dubsky P, Schuller G, Benko T, Niederle B, Brostjan C et al (2002) Stimulation of autologous antitumor T‐cell responses against medullary thyroid carcinoma using tumor lysate‐pulsed dendritic cells. J Clin Endocrinol Metab 87: 1098–1104 - PubMed
Publication types
MeSH terms
Substances
Grants and funding
LinkOut - more resources
Full Text Sources
Other Literature Sources
Medical
Miscellaneous
