. 2017 Apr 3;216(4):1107-1121.
doi: 10.1083/jcb.201609066. Epub 2017 Mar 13.

AMPK negatively regulates tensin-dependent integrin activity

Affiliations

AMPK negatively regulates tensin-dependent integrin activity

Maria Georgiadou et al. J Cell Biol. .

Abstract

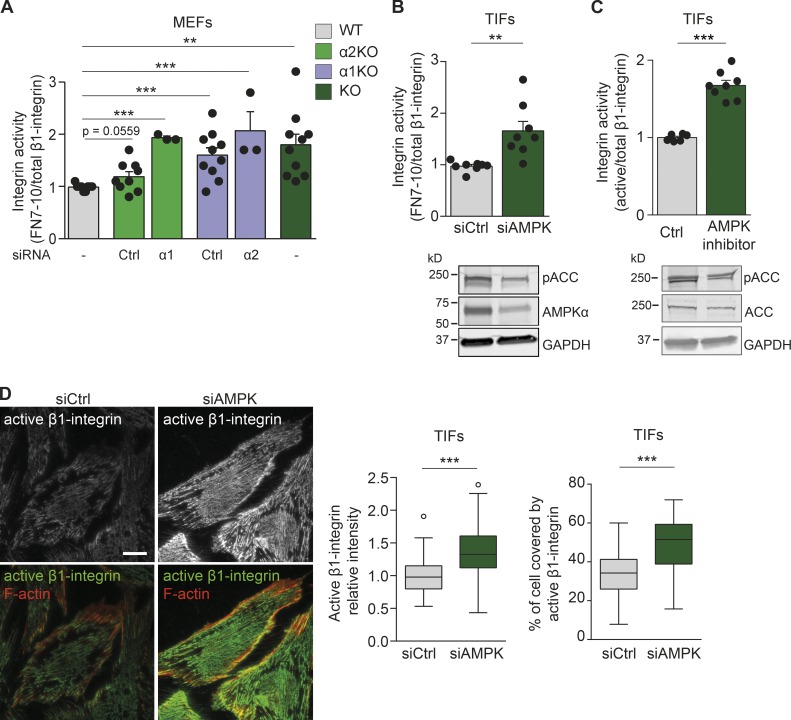
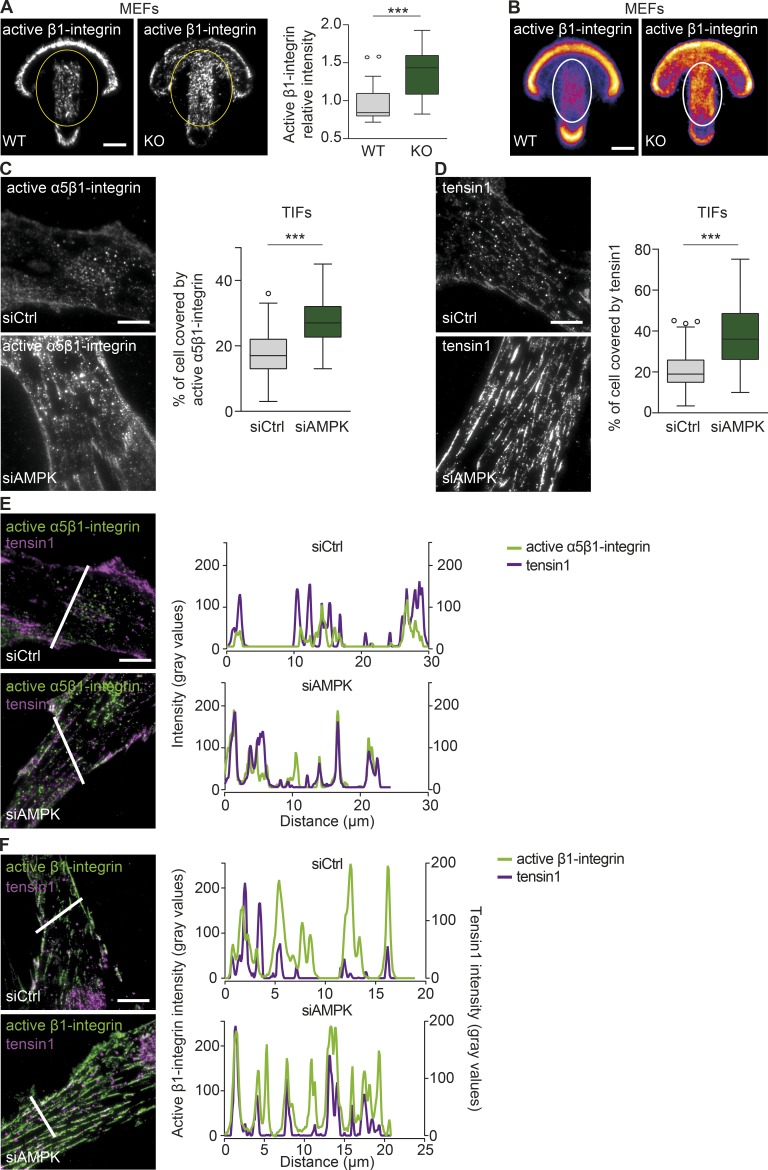
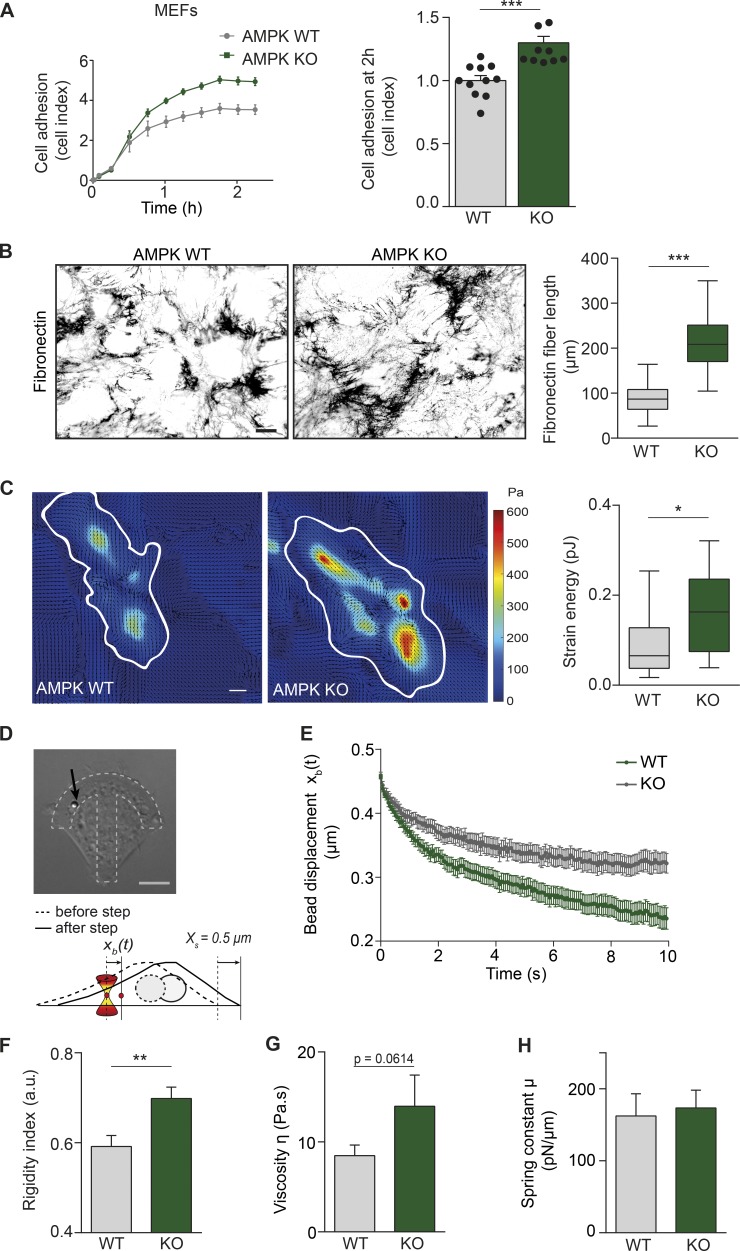
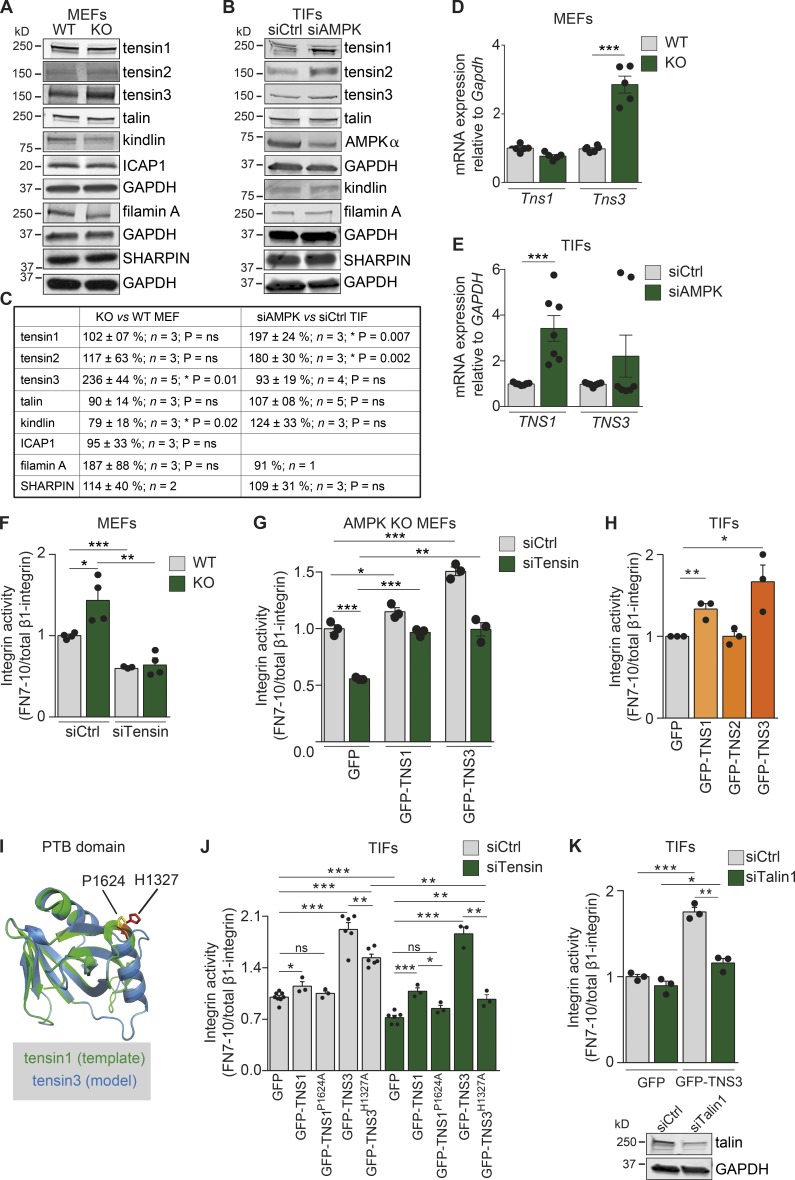
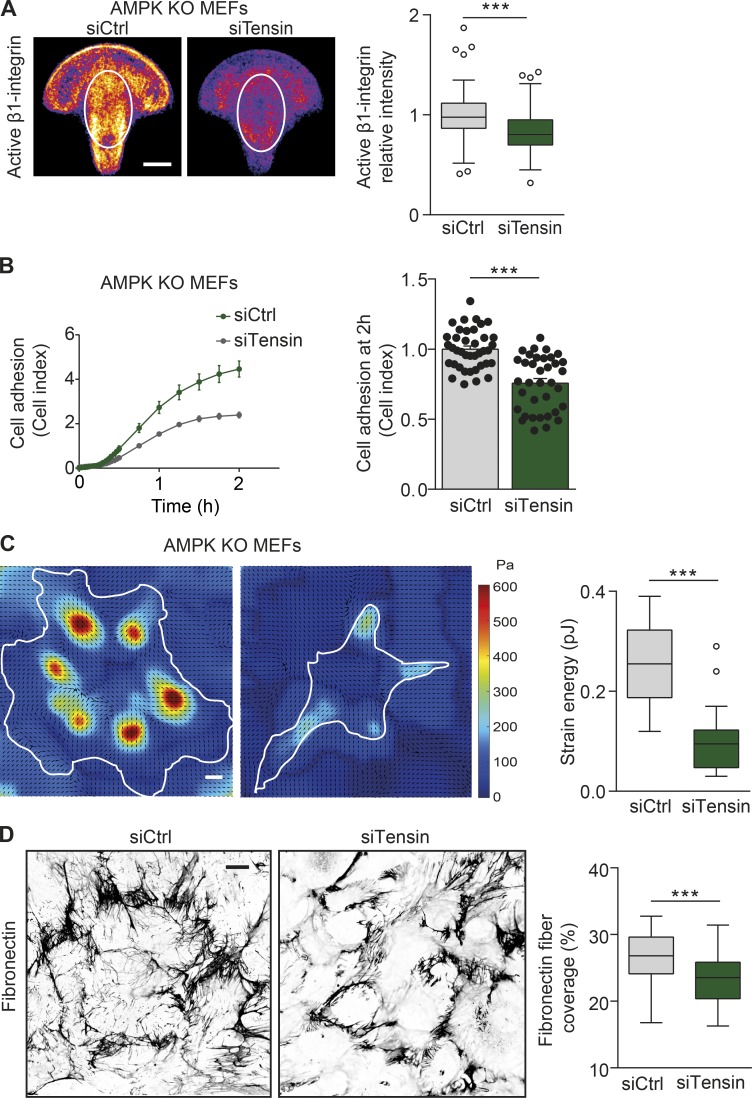
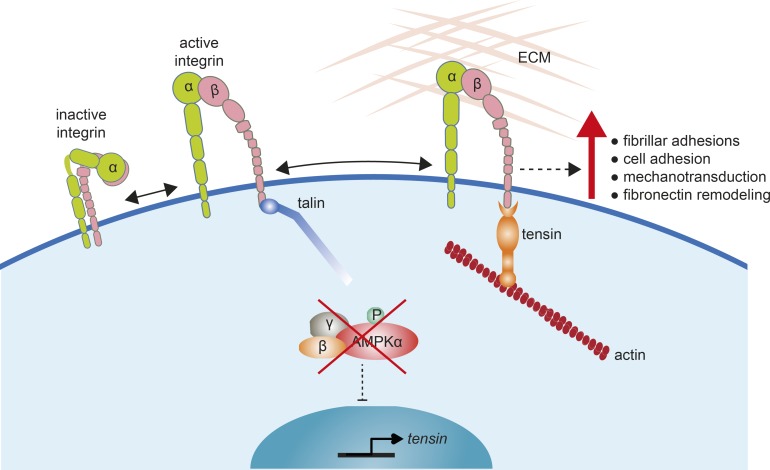
Tight regulation of integrin activity is paramount for dynamic cellular functions such as cell matrix adhesion and mechanotransduction. Integrin activation is achieved through intracellular interactions at the integrin cytoplasmic tails and through integrin-ligand binding. In this study, we identify the metabolic sensor AMP-activated protein kinase (AMPK) as a β1-integrin inhibitor in fibroblasts. Loss of AMPK promotes β1-integrin activity, the formation of centrally located active β1-integrin- and tensin-rich mature fibrillar adhesions, and cell spreading. Moreover, in the absence of AMPK, cells generate more mechanical stress and increase fibronectin fibrillogenesis. Mechanistically, we show that AMPK negatively regulates the expression of the integrin-binding proteins tensin1 and tensin3. Transient expression of tensins increases β1-integrin activity, whereas tensin silencing reduces integrin activity in fibroblasts lacking AMPK. Accordingly, tensin silencing in AMPK-depleted fibroblasts impedes enhanced cell spreading, traction stress, and fibronectin fiber formation. Collectively, we show that the loss of AMPK up-regulates tensins, which bind β1-integrins, supporting their activity and promoting fibrillar adhesion formation and integrin-dependent processes.


Figures

Figure 1.
Figure 1.
AMPK negatively regulates β1-integrin activity. (A) Quantification of flow cytometric assays of β1-integrin activity assessed as FN7–10 binding relative to total β1-integrin surface (MB1.2) levels in MEFs. Data and significance are expressed relative to WT AMPK MEFs and display means ± SEM. 10,000 cells were used per experiment. The number of independent experiments per condition (n) is represented with black dots. WT refers to MEFs expressing the catalytic AMPKα1 and AMPKα2 isoforms. α2KO and siCtrl refer to MEFs lacking the AMPKα2 catalytic subunit and silenced with control siRNA (P = 0.0559). α2KO and siα1 refer to MEFs lacking the AMPKα2 catalytic subunit and silenced for the remaining AMPKα1 subunit (***, P < 0.0001). α1KO and siCtrl refer to MEFs lacking the AMPKα1 catalytic subunit and silenced with control siRNA (***, P = 0.0009). α1KO and siα2 refer to MEFs lacking the AMPKα1 catalytic subunit and silenced for the remaining AMPKα2 subunit (***, P = 0.0002). KO refers to MEFs lacking both AMPKα catalytic isoforms (**, P = 0.0015). A two-tailed Student’s t test was used to obtain p-values. (B) Quantification of flow cytometric assays of β1-integrin activity assessed as FN7–10 binding relative to total β1-integrin (P5D2) in TIFs silenced with control siRNA (siCtrl) or with siRNAs against AMPKα1 and AMPKα2 isoforms (siAMPK). Data are expressed relative to siCtrl and represent means ± SEM. 10,000 cells were used per experiment. **, P = 0.0025 (two-tailed Student’s t test). Below are immunoblots assessing AMPKα expression and phosphorylation levels of the AMPK target ACC (pACC). GAPDH was used as a loading control. (C) Quantification of flow cytometric assays of β1-integrin activity assessed as FN7–10 binding relative to total β1-integrin (P5D2) in TIFs treated for 24 h with 10 µM dorsomorphin (AMPK inhibitor). Data are expressed relative to control and represent means ± SEM. 10,000 cells were used per experiment. ***, P < 0.0001 (two-tailed Student’s t test). Below are immunoblots assessing the phosphorylation levels of pACC and total levels of ACC. GAPDH was used as a loading control. (D) Representative TIRF microscopy images of TIFs silenced for control (siCtrl) or AMPK (siAMPK), plated on fibronectin for 7 h, and stained for active β1-integrin (12G10) and F-actin (phalloidin). The level and coverage of active β1-integrin were determined and displayed as Tukey box plots. n > 120 cells from three biological repeats. ***, P < 0.0001 (two-tailed Student’s t test). Bar, 20 µm.
Figure 2.
Figure 2.
AMPK depletion promotes fibrillar adhesion formation. (A and B) Representative TIRF microscopy images (A) and mean intensity maps (B) of active β1-integrin immunofluorescence (9EG7) in AMPK WT and KO MEFs plated on fibronectin-coated crossbow-shaped micropatterns. The level of active β1-integrin (blue, low level; yellow, high level) within the yellow ovals was quantified (A) and displayed as Tukey box plots. n > 25 cells from two biological repeats. The mean active β1-integrin distribution is represented with a heat map (B), wherein yellow corresponds to regions within the cell containing the largest accumulation of active β1-integrin. The white ovals indicate the centrally located adhesions. n = 20 cells. (C and D) Representative TIRF microscopy images and quantification of active α5β1-integrin (SNAKA51; C) and tensin1 (D) distribution in siCtrl and siAMPK TIFs plated on fibronectin for 7 h. Data are displayed as Tukey box plots. n > 70 cells (C) and n > 180 cells (D) from three biological repeats. (A, C, and D) ***, P < 0.0001 (two-tailed Student’s t test). (E and F) Representative TIRF microscopy images and plot profiles of siCtrl and siAMPK TIFs plated on fibronectin for 7 h and stained for either active α5β1-integrin (SNAKA51) and tensin1 (E) or for active β1-integrin (12G10) and tensin1 (F). Intensity profiles of the respective molecules were obtained across the white lines in each corresponding image. Bars, 10 µm.
Figure 3.
Figure 3.
Loss of AMPK enhances cell adhesion, fibrillogenesis, mechanotransduction, and intracellular stiffness. (A) Adherence of AMPK WT and KO MEFs on fibronectin measured in real-time using the xCELLigence RTCA instrument. Representative curves of cell adhesion over the first 2 h and quantification of relative cell adhesion (cell index) at 2 h after plating are shown. Data are expressed relative to WT and represent means ± SEM. n = 9–11 experiments from four biological repeats. (B) Representative images and quantification of fibronectin fiber length (µm) in AMPK WT and KO MEFs 16 h after supplementation with 10 µg/ml fibronectin. Data are displayed as Tukey box plots. n > 110 fibers from three biological repeats. (A and B) ***, P < 0.0001 (two-tailed Student’s t test). (C) Representative traction force maps and quantification of the mean force (strain energy, pJ) exerted by AMPK WT and KO MEFs plated on fibronectin-coated (5 µg/ml) polyacrylamide gels with a Young’s modulus of ∼1 kPa. Black arrows indicate the direction of traction stress. Cell contours are denoted by white lines. The color code gives the magnitude of traction stress in Pa, which corresponds to forces of pN/µm2. Data are displayed as Tukey box plots. n = 12–14 cells from two biological repeats. *, P = 0.0328 (two-tailed Student’s t test). (D) Viscoelastic relaxation experiment in AMPK WT and KO MEFs. Brightfield image of a KO MEF with an internalized 2-µm diameter microsphere (black arrow) plated on a crossbow-shaped micropattern (dotted lines). The schematic depicts the principle of the experiment. The bead is initially trapped using optical tweezers. A step displacement (Xs = 0.5 µm) is then applied to the cell. The displacement of the bead xb(t) relative to the fixed position of the optical trap is measured. (B–D) Bars: (B) 20 µm; (C and D) 10 µm. (E) Averaged relaxation curves of the bead position after the 0.5-µm step in AMPK WT and KO MEFs. (F–H) Mean values of the rigidity index (F) and of the rheological parameters obtained by fitting the relaxation curves with a SLL model (see the Microrheology in micropatterned cells section of Materials and methods), the intracellular viscosity η (G), and the intracellular spring constant (H) in AMPK WT and KO MEFs. Data shown in E–H are from n = 24 beads from 24 cells from three biological repeats. Error bars represent SEM. **, P = 0.0022 (one-tailed Student’s t test). a.u., arbitrary units.
Figure 4.
Figure 4.
Tensin regulates integrin activity downstream of AMPK. (A–C) Immunoblotting (A and B) and quantification (C) of the indicated proteins in WT and AMPK KO MEFs (A and C) and siCtrl or siAMPK TIFs (B and C). GAPDH was used as a loading control. (D and E) Quantification of mRNA levels of Tns1 and Tns3 in AMPK WT and KO MEFs relative to the housekeeping genes Gapdh, TNS1, and TNS3 in siCtrl and siAMPK TIFs relative to the housekeeping gene GAPDH (E). Data are expressed relative to WT (D) and siCtrl (E), respectively, and represent means ± SEM. ***, P < 0.0001 (two-tailed Student’s t test). (F–H) Quantification of flow cytometric assays of β1-integrin activity assessed as FN7–10 fragment binding relative to total β1-integrin in AMPK WT and KO MEFs (F), AMPK KO MEFs (G), or TIFs (H). (F) AMPK WT and KO MEFs silenced with control siRNA (siCtrl) or with siRNAs against tensin1 and tensin3 (siTensin). Data are expressed relative to WT siCtrl and represent means ± SEM. ***, P < 0.0001 for siTensin WT relative to siCtrl WT; *, P = 0.0216 for siCtrl KO relative to siCtrl WT; and **, P < 0.0029 for siTensin KO relative to siCtrl KO (two-tailed Student’s t test). (G) siCtrl or siTensin AMPK KO MEFs transiently reexpressing GFP-TNS1, GFP-TNS3, GFP alone in AMPK KO MEFs. Data are expressed relative to siCtrl-GFP–expressing cells and represent means ± SEM. ***, P = 0.0002 for siTensin-GFP relative to siCtrl-GFP; *, P = 0.0399 for siCtrl-TNS1 relative to siCtrl-GFP; ***, P = 0.0006 for siCtrl-GFP-TNS3 relative to siCtrl-GFP; ***, P < 0.0001 for siTensin-GFP-TNS1 relative to siTensin-GFP; and **, P = 0.0019 for siTensin-GFP-TNS3 relative to siTensin-GFP (two-tailed Student’s t test). (H) TIFs transiently expressing GFP, GFP-TNS1, GFP-TNS2, or GFP-TNS3. Data are expressed relative to GFP and represent means ± SEM. **, P = 0.007 for GFP-TNS1 relative to GFP; and *, P < 0.03 for GFP-TNS3 relative to GFP (two-tailed Student’s t test). (I) Alignment of the tensin1 PTB domain (1606–1738; Protein Data Bank ID: 1WVH) with the predicted structure of the tensin3 PTB domain. The critical residues for binding β1-integrin are highlighted (yellow for tensin1 and red for tensin3). The amino acids P1624 in tensin1 and H1327 in tensin3 are indicated. (J and K) Quantification of flow cytometric assays of β1-integrin activity assessed as FN7–10 fragment binding relative to total β1-integrin in TIFs. (J) siCtrl or siTensin TIFs transiently expressing GFP, GFP-TNS1, point mutant GFP-TNS1P1624A, GFP-TNS3, and point mutant GFP-TNS3H1327A. Data are expressed relative to siCtrl GFP and represent means ± SEM. For siCtrl cells, *, P = 0.02 for GFP-TNS1 relative to GFP; ***, P < 0.0001 for GFP-TNS3 relative to GFP; ***, P < 0.0001 for GFP-TNS3H1327A relative to GFP; and **, P = 0.004 for GFP-TNS3H1327A relative to GFP-TNS3. For siTensin cells, ***, P = 0.0004 for GFP-TNS1 relative to GFP; ***, P < 0.0001 for GFP-TNS3 relative to GFP; ***, P < 0.0001 for GFP-TNS3H1327A relative to GFP; and **, P = 0.004 for GFP-TNS3H1327A relative to GFP-TNS3. (K) Control or talin1-silenced (siTalin1) TIFs transiently expressing GFP or GFP-TNS3. Data are expressed relative to siCtrl GFP and represent means ± SEM. ***, P = 0.0002 for siCtrl GFP-TNS3 relative to siCtrl GFP; **, P = 0.0013 for siTalin GFP-TNS3 relative to siCtrl GFP-TNS3; *, P = 0.024 for siTalin GFP-TNS3 relative to siTalin GFP (two-tailed Student’s t test). Below are immunoblots assessing talin expression.
Figure 5.
Figure 5.
Tensin regulates cell spreading, mechanotransduction, and fibrillogenesis downstream of AMPK. (A) Representative mean intensity maps of bottom-plane images obtained with a spinning-disk confocal microscope. siCtrl or siTensin AMPK KO MEFs are stained for active β1-integrin (9EG7) and plated on fibronectin-coated crossbow-shaped micropatterns. The mean active β1-integrin distribution is represented with a heat map, wherein yellow corresponds to regions within the cell containing the largest accumulation of active β1-integrin. The white ovals indicate the centrally located adhesions, and the level of active β1-integrin within the ovals was quantified and displayed as Tukey box plots. n > 70 cells from four biological repeats. (B) Adherence of siCtrl and siTensin AMPK KO MEFs on fibronectin (1 µg/ml) as measured in real time using the xCELLigence RTCA instrument. Quantification of relative cell adhesion (cell index) at 2 h after plating is shown. Data are expressed relative to siCtrl and represent means ± SEM. n > 35 from 12 independent experiments. (C) Representative traction force maps and quantification of the mean force (strain energy, pJ) exerted by siCtrl and siTensin AMPK KO MEFs plated on fibronectin-coated (5 µg/ml) polyacrylamide gels with a Young’s modulus of ∼3 kPa. Black arrows indicate the direction of traction stress. Cell contours are denoted by white lines. The color code gives the magnitude of traction stress in Pa, which corresponds to forces of pN/µm2. Data are displayed as Tukey box plots. n = 18–19 cells from three biological repeats. (D) Representative confocal images obtained with a spinning-disk confocal microscope and quantification of the area covered by fibronectin in siCtrl and siTensin AMPK KO MEFs 16 h after supplementation with 10 µg/ml fibronectin. Data are displayed as Tukey box plots. n > 70 images from three biological repeats. (A, C, and D) Bars: (A and C) 10 µm; (D) 20 µm. (A–D) ***, P < 0.0001 (two-tailed Student’s t test).
Figure 6.
Figure 6.
Model showing how AMPK loss promotes tensin-mediated integrin activity. In the absence of AMPK, the transcriptional constraints that limit tensin expression are removed. A corresponding increase in tensin expression leads to enhanced tensin binding to β1-integrin tails to support integrin activity after initial integrin activation by talin. This leads to enhanced fibrillar adhesion formation and integrin-dependent processes such as mechanotransduction and fibronectin remodeling. P, phosphorylated.

Similar articles

Cited by

References

    1. Alanko J., Mai A., Jacquemet G., Schauer K., Kaukonen R., Saari M., Goud B., and Ivaska J.. 2015. Integrin endosomal signalling suppresses anoikis. Nat. Cell Biol. 17:1412–1421. 10.1038/ncb3250 - DOI - PMC - PubMed
    1. Askari J.A., Tynan C.J., Webb S.E., Martin-Fernandez M.L., Ballestrem C., and Humphries M.J.. 2010. Focal adhesions are sites of integrin extension. J. Cell Biol. 188:891–903. 10.1083/jcb.200907174 - DOI - PMC - PubMed
    1. Azioune A., Storch M., Bornens M., Théry M., and Piel M.. 2009. Simple and rapid process for single cell micro-patterning. Lab Chip. 9:1640–1642. 10.1039/b821581m - DOI - PubMed
    1. Baker E.L., Bonnecaze R.T., and Zaman M.H.. 2009. Extracellular matrix stiffness and architecture govern intracellular rheology in cancer. Biophys. J. 97:1013–1021. 10.1016/j.bpj.2009.05.054 - DOI - PMC - PubMed
    1. Banko M.R., Allen J.J., Schaffer B.E., Wilker E.W., Tsou P., White J.L., Villén J., Wang B., Kim S.R., Sakamoto K., et al. . 2011. Chemical genetic screen for AMPKα2 substrates uncovers a network of proteins involved in mitosis. Mol. Cell. 44:878–892. 10.1016/j.molcel.2011.11.005 - DOI - PMC - PubMed

Publication types

Associated data