. 2017 May 5;292(18):7554-7565.
doi: 10.1074/jbc.M116.773788. Epub 2017 Mar 13.

A hot spot on interferon α/β receptor subunit 1 (IFNAR1) underpins its interaction with interferon-β and dictates signaling

Affiliations

A hot spot on interferon α/β receptor subunit 1 (IFNAR1) underpins its interaction with interferon-β and dictates signaling

Nicole A de Weerd et al. J Biol Chem. .

Abstract

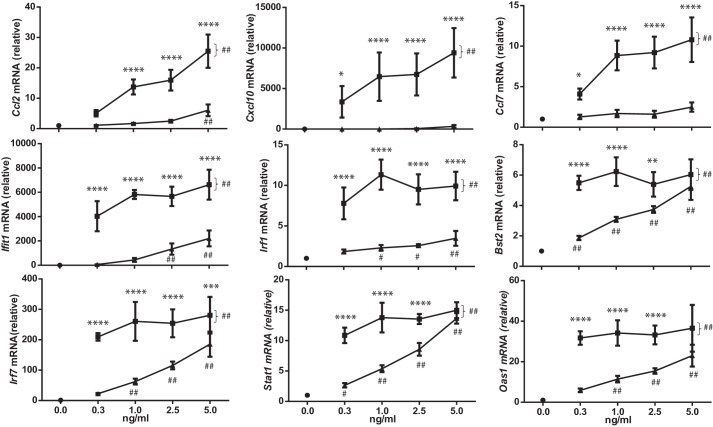
The interaction of IFN-β with its receptor IFNAR1 (interferon α/β receptor subunit 1) is vital for host-protective anti-viral and anti-proliferative responses, but signaling via this interaction can be detrimental if dysregulated. Whereas it is established that IFNAR1 is an essential component of the IFNAR signaling complex, the key residues underpinning the IFN-β-IFNAR1 interaction are unknown. Guided by the crystal structure of the IFN-β-IFNAR1 complex, we used truncation variants and site-directed mutagenesis to investigate domains and residues enabling complexation of IFN-β to IFNAR1. We have identified an interface on IFNAR1-subdomain-3 that is differentially utilized by IFN-β and IFN-α for signal transduction. We used surface plasmon resonance and cell-based assays to investigate this important IFN-β binding interface that is centered on IFNAR1 residues Tyr240 and Tyr274 binding the C and N termini of the B and C helices of IFN-β, respectively. Using IFNAR1 and IFN-β variants, we show that this interface contributes significantly to the affinity of IFN-β for IFNAR1, its ability to activate STAT1, the expression of interferon stimulated genes, and ultimately to the anti-viral and anti-proliferative properties of IFN-β. These results identify a key interface created by IFNAR1 residues Tyr240 and Tyr274 interacting with IFN-β residues Phe63, Leu64, Glu77, Thr78, Val81, and Arg82 that underlie IFN-β-IFNAR1-mediated signaling and biological processes.

Keywords: interferon; mutagenesis; receptor; signal transduction; structure-function.


Conflict of interest statement

The authors declare that they have no conflicts of interest with the contents of this article

Figures

Figure 1.
Figure 1.
Contributions of IFNAR1 SD1–4 to IFN-β binding. A, crystal structure of IFNAR1 (blue) in complex with IFN-β (yellow). Shown are relative percentage contributions of each domain of IFNAR1 to the overall IFN-β binding interface (crystal structure of the IFN-β-IFNAR1 complex from de Weerd et al. (11); PDB code 3WCY). B, the helices of IFN-β (A–E) and the IFNAR1 subdomains (SD1–4) are indicated. The positions of Tyr240 and Tyr274 are indicated with dark blue spheres. C, close-up view of the binding of Tyr240 and Tyr274 (blue sticks) to residues on the B and C helices of IFN-β (yellow sticks). D, diagrammatic representation of IFNAR1-ECD truncation variants generated in this study. E, native PAGE (10% v/v) analysis of IFNAR1-ECD, IFNAR1-SD123, and IFNAR1-SD12 alone and with IFN-β. These interactions were carried out in triplicate.
Figure 2.
Figure 2.
IFNAR1 and IFN-β variants generated and assessed in this study. A, residues of IFNAR1 were mutated to alanine residues as indicated. IFNAR1 residues 230–280-only are shown. B, residues of IFN-β were mutated to alanine residues as indicated. IFN-β residues 60–90 only are shown. C, circular dichroism analysis confirmed the α-helical fold of IFN-β variants: IFNβ (black line), IFN-β F63A/L64A (dark gray line), IFN-β E77A/T78A (dotted line), IFN-β V81A/R82A (light gray line) and IFN-β FLETVR (dashed line). MRE, mean residue ellipticity.
Figure 3.
Figure 3.
IFN specificity and signaling via IFNAR1-ECD SD3 residues. A and B, measurement of luciferase activity in cells transfected with vector only (VO), IFNAR1, or the IFNAR1 variant receptors IFNAR1Y240A, IFNAR1Y274A, IFNAR1YYAA after stimulation with 2.5 ng/ml of either IFNβ (A) or mIFN-α1 (B) for 4 h. C, measurement of luciferase activity in cells transfected with IFNAR1 after stimulation with 2.5 ng/ml of IFN-β or variants, IFN-β F63A/L64A, IFN-β E77A/T78A, IFN-β V81A/R82A, and IFN-β FLETVR. Data are expressed as the mean of at least triplicate independent experiments, all performed with technical triplicates. Significance of response calculated relative to cells transfected with either IFNAR1 constructs (A and B) or treated with IFN-β (C). *, p < 0.05; **, p < 0.01; ****, p < 0.0001 (two-way ANOVA with Tukey's multiple comparisons testing). Significance of response calculated relative to cells transfected with empty vector only. #, p < 0.05; ##, p < 0.01 (two-way ANOVA with Tukey's multiple comparisons testing).
Figure 4.
Figure 4.
Abundance of surface levels of IFNAR1 on L929 cells treated with either IFN-β or the IFN-β FLETVR variant (indicated) as measured by flow cytometry. A, cells were treated with increasing doses of protein (0.3, 1.0, 2.5, 5.0, and 10 ng/ml) as indicated for 1 h before harvesting and staining. B, cells were treated with 1 ng/ml concentrations of the proteins indicated and harvested after 0.5, 1, 3, 24, or 48 h of incubation before staining. Data were expressed as the mean of at least triplicate independent experiments, all performed in technical triplicate. Significance of response was calculated relative to untreated cells. ***, p < 0.001; ****, p < 0.0001 (1-way ANOVA with Dunnett's multiple comparisons testing). Vertical dashed lines on the X-axes indicate the transition between IFN-β and IFN-β FLETVR treatments. MFI, mean fluorescence intensity.
Figure 5.
Figure 5.
IFN-β FLETVR variant induces reduced STAT1 phosphorylation compared with IFN-β. A, L929 cells were treated with either 1 ng/ml or 5 ng/ml IFN-β or the IFN-β FLETVR variant for either 30 or 120 min. STAT1 phosphorylated at Tyr701, total STAT1, and actin were detected in whole cell lysates. This result is representative of triplicate independent experiments. B, densitometry of Western blots; data from the triplicate independent experiments are represented as intensity of phospho-STAT1 relative to intensity of actin. Data are expressed as the mean ± S.D. of triplicate independent experiments. Significance relative to untreated samples. *, p < 0.05; **, p < 0.01; ****, p < 0.0001 (two-way ANOVA with Tukey's multiple comparisons testing); significance relative to treatment with 1 ng/ml IFN-β for 30 min. #, p < 0.05; ###, p < 0.001; ####, p < 0.0001 (2-way ANOVA with Tukey's multiple comparisons testing).
Figure 6.
Figure 6.
Quantitative RT-PCR analysis of the response of L929 cells to treatment with IFN-β (■) or IFN-β FLETVR (▴) for 3 h. The amplified target from each sample is relative to the levels of 18S in the same sample. All data is normalized to mRNA levels detected in untreated cells (●) and expressed as the mean ± S.D. of at least three independent experiments performed in technical triplicate. Significance indicated above the data points compares treatment between IFN-β and IFN-β FLETVR at the same protein concentration (*, p < 0.05; **, p < 0.01; ***, p < 0.001; ****, p < 0.0001 (two-way ANOVA with Sidak's multiple comparisons testing)). All IFN-β-treated samples (as demonstrated by the bracket at the right-hand side of each graph) show -fold induction significantly greater than the untreated samples (##, p < 0.01 or less; two-way ANOVA with Dunnett's multiple comparisons testing). Significant difference in -fold induction between IFN-β FLETVR-treated and untreated samples is indicated (##, p < 0.01; #, p < 0.05; two-way ANOVA with Dunnett's multiple comparisons testing).
Figure 7.
Figure 7.
Comparison of the biological responses of IFN-β and the IFN-β FLETVR variant on L929 cells. A, the specific anti-viral activities (IU mg−1) of IFN-β and IFN-β FLETVR are shown. Data shown are individual data points and mean ± S.D. of independent experiments. ****, p < 0.0001 (Student's t test). B, comparison of the anti-proliferative activity of IFN-β and IFN-β FLETVR variant. Cell proliferation was monitored over 72 h in the presence of the indicated doses of either IFN-β or IFN-β FLETVR. Data shown are the 72-h time point and are expressed as the mean ± S.D. of triplicate independent experiments, performed in technical quadruplicate, analyzed using two-way ANOVA with Sidak's multiple comparisons test. ****, p < 0.0001.

References

    1. Pestka S. (2007) The interferons: 50 years after their discovery, there is much more to learn. J. Biol. Chem. 282, 20047–20051 - PubMed
    1. Medzhitov R. (2001) Toll-like receptors and innate immunity. Nat. Rev. Immunol. 1, 135–145 - PubMed
    1. Jonasch E., and Haluska F. G. (2001) Interferon in oncological practice: review of interferon biology, clinical applications, and toxicities. Oncologist 6, 34–55 - PubMed
    1. Annibali V., Mechelli R., Romano S., Buscarinu M. C., Fornasiero A., Umeton R., Ricigliano V. A., Orzi F., Coccia E. M., Salvetti M., and Ristori G. (2015) IFN-β and multiple sclerosis: from etiology to therapy and back. Cytokine Growth Factor Rev. 26, 221–228 - PubMed
    1. Lebrun C., Bertagna M., and Cohen M. (2011) Cutaneous Side-effects of Immunomodulators in MS. Int. MS J. 17, 88–94 - PubMed

Publication types

Associated data

LinkOut - more resources