. 2017 Apr 28;292(17):6987-6997.
doi: 10.1074/jbc.M117.777805. Epub 2017 Mar 13.

Identification of mechanically regulated phosphorylation sites on tuberin (TSC2) that control mechanistic target of rapamycin (mTOR) signaling

Affiliations

Identification of mechanically regulated phosphorylation sites on tuberin (TSC2) that control mechanistic target of rapamycin (mTOR) signaling

Brittany L Jacobs et al. J Biol Chem. .

Abstract

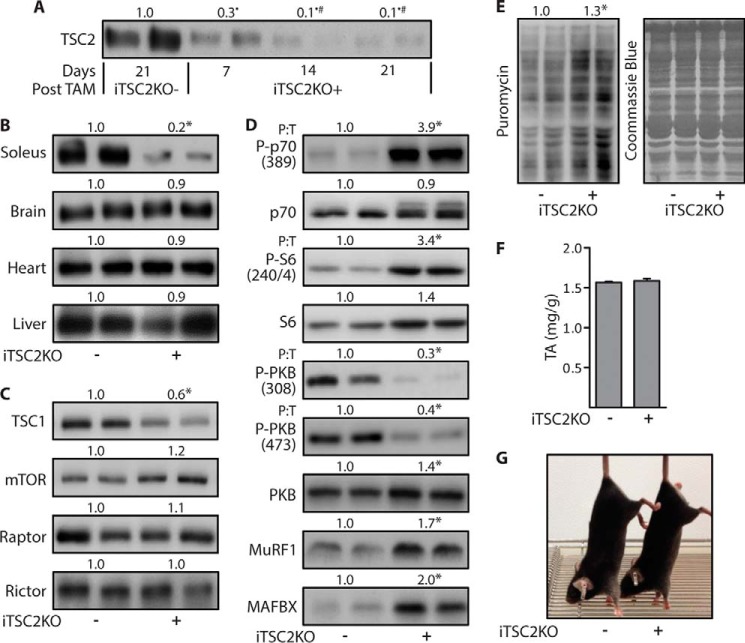
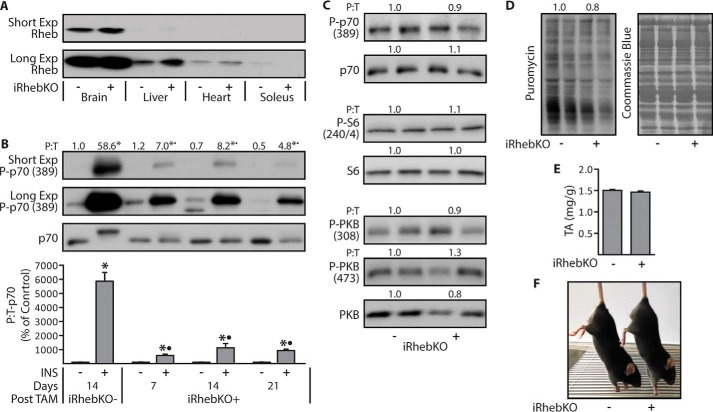
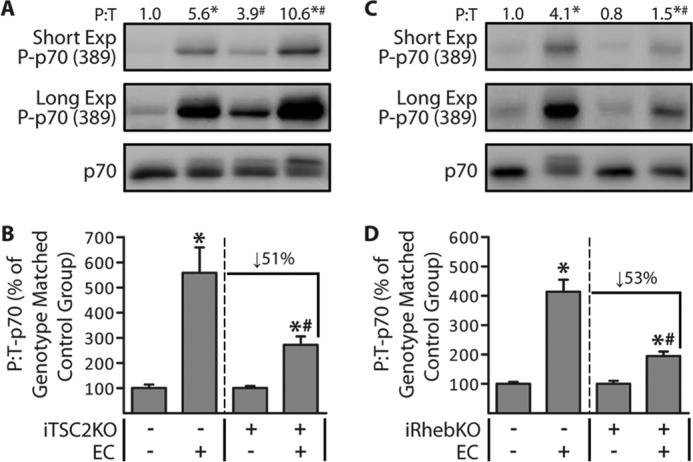
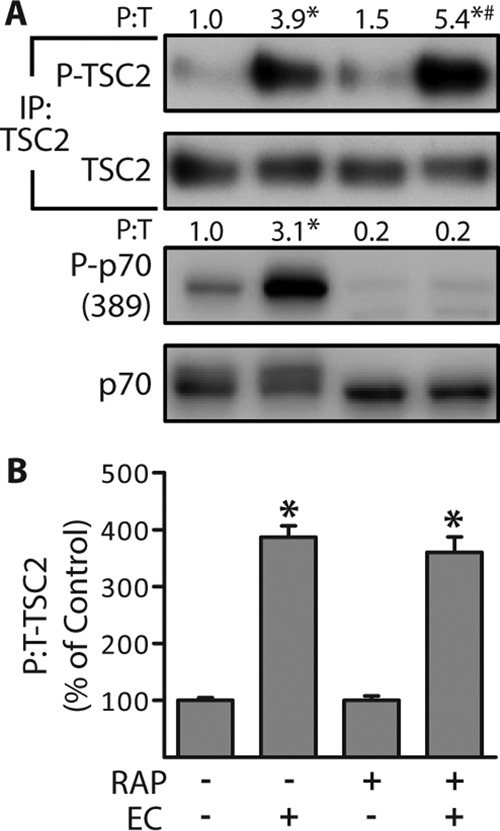
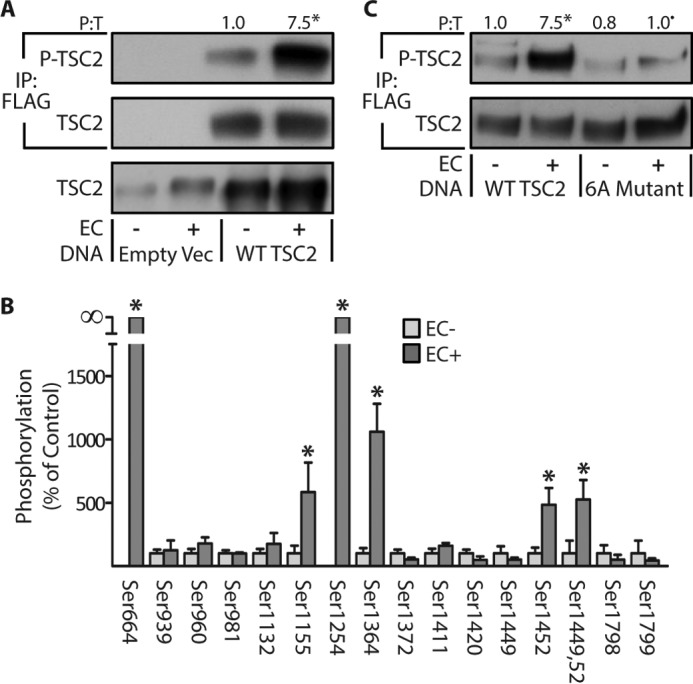
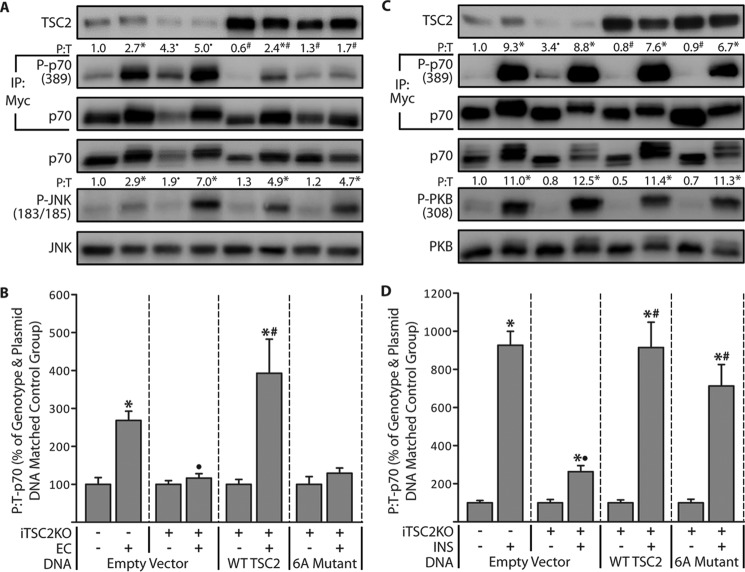
Mechanistic target of rapamycin (mTOR) signaling is necessary to generate a mechanically induced increase in skeletal muscle mass, but the mechanism(s) through which mechanical stimuli regulate mTOR signaling remain poorly defined. Recent studies have suggested that Ras homologue enriched in brain (Rheb), a direct activator of mTOR, and its inhibitor, the GTPase-activating protein tuberin (TSC2), may play a role in this pathway. To address this possibility, we generated inducible and skeletal muscle-specific knock-out mice for Rheb (iRhebKO) and TSC2 (iTSC2KO) and mechanically stimulated muscles from these mice with eccentric contractions (EC). As expected, the knock-out of TSC2 led to an elevation in the basal level of mTOR signaling. Moreover, we found that the magnitude of the EC-induced activation of mTOR signaling was significantly blunted in muscles from both inducible and skeletal muscle-specific knock-out mice for Rheb and iTSC2KO mice. Using mass spectrometry, we identified six sites on TSC2 whose phosphorylation was significantly altered by the EC treatment. Employing a transient transfection-based approach to rescue TSC2 function in muscles of the iTSC2KO mice, we demonstrated that these phosphorylation sites are required for the role that TSC2 plays in the EC-induced activation of mTOR signaling. Importantly, however, these phosphorylation sites were not required for an insulin-induced activation of mTOR signaling. As such, our results not only establish a critical role for Rheb and TSC2 in the mechanical activation of mTOR signaling, but they also expose the existence of a previously unknown branch of signaling events that can regulate the TSC2/mTOR pathway.

Keywords: cell growth; exercise; mechanotransduction; protein synthesis; skeletal muscle.


Conflict of interest statement

The authors declare that they have no conflicts of interest with the contents of this article

Figures

Figure 1.
Figure 1.
Characterization of the skeletal muscle-specific and inducible TSC2 knock-out mice. Six-week-old skeletal muscle-specific and inducible TSC2 knock-out mice (iTSC2KO+) or control mice (iTSC2KO) were treated with 2 mg/day of tamoxifen for 5 days (TAM). A, at 7, 14, or 21 days after TAM, the TAs were subjected to Western blotting analysis for TSC2. The values above the blots are expressed relative to the 21-day TAM iTSC2KO samples. B–G, all remaining analyses were performed on 14-day post-TAM iTSC2KO−/+ mice and included Western blotting analysis for the indicated proteins in soleus, brain, heart, and liver samples (B) or TAs (C and D). The values above the blots represent the total protein amount or the phosphorylated (P) to total protein ratio (P:T) for each group. E, rates of protein synthesis in TAs were assessed by Western blotting for puromycin-labeled peptides. F, muscle weight to body weight ratio of TAs. G, photograph of the TAM iTSC2KO−/+ mice. All values are presented as means (±S.E. in graph, n = 5–8/group). Symbols indicate significant difference (p ≤ 0.05) from 21-day iTSC2KO (•), 7-day iTSC2KO+ (#), and 14-day iTSC2KO (*).
Figure 2.
Figure 2.
Characterization of the skeletal muscle-specific and inducible Rheb knock-out mice. Six-week-old skeletal muscle-specific and inducible Rheb knock-out (iRhebKO+) or control (iRhebKO) mice were treated with 2 mg/day of Tamoxifen for 5 days (TAM). A, at 14 days after TAM, the indicated tissues were collected and Western blotted for Rheb. B, at 7, 14, or 21 days after TAM, mice were injected with insulin (INS+) or PBS (INS−), and after 30 min the TAs were collected and then Western blotted for the phosphorylated (P) to total protein ratio (P:T) of p70. The numbers above the blots represent the values for each group, whereas the graph represents these values when expressed as a percentage of each genotype- and days post-TAM-matched control (INS−) group. C and D, TAs from 14-day post-TAM iRhebKO−/+ mice were Western blotted for the indicated proteins (C) or puromycin-labeled peptides to measure the rates of protein synthesis (D). E and F, muscle weight to body weight ratio for TAs from 14-day post-TAM iRhebKO−/+ mice (E) and photographs of these mice (F). The values are presented as means (±S.E. in graph, n = 5–8/group). Symbols indicate significant difference (p ≤ 0.05) from genotype and days post-TAM-matched control (INS−) (*) and 14-day iRhebKO INS+ (•).
Figure 3.
Figure 3.
TSC2 and Rheb significantly contribute to the eccentric contraction-induced activation of mTOR signaling. Six-week-old iTSC2KO−/+ mice (A and B) and iRhebKO−/+ mice (C and D) were treated with 2 mg/day of tamoxifen for 5 days (TAM). At 14 days after TAM, TAs were stimulated with a bout of eccentric contractions (EC+) or the control condition (EC−). At 1 h after stimulation, the TAs were collected and subjected to Western blotting analysis for the indicated proteins. The values above the blots represent the phosphorylated (P) to total protein ratio (P:T) for each group. B, graphical representation of the data in A. D, graphical representation of the data in C, with the P:T ratio of p70 for each group expressed relative to its genotype-matched control (EC−) group. For example, in B, the values for the iTSC2KO+/EC+ group are expressed relative to the values obtained in the iTSC2KO+/EC group. All values are presented as means (±S.E. in graph, n = 5–8/group). Symbols indicate significant difference (p ≤ 0.05) from the genotype-matched control (EC) (*) or the stimulation-matched condition in iTSC2KO (A and B) or iRhebKO (C and D) (#).
Figure 4.
Figure 4.
Eccentric contractions induce TSC2 phosphorylation through a rapamycin-insensitive mechanism. Wild-type male C57 mice were injected with 1.5 mg/kg of rapamycin (RAP+) or DMSO (RAP−) 100 min prior to being stimulated with a bout of eccentric contractions (EC+) or the control condition (EC), and TAs were collected at 1 h after stimulation. A, whole homogenates and TSC2 immunoprecipitates (IP:TSC2) were subjected to Western blotting analysis for the indicated proteins. The values above the blots represent the phosphorylated (P) to total protein ratio (P:T) for each group. B, graphical representation of the data in A with the P:T ratio of TSC2 expressed relative to the drug-matched control (EC). All values are presented as means (±S.E. in graph, n = 3–4/group). Symbols indicate significant difference (p ≤ 0.05) from drug-matched control (EC) (*) and stimulation-matched control (RAP−) (#).
Figure 5.
Figure 5.
Identification of the eccentric contraction-regulated phosphorylation sites on TSC2. TAs from wild-type male C57 mice were transfected with 30 μg of either the control DNA (empty vector (Empty Vec)), FLAG-tagged WT TSC2, or a FLAG-tagged phosphodefective mutant of TSC2 in which the eccentric contraction-regulated phosphorylation sites were mutated to alanines (6A Mutant). Seven days later, the TAs were stimulated with a bout of eccentric contractions (EC+) or the control condition (EC) and collected at 1 h after stimulation. A and C, whole homogenates and FLAG immunoprecipitations (IP:FLAG) were subjected to Western blotting analysis for the indicated proteins. B, FLAG immunoprecipitates of WT TSC2 were isolated and then subjected to in-gel trypsin digestion followed by LC/MS/MS to identify and quantify sites of phosphorylation. The values above the blots represent the phosphorylated (P) to total protein ratio (P:T) for each group. All values are presented as means (±S.E. in graph, n = 4–8/group). Note: the values presented for WT TSC2 in A and C are from the same data set. Symbols indicate significant difference (p ≤ 0.05) from DNA matched control (EC) (*) and stimulation-matched WT TSC2 (•).
Figure 6.
Figure 6.
The role of TSC2 phosphorylation in the eccentric contraction- and insulin-induced activation of mTOR signaling. Six-week-old iTSC2KO−/+ mice were treated with 2 mg/day of tamoxifen for 5 days (TAM). At 14 days after TAM, TAs were co-transfected with 2 μg of Myc-p70 and either 30 μg of the control plasmid DNA (empty vector), FLAG-tagged WT TSC2, or a FLAG-tagged phosphodefective mutant of TSC2 (6A Mutant). At 7 days after transfection, the TAs were stimulated with a bout of eccentric contractions (EC+) or the control condition (EC−) and collected at 1 h after stimulation (A and B), or the mice were injected with insulin (INS+) or PBS as a control condition (INS−), and TAs were collected at 30 min after injection (C and D). Whole homogenates and Myc immunoprecipitates (IP:Myc) were subjected to Western blotting analysis for the indicated proteins. The values above the blots represent the phosphorylated to total protein ratio (P:T) for each group when expressed relative to the mean value obtained in the iTSC2KO/empty vector control condition (EC− in B, and INS− in D). B and D, graphical representation of the data in A (B) or C (D) with the P:T ratio of p70 for each EC+ or INS+ group expressed relative to its genotype and plasmid DNA matched control condition. For example, in B, the values for the iTSC2KO+/EC+/empty vector group are expressed relative to the values obtained in the iTSC2KO+/ EC/empty vector group. In all cases, the values are presented as the group mean (±S.E. in graphs, n = 6–12/group). Symbols indicate significant difference (p ≤ 0.05) from the genotype and plasmid DNA matched control condition (*), the stimulation-matched condition within the empty vector groups (•), and the stimulation-matched empty vector group of iTSC2KO+ mice (#).

References

    1. Pedersen B. K., and Febbraio M. A. (2012) Muscles, exercise and obesity: skeletal muscle as a secretory organ. Nat. Rev. Endocrinol. 8, 457–465 - PubMed
    1. Seguin R., and Nelson M. E. (2003) The benefits of strength training for older adults. Am. J. Prev. Med. 25, 141–149 - PubMed
    1. Izumiya Y., Hopkins T., Morris C., Sato K., Zeng L., Viereck J., Hamilton J. A., Ouchi N., LeBrasseur N. K., and Walsh K. (2008) Fast/glycolytic muscle fiber growth reduces fat mass and improves metabolic parameters in obese mice. Cell Metab. 7, 159–172 - PMC - PubMed
    1. Srikanthan P., and Karlamangla A. S. (2011) Relative muscle mass is inversely associated with insulin resistance and prediabetes: findings from the third National Health and Nutrition Examination Survey. J. Clin. Endocrinol. Metab. 96, 2898–2903 - PubMed
    1. Proctor D. N., Balagopal P., and Nair K. S. (1998) Age-related sarcopenia in humans is associated with reduced synthetic rates of specific muscle proteins. J. Nutr. 128, 351S–355S - PubMed

MeSH terms