. 2017 Apr 15;144(8):1566-1577.
doi: 10.1242/dev.138248. Epub 2017 Mar 13.

Helios expression coordinates the development of a subset of striatopallidal medium spiny neurons

Affiliations

Helios expression coordinates the development of a subset of striatopallidal medium spiny neurons

Raquel Martín-Ibáñez et al. Development. .

Abstract

Here, we unravel the mechanism of action of the Ikaros family zinc finger protein Helios (He) during the development of striatal medium spiny neurons (MSNs). He regulates the second wave of striatal neurogenesis involved in the generation of striatopallidal neurons, which express dopamine 2 receptor and enkephalin. To exert this effect, He is expressed in neural progenitor cells (NPCs) keeping them in the G1/G0 phase of the cell cycle. Thus, a lack of He results in an increase of S-phase entry and S-phase length of NPCs, which in turn impairs striatal neurogenesis and produces an accumulation of the number of cycling NPCs in the germinal zone (GZ), which end up dying at postnatal stages. Therefore, He-/- mice show a reduction in the number of dorso-medial striatal MSNs in the adult that produces deficits in motor skills acquisition. In addition, overexpression of He in NPCs induces misexpression of DARPP-32 when transplanted in mouse striatum. These findings demonstrate that He is involved in the correct development of a subset of striatopallidal MSNs and reveal new cellular mechanisms for neuronal development.

Keywords: Cell cycle; Cell death; Ikaros; Ikzf2; Medium spiny neurons; Neurogenesis.


Conflict of interest statement

Competing interests

The authors declare no competing or financial interests.

Figures

Fig. 1.
Fig. 1.
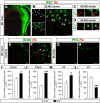
He is necessary for the second wave of striatal neurogenesis. (A) Double immunohistochemistry against He and GFP in the D1R-eGFP mice and in the D2R-eGFP mice (images show DLS and VLS, respectively). Unfilled arrowheads show single-labeled cells and filled arrowheads show double-positive cells. Scale bars: 15 μm. (B) Schematic timeline of birthdating experiments performed in He−/− or wt mice. (C) No differences in neurogenesis were detected at E12.5 between He−/− and wt mice. (D) He−/− mice exhibited lower levels of neurogenesis than wt mice at E14.5. (E) No differences in neurogenesis were detected at E16.5 between He−/− and wt mice. (F) Representative images of Ctip2+ neurons in the E18.5 (mid-striatal primordium is shown). Scale bar: 120 µm. (G) Quantification of the density and total number of Ctip2+ cells in the whole striatal primordium reveals a significant reduction in He−/− mice compare with wt mice. Results represent the mean±s.e.m. of 4-5 mice per condition. Statistical analysis was performed using Student's t-test; *P<0.05, **P<0.005.
Fig. 2.
Fig. 2.
He is expressed in NPCs at G1 cell cycle phase and regulates their proliferation. (A) E16.5 striatal primordium, double stained against Ki67 and He. He+ and Ki67+ cells are coincident at the GZ-MZ border. Scale bar: 200 µm. (B) High magnification image of Ki67-He double immunohistochemistry at the dorsal striatal primordium shows that some cells are double positive at the GZ-MZ border. Filled arrows indicate double-positive cells and unfilled arrows point to Ki67 single-labeled cells. Scale bar: 50 µm. (C,D) At the GZ-MZ border, cells expressing a low level of Ki67 (Kilow) express He (C), whereas cells expressing a high level of Ki67 (Kihigh) do not express He (D). Scale bars: 20 µm. (E,F) Double staining for BrdU and He shows that cells in S phase are not positive for He at E14.5 in the dorsomedial LGE. (E) High magnification picture shows that although He+ and BrdU+ cells are located in the same area, they do not colocalize. (F) Unfilled arrowheads indicate BrdU+ cells that have recently entered S phase as shown by the appearance of transcription units; filled arrowheads indicate cells that incorporated BrdU at more advanced cell cycle stages. Scale bars: 50 µm. (G,H) There is no coincidence between He-expressing cells and cells in M phase as detected by PH3 staining; low (G) and high (H) magnification images of DMS are shown. Scale bars: 50 µm. (I-L) Quantification of the total number of proliferating cells in the whole GZ show that lack of He induces a significant increase at E14.5 (I), E16.5 (J) and P3 (K) and a significant decrease at P7 (L) compared with wt mice. Results represent the mean±s.e.m. of 5-7 mice per condition. Statistical analysis was performed using Student's t-test; *P<0.05, ***P<0.001.
Fig. 3.
Fig. 3.
He is necessary for cell cycle S-phase regulation. (A) He−/− mice-derived neurospheres exhibited an increase in the length of S phase and cell cycle compared with wt mice-derived neurospheres. (B) Mitotic BrdU labeling index, which is used to calculate G2/M phase length, was the same in both wt and He−/− mice-derived neurospheres. (C,D) Schematic of the percentages of the length of the cell cycle phases with respect to the total cell cycle duration obtained from LOF (C) and GOF (D) experiments. (E) Schematic timeline of S-phase entry/exit experiments performed with a double pulse of BrdU and EdU in wt and He−/− mice-derived neurospheres. (F) A higher number of NPCs entered S phase in He−/− mice-derived neurospheres compared with wt mice-derived ones, whereas no differences were observed between both cultures in the number of cells that exit S phase. (G,H) Representative images of BrdU and EdU double staining performed in wt and He−/− mice-derived neurospheres. Arrows indicate double-positive cells. Scale bar: 50 µm. Results represent the mean±s.e.m. of 4-5 LGE-derived neurosphere cultures. Statistical analysis was performed using Student's t-test; *P<0.05, **P<0.005.
Fig. 4.
Fig. 4.
He regulates cyclin E expression. (A-D) PCNA (A,C) and cyclin E (Cy.E; B,D) protein quantification show a significant increase in the levels of both proteins in He­­−/−-derived neurospheres compared with wt neurospheres. Representative blots are shown for PCNA (C) and cyclin E (D). (E-H) By contrast, He overexpression induces a significant decrease in PCNA (E,G) and cyclin E (F,H) protein levels compared with the control eGFP. Representative blots are shown for PCNA (G) and cyclin E (H). (I) mRNA expression of He in neurosphere cultures overexpressing He or the control eGFP. (J) Cyclin E mRNA levels are downregulated in He overexpressing neurospheres compared with the control eGFP. (K) In vivo analysis shows an increased percentage of cells entering into S phase in He−/− LGEs compared with wt at E14.5. (L,M) Quantification of He−/− and wt E14.5 LGEs indicates significantly increased protein expression of cyclin E in the absence of He. (M) Representative blots are shown for cyclin E in LOF in vivo experiments. (N) Cumulative counts peak graph from the chip-Seq analysis of He interaction. The cyclin E (Ccne1) gene region shows two prominent hits one within the proximal promoter region, and one downstream of the gene. Tubulin (Tub) was used as loading control for western blots. For in vitro studies, results represent the mean±s.e.m. of 4-5 LGE-derived neurosphere cultures. RT-PCR results represent the mean±s.e.m. of 4-5 independent samples and are expressed relative to control eGFP, considered as 100%. For in vivo studies, results represent the mean±s.e.m. of 4-5 LGEs. Statistical analysis was performed using Student's t-test; *P<0.05, **P<0.005.
Fig. 5.
Fig. 5.
He knockout mice exhibit increased programmed cell death at postnatal stages. (A,B) Representative photomicrographs corresponding to P3 striatal coronal sections from wt (A) and He−/− (B) mice immunostained for cleaved caspase 3. Scale bars: 200 µm. Ctx, cortex. (C) Lack of He induces a significant increase in the total number of cleaved caspase-3 (C-Casp3)+ cells in the GZ at P3. (D) He−/− mice exhibited an increase in the total number of C-Casp3+ cells in the MZ at P3 compared with wt mice. (E,F) No differences in the total number of C-Casp3+ cells were observed between genotypes in the GZ (E) or in the MZ at P7 (F). (G) Injection of EdU at E18.5 and recovery of the He−/− pups at P3 permitted the examination of whether cells that exit the cell cycle after E18.5 and migrate to the striatum MZ are positive for C-Casp3. (H-K) Representative photomicrographs of striatal coronal ventral section showing colocalization of EdU and C-Casp3. Scale bar: 30 µm. Results represent the mean±s.e.m. of 4-5 mice per condition. Statistical analysis was performed using Student's t-test; *P<0.05, **P<0.005.
Fig. 6.
Fig. 6.
Lack of He during development alters the number of mature MSNs in adult He−/− mice. (A-J) Stereological cell counts of neuronal striatal populations in wt and He−/− mice striatum. (A) The total number of striatal calbindin+ cells is reduced in He−/− adult mice compared with wt adult mice. (B) The total number of striatal DARPP-32+ cells is reduced in He−/− adult mice compared with wt adult mice. (C,D) The total number of striatal ChAT+ (C) or parvalbumin+ (D) cells is not altered between wt and He−/− adult mice. (E-H) The total number of striatal DARPP-32+ cells is specifically reduced in the DMS (E) in He−/− adult mice compared with wt adult mice. No differences are found in the DLS (F), VMS (G) and VLS (H) between both genotypes. (I) The total number of ENK+ cells is reduced in the DMS of He−/− compared with wt mice. (J) The total number of SP+ cells is not altered in the DMS between wt and He−/− mice. (K) Schematic showing the division of a coronal striatal section into DMS, DLS, VMS and VLS regions. Results represent the mean±s.e.m. of 4-5 mice per condition. Statistical analysis was performed by using Student's t-test; *P<0.05, **P<0.005.
Fig. 7.
Fig. 7.
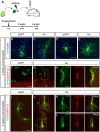
He induces an MSN phenotype in vivo. (A) Schematic of the transplantation of eGFP and He-overexpressing NPCs into the mouse neonatal forebrain. (B-H) Representative images of forebrain coronal sections containing grafted cells 2 weeks post-transplantation, immunostained for GFP and DARPP-32. Compared with control cells (B,D), He overexpressing cells display more robust branching (C,E) and a few of them start to express DARPP-32 (G,H). (I-L) Representative images of grafted cells 4 weeks post-transplantation, labeled for GFP and DARPP-32. In contrast to control cells (I), several He overexpressing cells display DARPP-32 expression (J-L), indicative of the acquisition of a striatal MSN fate. Scale bars: 50 µm (B,C); 20 µm (D-G,I,J); 10 µm (H,K,L).
Fig. 8.
Fig. 8.
The acquisition of new motor skills is impaired in He−/− mice. (A-C) Motor coordination and balance were analyzed in wt and He−/− mice by performing the simple swimming test (A), the balance beam (B) and the rotarod task (C). Values are expressed as mean±s.e.m. of 7-8 mice per condition. Data were analyzed by two-way ANOVA and Bonferroni's post-hoc test. *P<0.05, **P<0.005, ***P<0.001.

References

    1. Agoston D. V., Szemes M., Dobi A., Palkovits M., Georgopoulos K., Gyorgy A. and Ring M. A. (2007). Ikaros is expressed in developing striatal neurons and involved in enkephalinergic differentiation. J. Neurochem. 102, 1805-1816. 10.1111/j.1471-4159.2007.04653.x - DOI - PubMed
    1. Alsiö J. M., Tarchini B., Cayouette M. and Livesey F. J. (2013). Ikaros promotes early-born neuronal fates in the cerebral cortex. Proc. Natl. Acad. Sci. USA 110, E716-E725. 10.1073/pnas.1215707110 - DOI - PMC - PubMed
    1. Alvarez-Buylla A., García-Verdugo J. M. and Tramontin A. D. (2001). A unified hypothesis on the lineage of neural stem cells. Nat. Rev. Neurosci. 2, 287-293. 10.1038/35067582 - DOI - PubMed
    1. Arai Y., Pulvers J. N., Haffner C., Schilling B., Nüsslein I., Calegari F. and Huttner W. B. (2011). Neural stem and progenitor cells shorten S-phase on commitment to neuron production. Nat. Commun. 2, 154 10.1038/ncomms1155 - DOI - PMC - PubMed
    1. Arlotta P., Molyneaux B. J., Jabaudon D., Yoshida Y. and Macklis J. D. (2008). Ctip2 controls the differentiation of medium spiny neurons and the establishment of the cellular architecture of the striatum. J. Neurosci. 28, 622-632. 10.1523/JNEUROSCI.2986-07.2008 - DOI - PMC - PubMed

Publication types

MeSH terms