. 2017 Feb 15;31(4):347-352.
doi: 10.1101/gad.291500.116. Epub 2017 Mar 13.

Transcription factor Wilms' tumor 1 regulates developmental RNAs through 3' UTR interaction

Affiliations

Transcription factor Wilms' tumor 1 regulates developmental RNAs through 3' UTR interaction

Ruthrothaselvi Bharathavikru et al. Genes Dev. .

Abstract

Wilms' tumor 1 (WT1) is essential for the development and homeostasis of multiple mesodermal tissues. Despite evidence for post-transcriptional roles, no endogenous WT1 target RNAs exist. Using RNA immunoprecipitation and UV cross-linking, we show that WT1 binds preferentially to 3' untranslated regions (UTRs) of developmental targets. These target mRNAs are down-regulated upon WT1 depletion in cell culture and developing kidney mesenchyme. Wt1 deletion leads to rapid turnover of specific mRNAs. WT1 regulates reporter gene expression through interaction with 3' UTR-binding sites. Combining experimental and computational analyses, we propose that WT1 influences key developmental and disease processes in part through regulating mRNA turnover.

Keywords: 3′ UTR; FLASH; RNA secondary structures; WT1; developmental pathways; hybrids.


Figures

Figure 1.
Figure 1.
WT1 binds to multiple categories of RNA. (A) Pie charts of clusters assigned to protein-coding, noncoding, and other biotypes in ES (top left) and M15 (bottom left) and the proportion of ncRNAs in ES (top right) and M15 (bottom right). (B) The density of clusters identified by RIP-seq in ES (top) and M15 (bottom for all protein-coding RNAs (blue bars) and the density at 5′ and 3′ ends (green and red bars, respectively). (C) Genome browser snapshot of alignment of RIP-seq reads from ES and M15 cell lines mapping to Igfbp5. (D) Validation of the WT1-interacting protein-coding RNA biotype. Igfbp5, Igfbp3, Pdgf, Peg3, Wnt5a, Wt1, and Podxl interaction was confirmed by RIP in the M15 cell line analyzed by quantitative RT–PCR (qRT–PCR) with target-specific primers.
Figure 2.
Figure 2.
UV cross-linking confirms WT1 enrichment over 3′ UTR of mRNAs. (A) Schematic of FLASH protocol. (B) Pie charts showing the proportion of clusters of protein-coding, noncoding, and other biotypes (top) and ncRNAs (bottom) in the FLASH data. (C) The density of clusters identified in WT1 FLASH for protein coding (blue bars) and the density at the 5′ and 3′ ends (green and red bars, respectively). (D) REVIGO (reduce and visualize GO) plot of P-value-based GO terms associated with WT1-interacting RNA identified by FLASH.
Figure 3.
Figure 3.
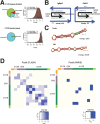
WT1 associates with RNA at the 3′ UTR through secondary structures. (A) Pie charts of WT1 FLASH-associated hybrids (top) compared with input (bottom) in M15 cells analyzed as energy maps. (B) Local hybridization in 3′ UTRs for the representative targets Igfbp5 and Cdh11. (C) RNA fold predictions of secondary structures of Podxl and Wt1 3′ UTR interactions. (D) Heat map representation of 3′ UTR intramolecular interactions in Podxl RNA identified by FLASH and PARIS (psoralen analysis of RNA interactions).
Figure 4.
Figure 4.
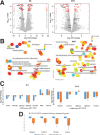
WT1 regulates the expression of a subset of the RNA-binding targets. (A) Volcano plot of transcriptome changes of E14 and Wt1 knockout ES cell lines (left) ( n = 2) and Wt1 stable knockdown in the M15 cell line compared with the lacZ controls (right) (n = 2). The X-axis is log2 fold change, and the Y-axis is log10 P-value. Selected genes are highlighted. (B) REVIGO plot of GO analysis based on P-values of the differentially regulated genes in ES (left) and M15 (right) upon Wt1 knockout/knockdown, respectively. (C) WT1-interacting and regulated targets were validated by qRT–PCR. RNA changes in ES cells (left) and M15 cells (right) compared between the knockout/knockdown and control. Log2 fold changes observed in RNA sequencing (RNA-seq) (n = 2) and qRT–PCR (n = 3) are represented by blue and red bars, respectively. (***) P < 0.0001; (**) P < 0.001; (*) P < 0.01, unpaired t-test. (D) RNA changes in GFP+ FACS-sorted embryonic day 13.5 (E13.5) kidney cells compared with litter-matched cre control. n = 3.
Figure 5.
Figure 5.
WT1 regulates RNA stability. (A) Scatter plots of log of the ratio of WT1 RIP-seq RPKM values to input (Y-axis) compared with the log of the ratio of coverage of genome-wide (X-axis) and the 3′ UTR (gray symbols), up-regulated genes (green), and down-regulated genes (red) (ES [top] and M15 [bottom]). (B) Relative percentage expression (Y-axis) of genes after actinomycin treatment in hours (X-axis) compared between knockout/knockdown and control cells (ES [top] and M15 [bottom]). (C) Luciferase reporter activity of WT1-interacting UTR-binding regions transfected in knockdown cells compared with control. Vector-alone transfections represent background luciferase activity without binding regions. (D) A working model for WT1 RNA interaction and its functional significance.

References

    1. Astuti D, Morris MR, Cooper WN, Staals RHJ, Wake NC, Fews G, Gill H, Gentle D, Shuib S, Ricketts CJ, et al. 2012. Germline mutations in DIS3L2 cause the Perlman syndrome of overgrowth and Wilms tumor susceptibility. Nat Genet 44: 277–284. - PubMed
    1. Bailey TL, Elkan C. 1994. Fitting a mixture model by expectation maximization to discover motifs in biopolymers. Proc Int Conf Intell Syst Mol Biol 2: 28–36. - PubMed
    1. Barbaux S, Niaudet P, Gubler MC, Grünfeld JP, Jaubert F, Kuttenn F, Fékété CN, Souleyreau-Therville N, Thibaud E, Fellous M, et al. 1997. Donor splice-site mutations in WT1 are responsible for Frasier syndrome. Nat Genet 17: 467–470. - PubMed
    1. Bardeesy N, Pelletier J. 1998. Overlapping RNA and DNA binding domains of the wt1 tumor suppressor gene product. Nucleic Acids Res 26: 1784–1792. - PMC - PubMed
    1. Bharathavikru R, Dudnakova T. 2016. Methods to identify and validate WT1–RNA interaction. Methods Mol Biol 1467: 197–209. - PubMed

Publication types

LinkOut - more resources