. 2017 Aug;28(8):2431-2442.
doi: 10.1681/ASN.2016070732. Epub 2017 Mar 13.

Renal Tubular Ubiquitin-Protein Ligase NEDD4-2 Is Required for Renal Adaptation during Long-Term Potassium Depletion

Affiliations

Renal Tubular Ubiquitin-Protein Ligase NEDD4-2 Is Required for Renal Adaptation during Long-Term Potassium Depletion

Lama Al-Qusairi et al. J Am Soc Nephrol. 2017 Aug.

Abstract

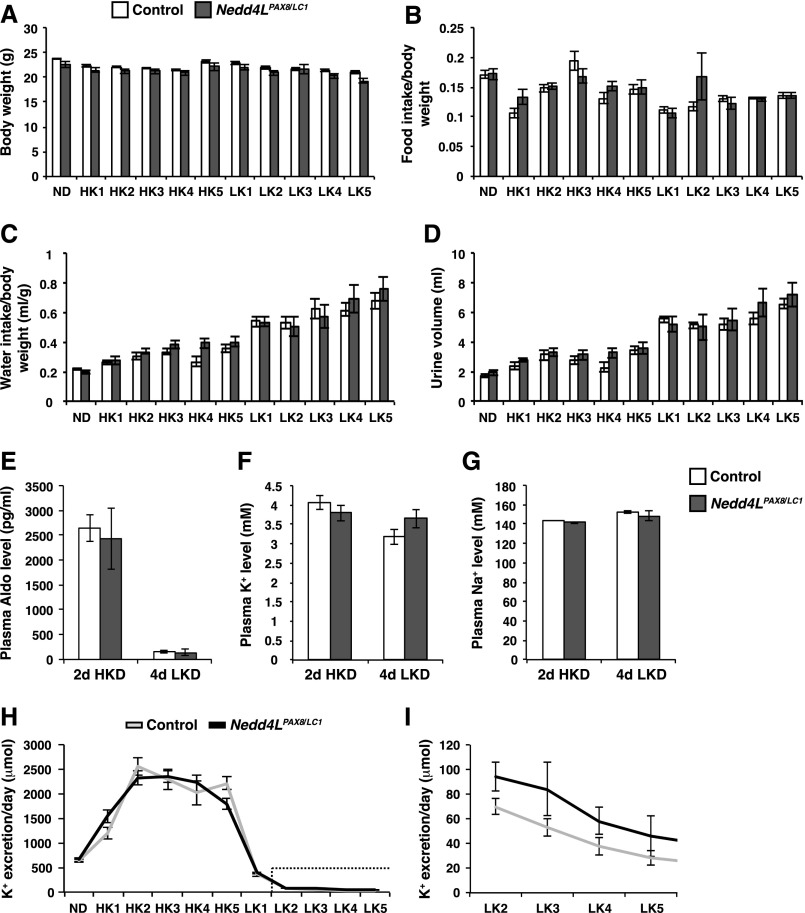
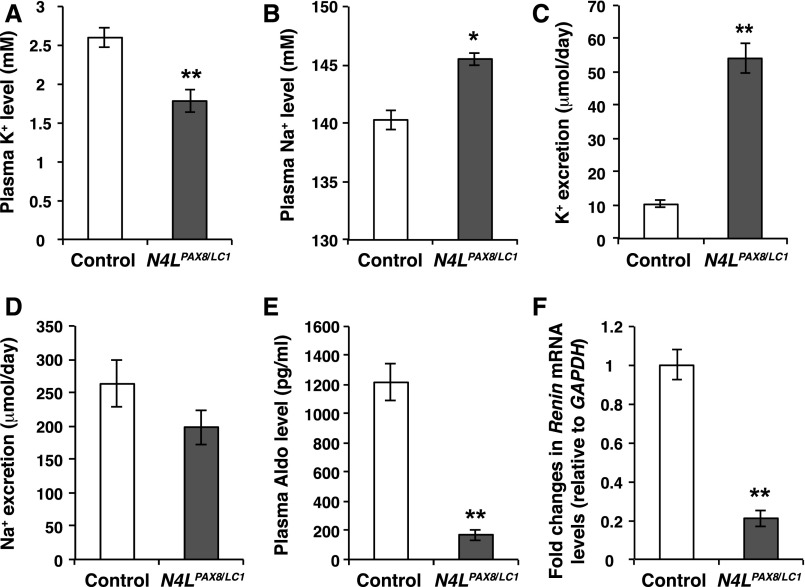
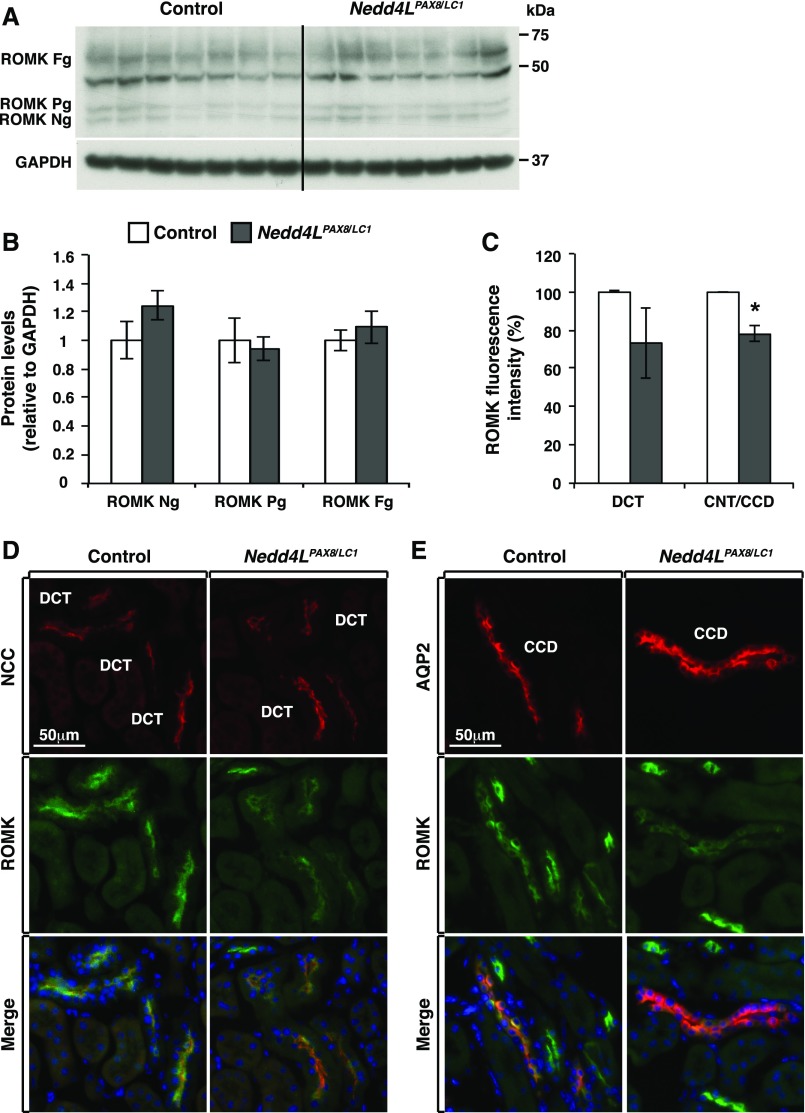
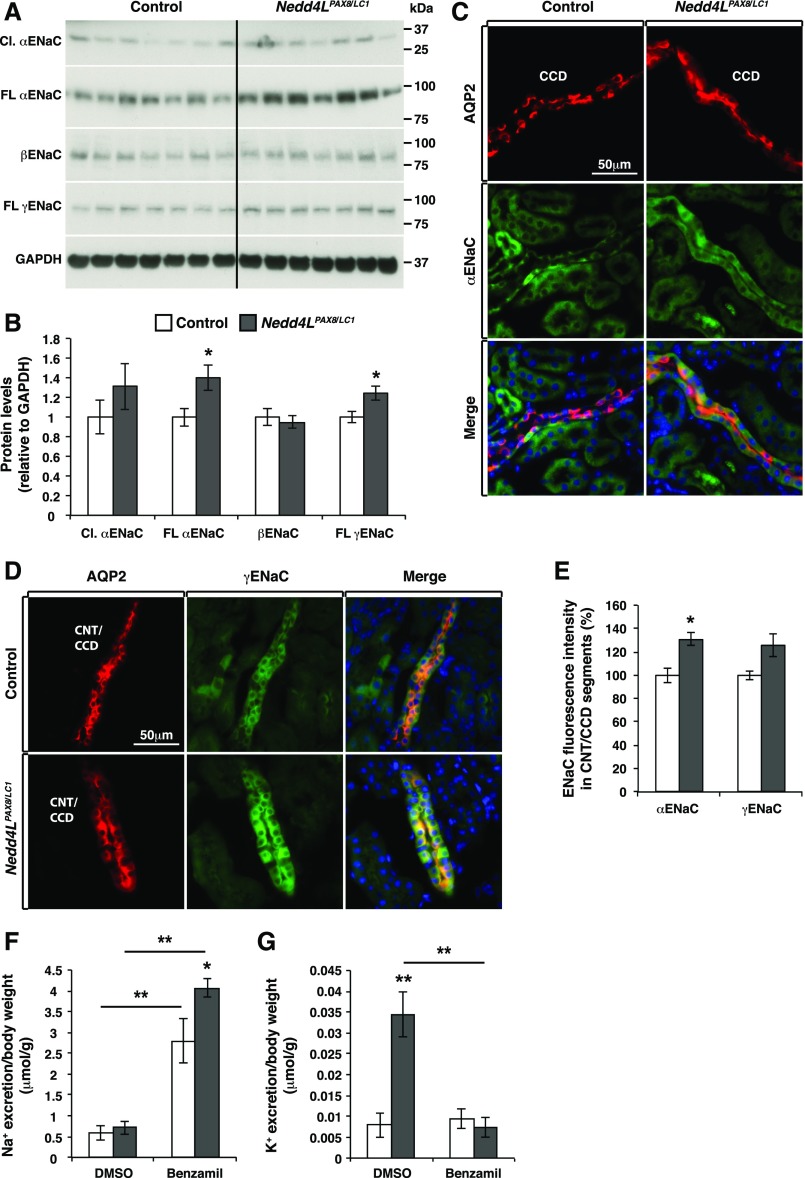
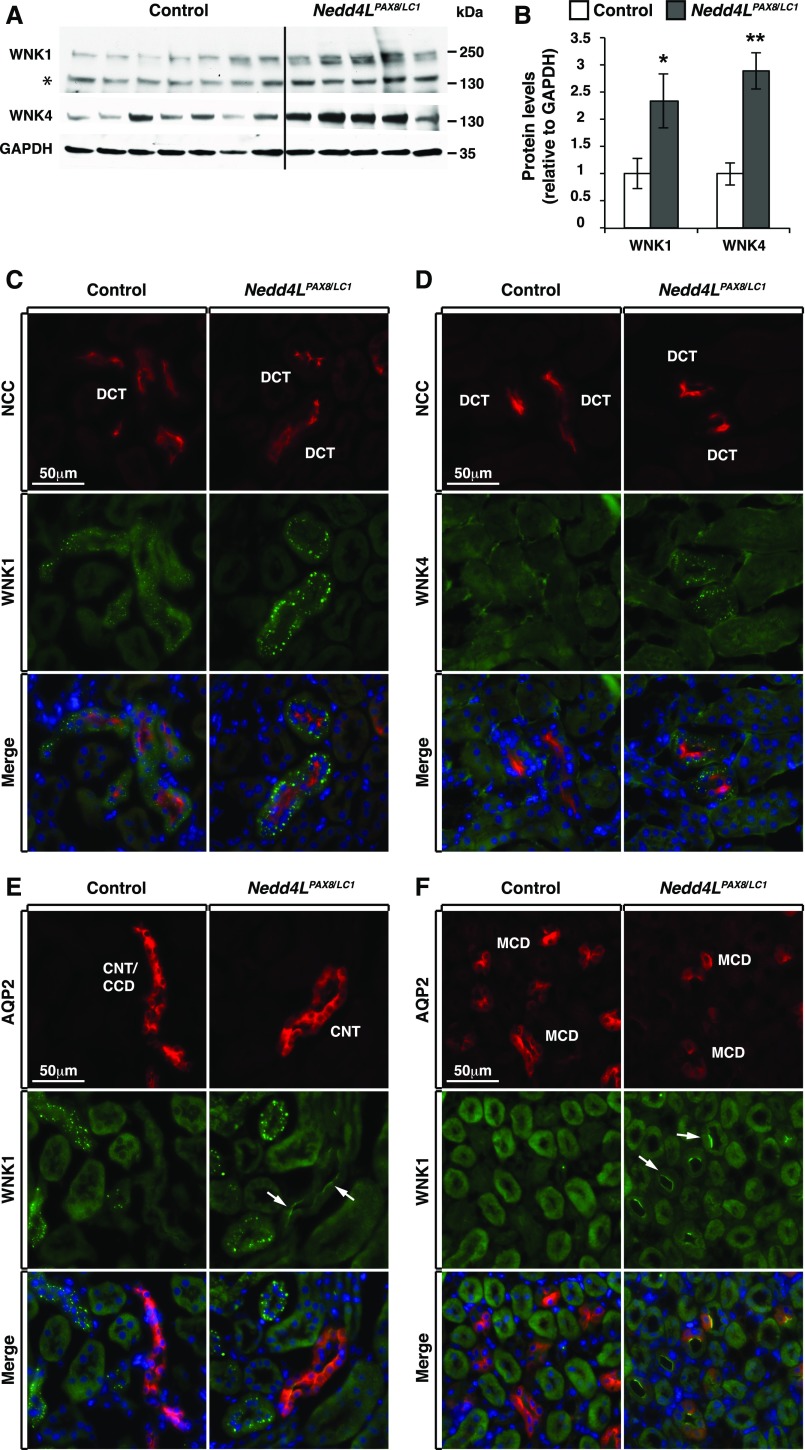
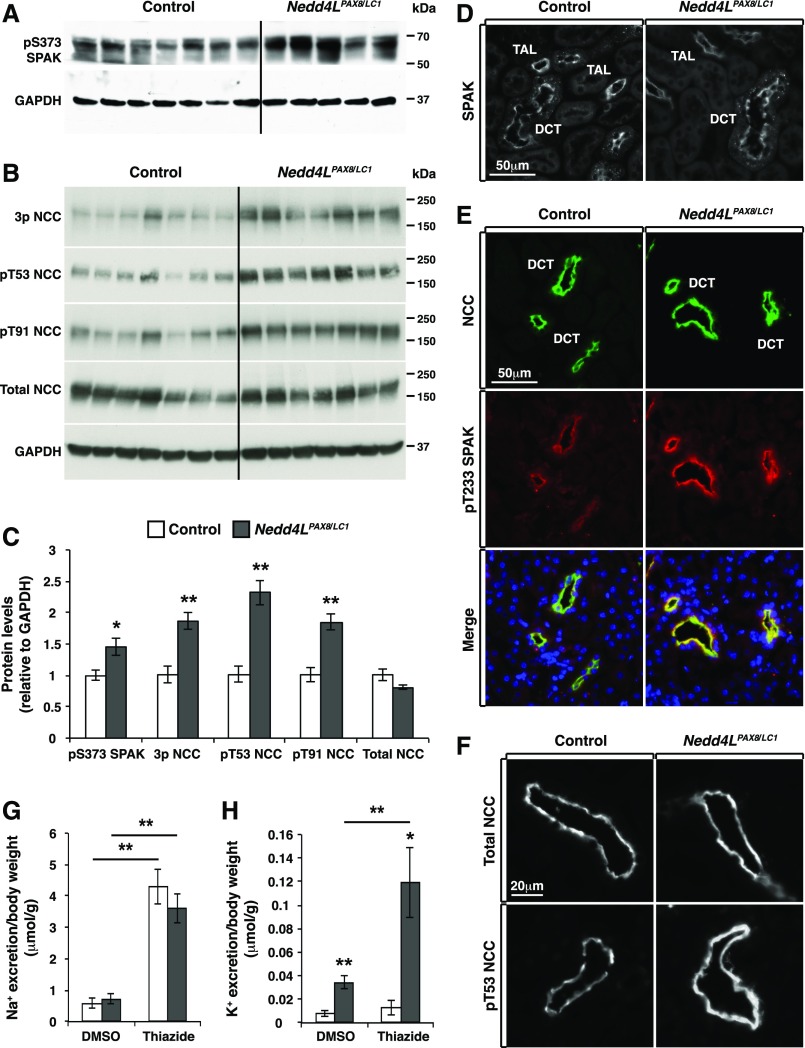
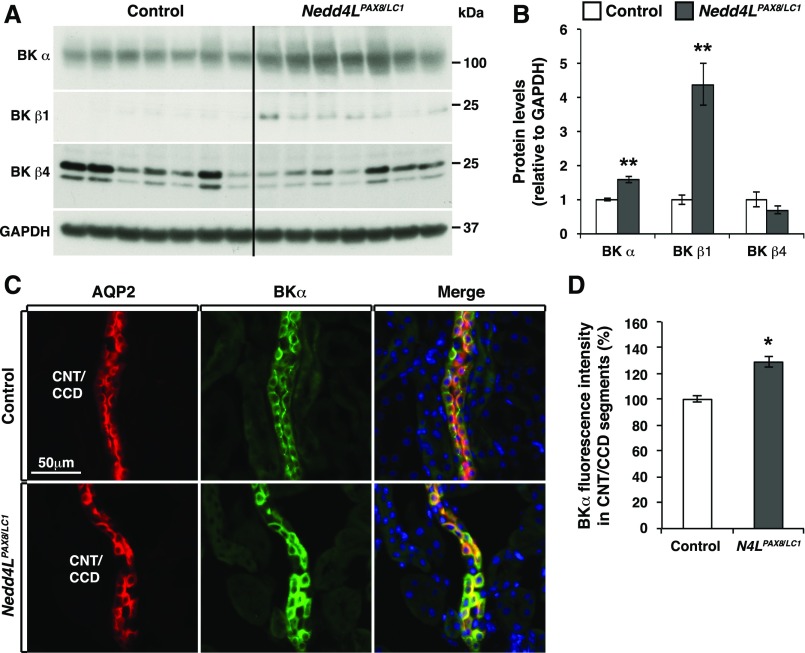
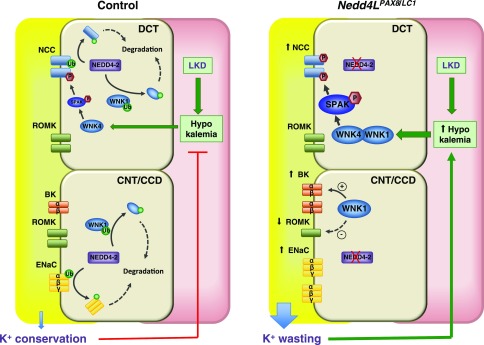
Adaptation of the organism to potassium (K+) deficiency requires precise coordination among organs involved in K+ homeostasis, including muscle, liver, and kidney. How the latter performs functional and molecular changes to ensure K+ retention is not well understood. Here, we investigated the role of ubiquitin-protein ligase NEDD4-2, which negatively regulates the epithelial sodium channel (ENaC), Na+/Cl- cotransporter (NCC), and with no-lysine-kinase 1 (WNK1). After dietary K+ restriction for 2 weeks, compared with control littermates, inducible renal tubular NEDD4-2 knockout (Nedd4LPax8/LC1 ) mice exhibited severe hypokalemia and urinary K+ wasting. Notably, expression of the ROMK K+ channel did not change in the distal convoluted tubule and decreased slightly in the cortical/medullary collecting duct, whereas BK channel abundance increased in principal cells of the connecting tubule/collecting ducts. However, K+ restriction also enhanced ENaC expression in Nedd4LPax8/LC1 mice, and treatment with the ENaC inhibitor, benzamil, reversed excessive K+ wasting. Moreover, K+ restriction increased WNK1 and WNK4 expression and enhanced SPAK-mediated NCC phosphorylation in Nedd4LPax8/LC1 mice, with no change in total NCC. We propose a mechanism in which NEDD4-2 deficiency exacerbates hypokalemia during dietary K+ restriction primarily through direct upregulation of ENaC, whereas increased BK channel expression has a less significant role. These changes outweigh the compensatory antikaliuretic effects of diminished ROMK expression, increased NCC phosphorylation, and enhanced WNK pathway activity in the distal convoluted tubule. Thus, NEDD4-2 has a crucial role in K+ conservation through direct and indirect effects on ENaC, distal nephron K+ channels, and WNK signaling.

Keywords: ENaC; K channels; ion transport; signaling.


Figures

Figure 1.
Figure 1.
Metabolic parameters of Nedd4LPax8/LC1 mice challenged by HKD and LKD. (A–D) Body weight (A), food intake/body weight (B), water intake/body weight (C), and urine volume (D). No significant difference was observed between control and mutant mice in the measured parameters (eight controls and seven Nedd4LPax8/LC1 mice). (E–G) Plasma aldosterone (E), plasma K+ (F), and plasma Na+ (G) levels after 2 days of HKD (ten controls and seven Nedd4LPax8/LC1 mice) and after 4 days of LKD (five controls and four Nedd4LPax8/LC1 mice). Note the sharp reduction in aldosterone levels in response to LKD. No difference was observed between control and mutant mice in plasma aldosterone, Na+, and K+ levels. (H and I) Urinary K+ excretion per day under normal diet and during 5 days of HKD and 5 days of LKD; (I) is a magnification of the dotted box in (H), indicating K+ excretion under LKD starting from day 2 until day 5. Mutant mice seem to be less able to reduce their urinary K+ excretion than control littermates. The difference was not statistically significant (eight controls and seven Nedd4LPax8/LC1 mice). HK, day of high K+ diet; LK, day of low K+ diet; ND, normal diet.
Figure 2.
Figure 2.
Nedd4LPax8/LC1 mice develop a K+ wasting phenotype after 2 weeks of LKD. (A and B) Plasma K+ and Na+ in control (white) and Nedd4LPax8/LC1 (gray) mice after 2 weeks of LKD. The renal suppression of NEDD4-2 results in severe hypokalemia and a slight increase in plasma [Na+] (n= 12 controls and five Nedd4LPax8/LC1 mice). (C and D) Analysis of 24-hour urinary K+ and Na+ excretion reveal elevated K+ excretion in mutant mice and concomitant but not significant Na+ retention (six mice in each group). (E and F) Plasma aldosterone (n=12 controls and five Nedd4LPax8/LC1 mice) and renin expression (n= five control and five Nedd4LPax8/LC1 mice) are decreased in Nedd4LPax8/LC1 mice as compared with controls. *P<0.05; **P<0.01.
Figure 3.
Figure 3.
ROMK apical localization is decreased in the distal nephron of Nedd4LPax8/LC1 mice under LKD. (A) Western blot analysis of ROMK from control and Nedd4LPax8/LC1 mice after 2 weeks of LKD; the band at 50 kDa is nonspecific. (B) Protein quantification of (A) showing similar expression levels of ROMK in both genotypes (seven mice in each group). (C) ROMK fluorescence intensity in DCT and CNT/CCD segments (from D and E) from control and Nedd4LPax8/LC1 mice. Shown are the ratios of cortical ROMK labeling over the surface area of NCC or AQP2-expressing cells, respectively. *P<0.05. (D and E) Costaining of ROMK (green) with NCC (red) (D) and AQP2 (red) (E) from control and Nedd4LPax8/LC1 mice. ROMK level is significantly decreased in the CNT/CCD (C and E) segments of Nedd4LPax8/LC1 mice, the decrease of ROMK in the DCT is not statistically significant (C and D) (four mice in each group). Fg, fully glycosylated; Ng, nonglycosylated ROMK; Pg, partially glycosylated.
Figure 4.
Figure 4.
ENaC expression and activity are increased in Nedd4LPax8/LC1 mice after 2 weeks of LKD. (A and B) Western blot analysis of ENaC in control and Nedd4LPax8/LC1 mice after 2 weeks of LKD and protein quantification showing a significant increase in the full-length αENaC and γENaC subunits (seven mice in each group). (C and D) Costaining of αENaC (C) and γENaC (D) (both in green) and AQP2 (in red) in control and Nedd4LPax8/LC1 mice. (E) Mean of αENaC and γENaC fluorescence intensity in CNT/CCD segments showing a significant increase in αENaC (but not γENaC) abundance in Nedd4LPax8/LC1 mice compared with controls (four mice in each group). (F) Benzamil significantly increased Na+ excretion compared with vehicle (DMSO) in both genotypes, and the loss of Na+ in the benzamil-treated Nedd4LPax8/LC1 mice is significantly higher than that of control mice. (G) Benzamil treatment efficiently prevents the K+ wasting observed in Nedd4LPax8/LC1 mice (seven mice in each group). *P<0.05; **P<0.01
Figure 5.
Figure 5.
WNK1 and WNK4 are upregulated in Nedd4LPax8/LC1-deficient mice. (A and B) Western blot analysis of WNK1 and WNK4 in control and Nedd4LPax8/LC1 mice after 2 weeks of LKD, and protein quantification showing a significant increase in the two WNK proteins in Nedd4LPax8/LC1 mice (* indicates a nonspecific band; seven controls and five Nedd4LPax8/LC1 mice). (C and D) Costaining of NCC (red) with WNK1 (C) and WNK4 (D) (both in green) in control and Nedd4LPax8/LC1 mice. WNK1 and WNK4 foci are more prominent in the DCT of mutant versus control mice. (E and F) Costaining of WNK1 (green) and AQP2 (red) showing an increase in WNK1 apical localization in the CNT/CCD (E) (arrows) and MCD (F) (arrows) of mutant mice. *P<0.05; *P<0.01
Figure 6.
Figure 6.
NCC and SPAK phosphorylation is increased in Nedd4LPax8/LC1 mice after 2 weeks of LKD. (A and B) Western blot analysis of SPAK (A) and NCC (B) phosphorylation in control and Nedd4LPax8/LC1 mice. (C) Protein quantification from (A) and (B) showing a significant increase in S373 phosphorylated SPAK and NCC phosphorylation at several residues including T53, T91, or the combination of T43, T53, and T58 (3P-NCC), with no modification of total NCC (seven controls and five to seven Nedd4LPax8/LC1 mice). (D) Immunostaining of total SPAK in control and Nedd4LPax8/LC1 mice showing comparable level and localization of the protein in the cortex of both genotypes. (E) Costaining of NCC (green) and T233 phosphorylated SPAK (red) in control and Nedd4LPax8/LC1 mice. An increase in SPAK phosphorylation was observed in the DCT of mutant mice. (F) Immunostaining of total (upper panel) and T53 phosphorylated NCC (lower panel) in control and Nedd4LPax8/LC1 mice after 2 weeks of LKD. Increased NCC phosphorylation is observed in Nedd4LPax8/LC1 mice, with similar apical localization of the transporter in both genotypes. (G and H) Thiazide treatment induced an equivalent increase in Na+ excretion in control and Nedd4LPax8/LC1 mice compared with vehicle (DMSO) (G), whereas K+ excretion was exacerbated in mutant mice by thiazide treatment (H) (seven mice in each group). *P<0.05; **P<0.01.
Figure 7.
Figure 7.
BK channels are upregulated in CNT/CCD principal cells of Nedd4LPax8/LC1 mice. (A and B) Western blot analysis of BK in control and Nedd4LPax8/LC1 mice after 2 weeks of LKD, and protein quantification revealing a significant increase in BKα and BKβ1 expression (seven mice of each genotype). (C) Costaining of BKα (green) and AQP2 (red) in control and Nedd4LPax8/LC1 mice. (D) Quantification of BKα fluorescence intensity in the CNT/CCD segments. BKα labeling was significantly increased in the principal cells of mutant CNT/CCD segments. *P<0.05; **P<0.01.
Figure 8.
Figure 8.
Model of NEDD4-2 action in K+ conservation in the CNT/CCD. Under K+ restriction, the aldosterone/MR/SGK1 regulatory axis is switched off, resulting in maximal NEDD4-2 activity. In controls, the active NEDD4-2 primarily downregulates ENaC. WNK1 is also downregulated, resulting in limited BK channel activity, Moreover, hypokalemia causes WNK4 activation, and stimulation of SPAK and NCC to limit distal Na+ delivery to ENaC and voltage-dependent K+ excretion via ROMK. Collectively, these transport processes act synergistically to promote K+ conservation. The deregulation of this process in Nedd4LPax8/LC1 mice results in K+ wasting, primarily because of the release of ENaC from tonic NEDD4-2 inhibition. WNK1 is also increased, causing elevated BK expression. The severe hypokalemia caused by enhanced K+ wasting further stimulates WNK1/WNK4, SPAK and NCC, which, together with reduced ROMK expression, partially compensates for the K+ wasting induced by NEDD4-2 deletion.

References

    1. Greenlee M, Wingo CS, McDonough AA, Youn JH, Kone BC: Narrative review: Evolving concepts in potassium homeostasis and hypokalemia. Ann Intern Med 150: 619–625, 2009 - PMC - PubMed
    1. Youn JH, McDonough AA: Recent advances in understanding integrative control of potassium homeostasis. Annu Rev Physiol 71: 381–401, 2009 - PMC - PubMed
    1. Gennari FJ: Hypokalemia. N Engl J Med 339: 451–458, 1998 - PubMed
    1. Kjeldsen K: Hypokalemia and sudden cardiac death. Exp Clin Cardiol 15: e96–e99, 2010 - PMC - PubMed
    1. Unwin RJ, Luft FC, Shirley DG: Pathophysiology and management of hypokalemia: A clinical perspective. Nat Rev Nephrol 7: 75–84, 2011 - PubMed

MeSH terms

Substances

LinkOut - more resources