. 2017 Mar 28;114(13):E2644-E2653.
doi: 10.1073/pnas.1700082114. Epub 2017 Mar 13.

Phosphorylation-induced conformational dynamics in an intrinsically disordered protein and potential role in phenotypic heterogeneity

Affiliations

Phosphorylation-induced conformational dynamics in an intrinsically disordered protein and potential role in phenotypic heterogeneity

Prakash Kulkarni et al. Proc Natl Acad Sci U S A. .

Abstract

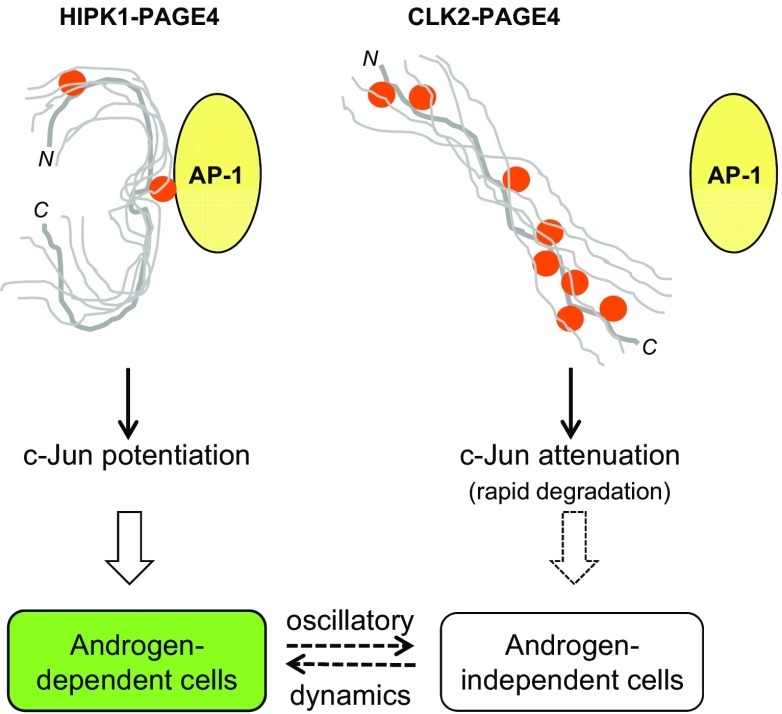
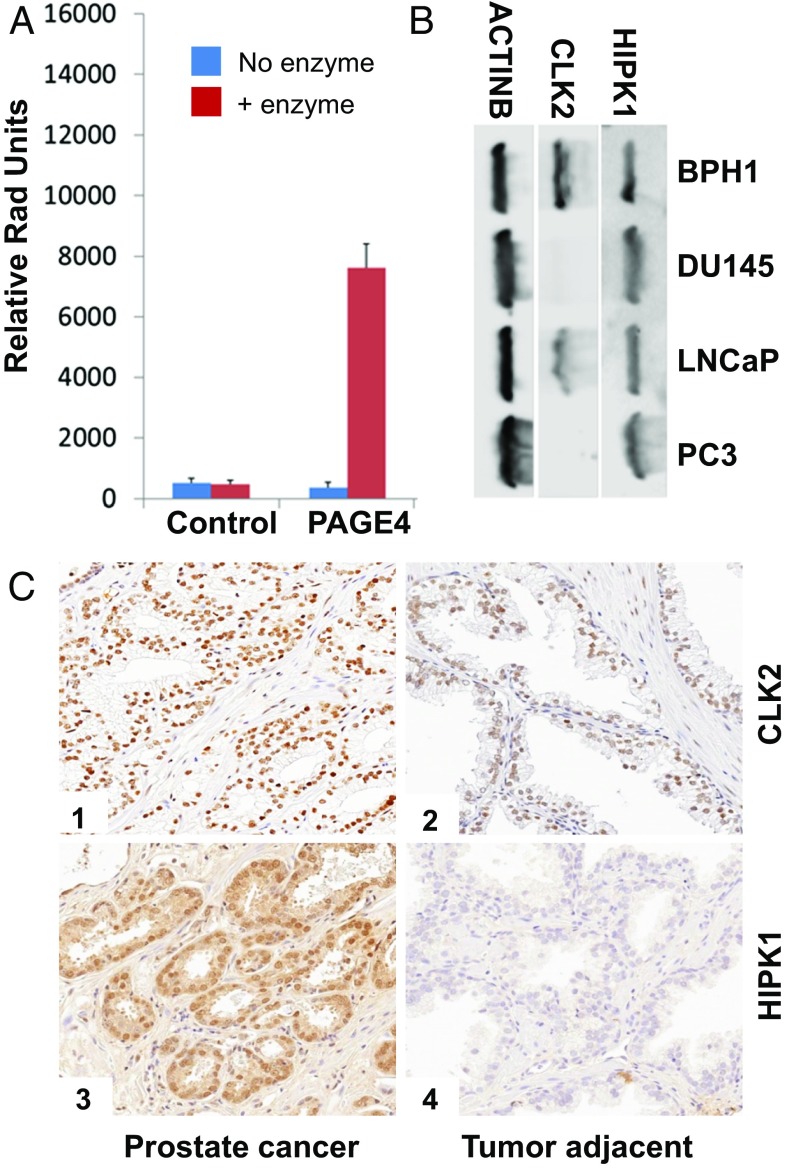
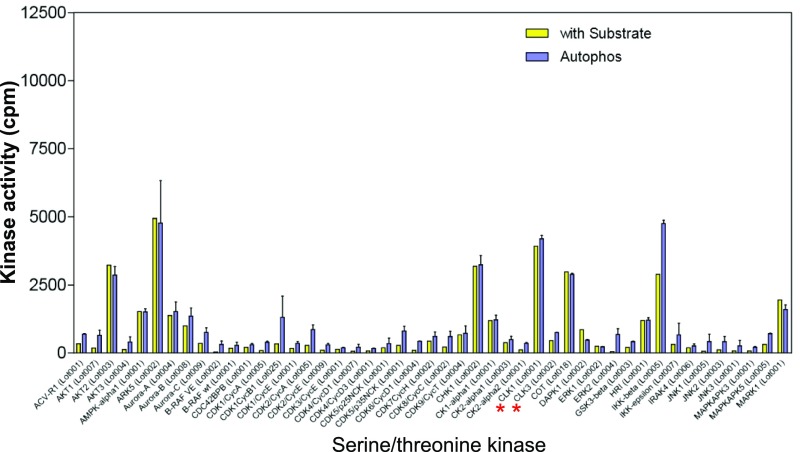
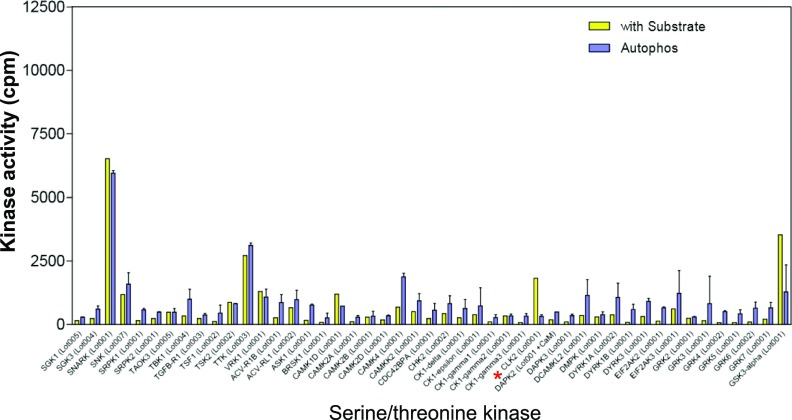
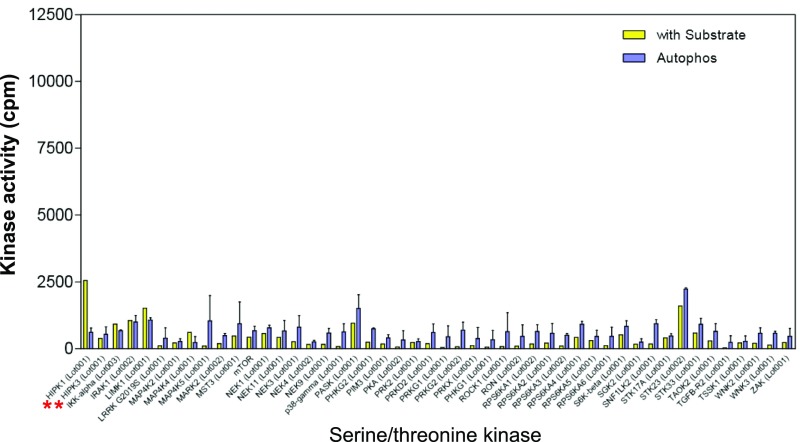
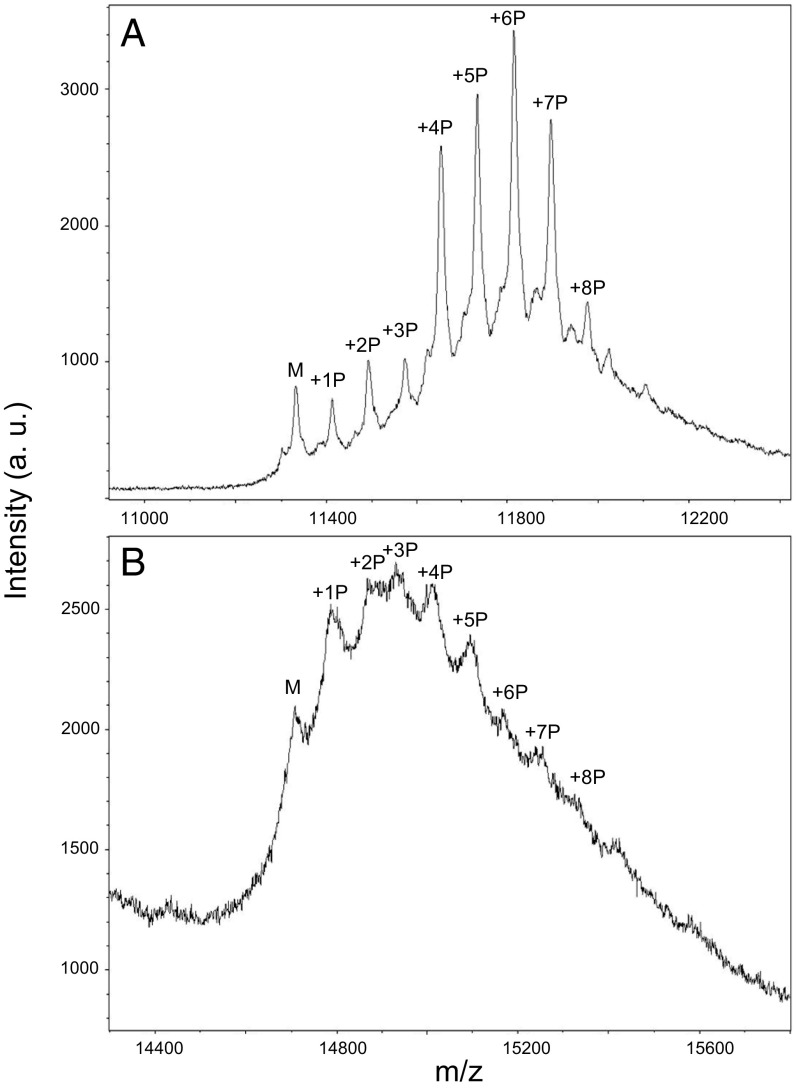
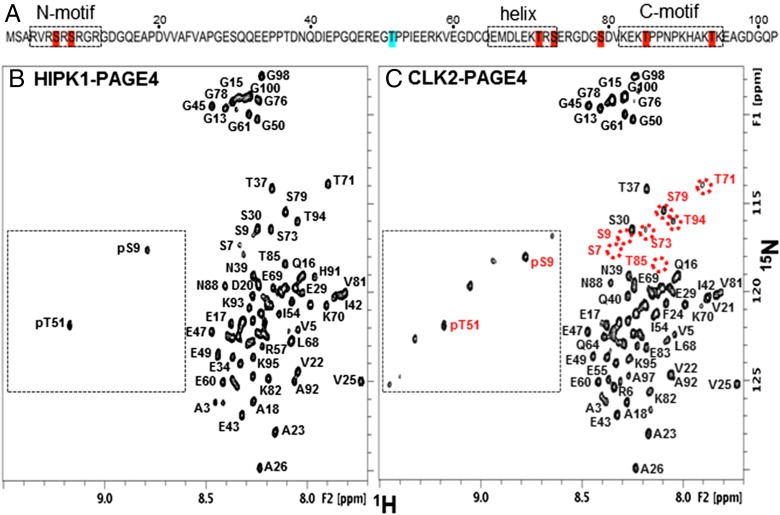
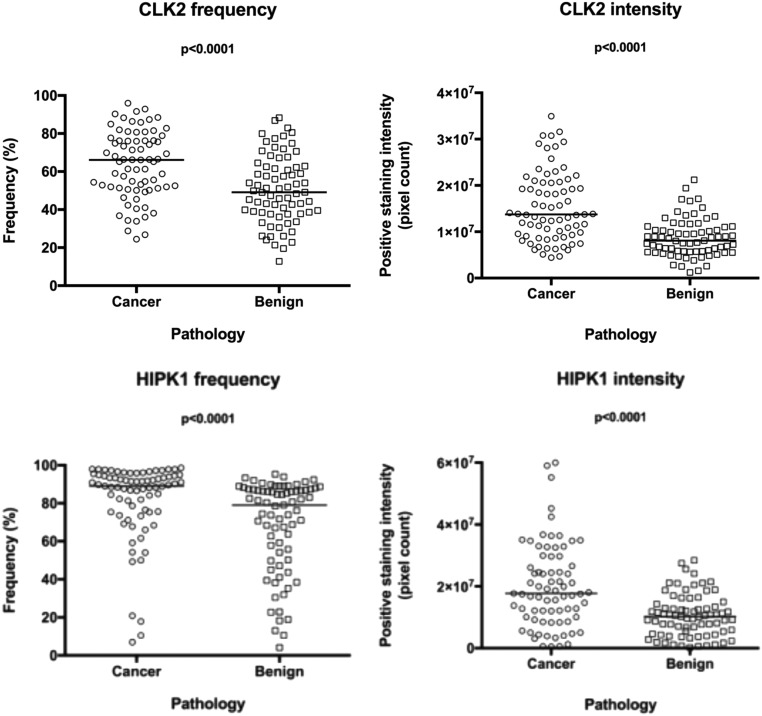
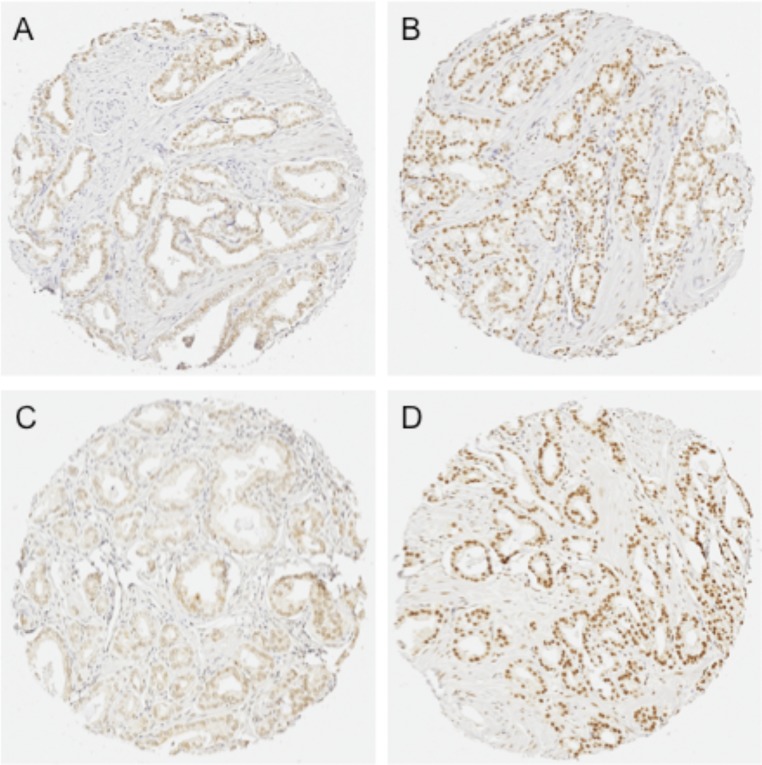
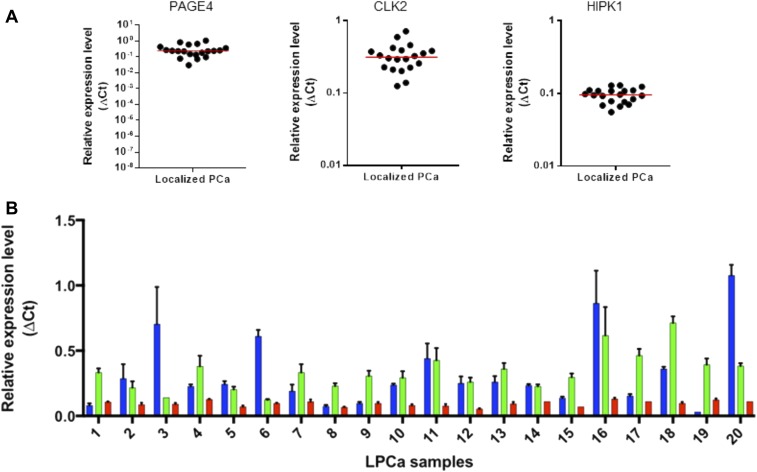
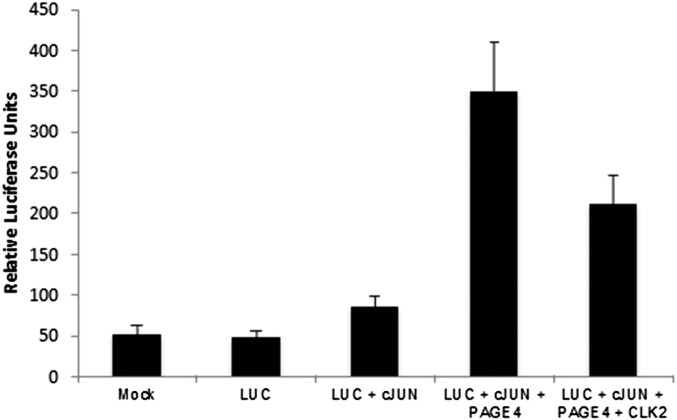
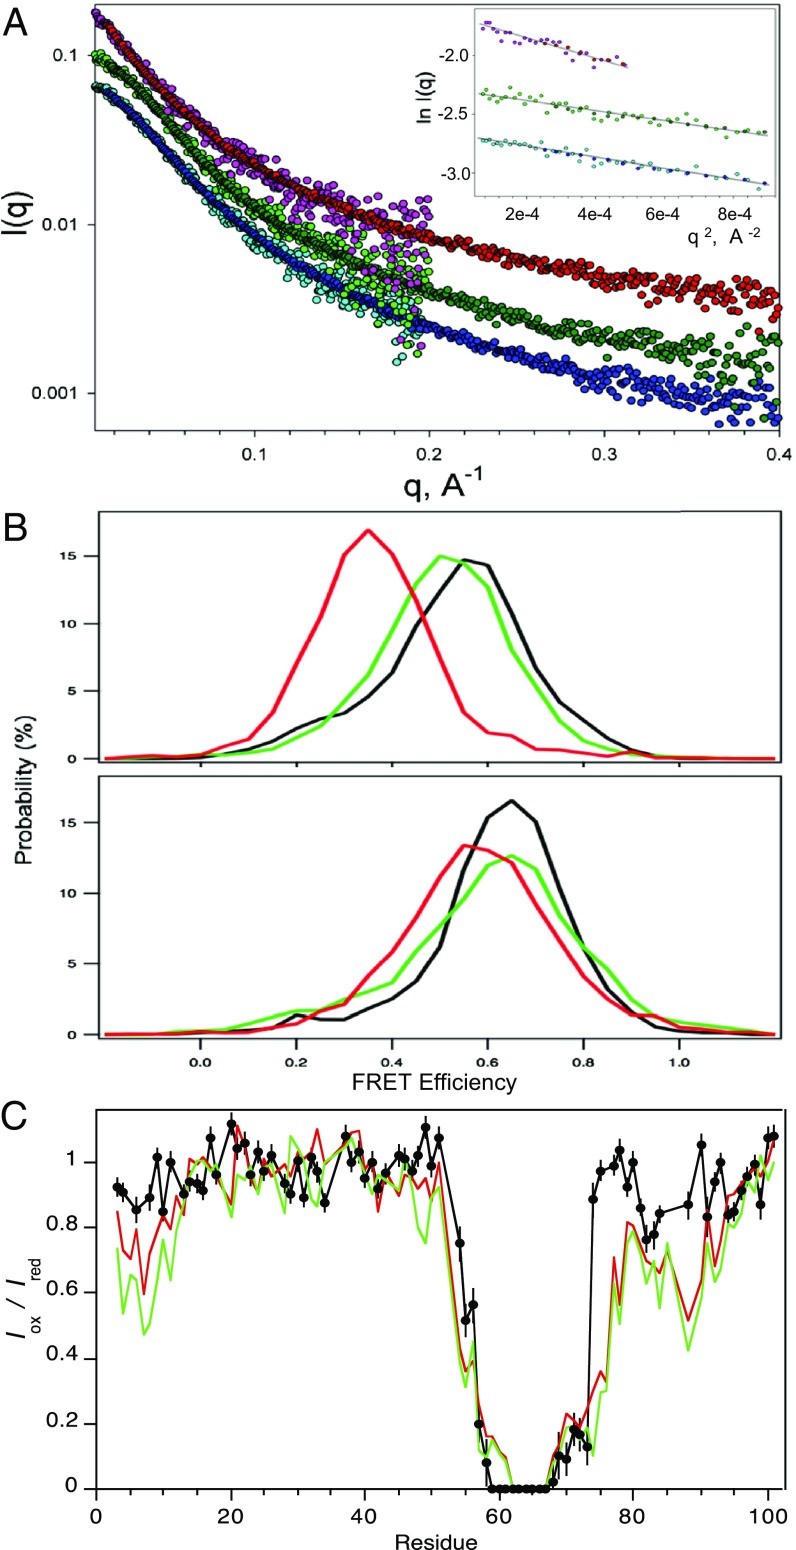
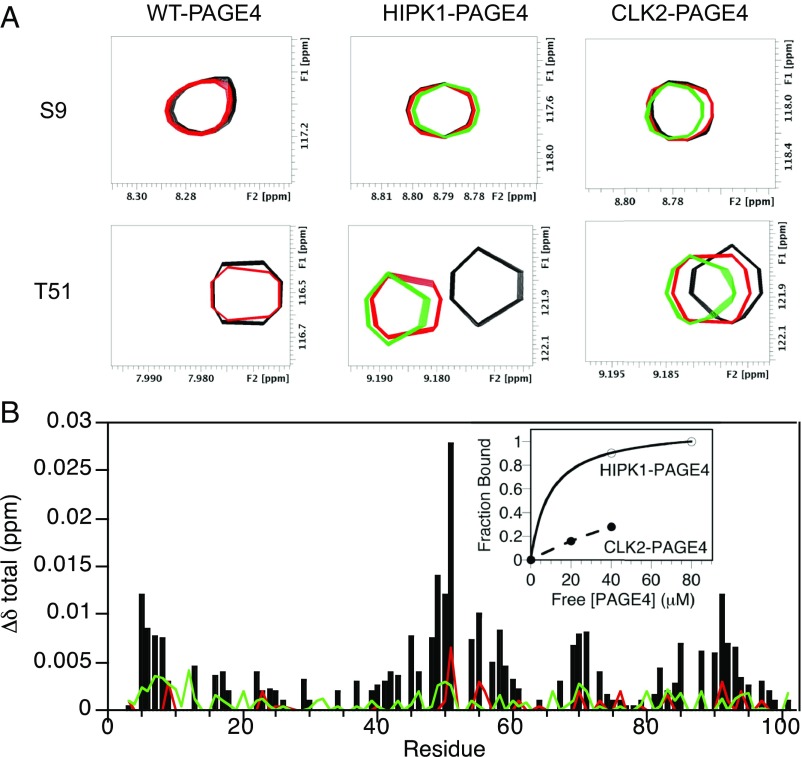
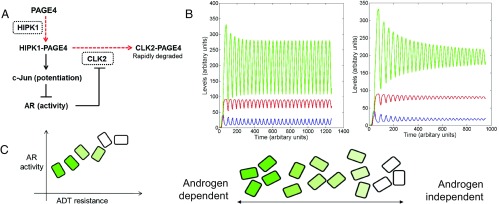
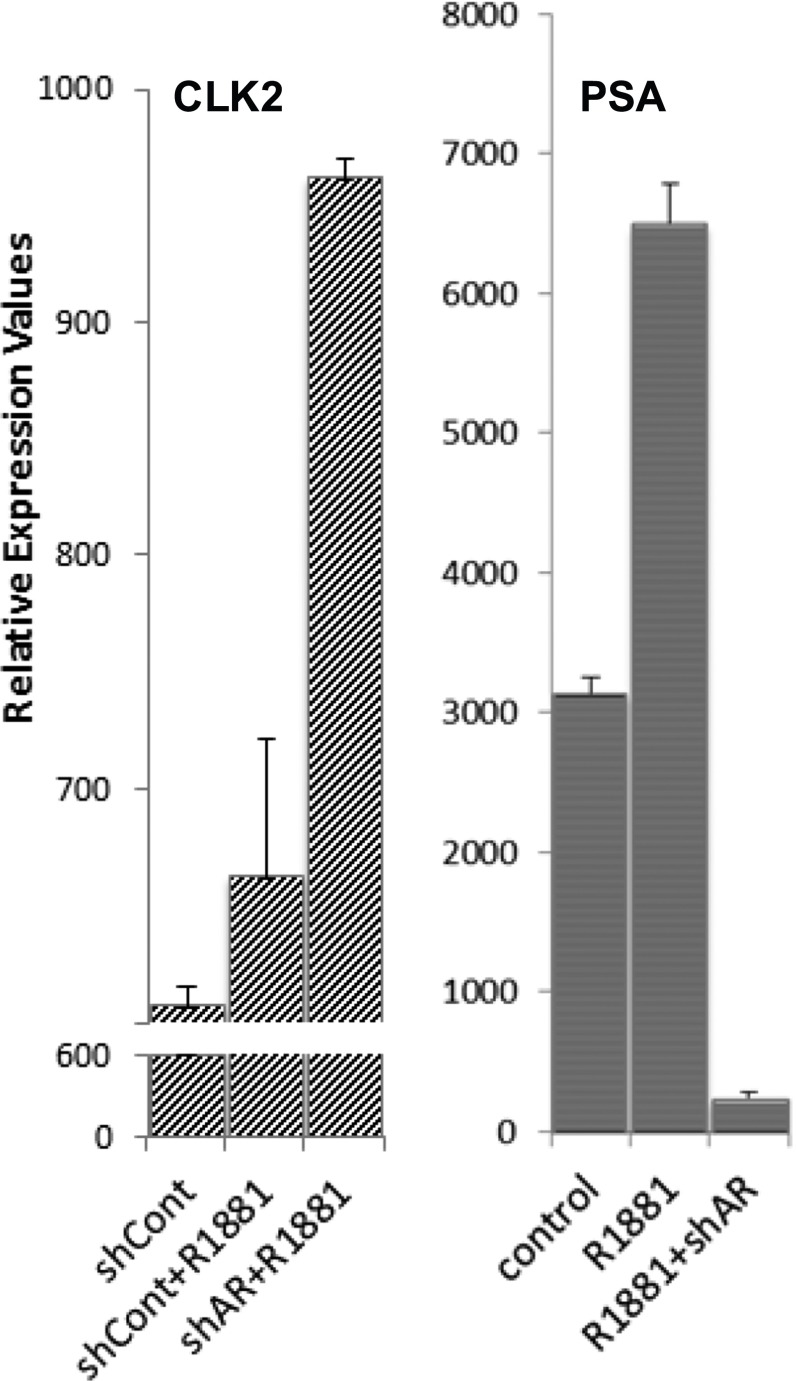
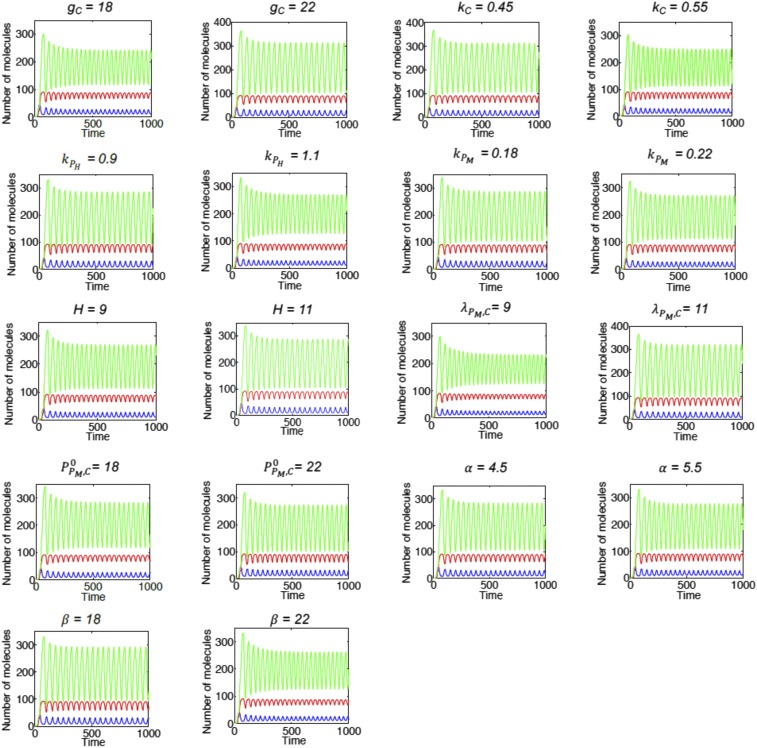
Intrinsically disordered proteins (IDPs) that lack a unique 3D structure and comprise a large fraction of the human proteome play important roles in numerous cellular functions. Prostate-Associated Gene 4 (PAGE4) is an IDP that acts as a potentiator of the Activator Protein-1 (AP-1) transcription factor. Homeodomain-Interacting Protein Kinase 1 (HIPK1) phosphorylates PAGE4 at S9 and T51, but only T51 is critical for its activity. Here, we identify a second kinase, CDC-Like Kinase 2 (CLK2), which acts on PAGE4 and hyperphosphorylates it at multiple S/T residues, including S9 and T51. We demonstrate that HIPK1 is expressed in both androgen-dependent and androgen-independent prostate cancer (PCa) cells, whereas CLK2 and PAGE4 are expressed only in androgen-dependent cells. Cell-based studies indicate that PAGE4 interaction with the two kinases leads to opposing functions. HIPK1-phosphorylated PAGE4 (HIPK1-PAGE4) potentiates c-Jun, whereas CLK2-phosphorylated PAGE4 (CLK2-PAGE4) attenuates c-Jun activity. Consistent with the cellular data, biophysical measurements (small-angle X-ray scattering, single-molecule fluorescence resonance energy transfer, and NMR) indicate that HIPK1-PAGE4 exhibits a relatively compact conformational ensemble that binds AP-1, whereas CLK2-PAGE4 is more expanded and resembles a random coil with diminished affinity for AP-1. Taken together, the results suggest that the phosphorylation-induced conformational dynamics of PAGE4 may play a role in modulating changes between PCa cell phenotypes. A mathematical model based on our experimental data demonstrates how differential phosphorylation of PAGE4 can lead to transitions between androgen-dependent and androgen-independent phenotypes by altering the AP-1/androgen receptor regulatory circuit in PCa cells.

Keywords: PAGE-4; androgen resistance; intrinsic disorder; phenotypic heterogeneity; prostate cancer.


Conflict of interest statement

The authors declare no conflict of interest.

Figures

Fig. 1.
Fig. 1.
PAGE4 conformational dynamics and phenotypic heterogeneity in PCa cells. The stress–response kinase HIPK1 phosphorylates PAGE4 at S9 and T51, resulting in a relatively compact PAGE4 ensemble that can potentiate c-Jun (AP-1) in androgen-dependent PCa cells such as LNCaP. In contrast, the dual-specificity kinase CLK2 hyperphosphorylates PAGE4 at eight different S/T residues, including S9 and S51, leading to a more random-like PAGE4 ensemble that attenuates c-Jun transactivation and is likely to be degraded rapidly (9, 37, 77). Differential phosphorylation of PAGE4 by HIPK1 and CLK2 results in oscillations of the levels of HIPK1-PAGE4, CLK2-PAGE4, and CLK2 that can be modeled mathematically to correlate with the experimentally observed heterogeneity in a population of isogenic PCa cells (details are provided in the main text). Phosphorylated residues are indicated as solid orange circles.
Fig. 2.
Fig. 2.
CLK2 activity and expression profile compared with HIPK1. (A) CLK2 phosphorylates PAGE4 in vitro. No enzyme control (blue) and the presence of enzyme (red) are shown. (B) Immunoblotting using specific antibodies against HIPK1, CLK2, and beta-actin as described in Materials and Methods. (C) Detection of CLK2 and HIPK1 protein expression in prostate tissue by qIHC in 80 paired cases of PCa and benign adjacent tissue obtained from radical prostatectomies. (Magnification: 20×, 0.5 μm/pixel resolution.)
Fig. S1.
Fig. S1.
Serine/threonine kinase screening. The 190 serine/threonine kinases screened are listed in Dataset S1. Enzyme assays using recombinant PAGE4 protein as the substrate and radioactive ATP were performed as described in Materials and Methods. The red asterisks indicate CLK1 and CLK3 in the panel.
Fig. S2.
Fig. S2.
Serine/threonine kinase screening. The 190 serine/threonine kinases screened are listed in Dataset S1. Enzyme assays using recombinant PAGE4 protein as the substrate and radioactive ATP were performed as described in Materials and Methods.
Fig. S3.
Fig. S3.
Serine/threonine kinase screening. The 190 serine/threonine kinases screened are listed in Dataset S1. Enzyme assays using recombinant PAGE4 protein as the substrate and radioactive ATP were performed as described in Materials and Methods. The red asterisk indicates CLK2 in the panel.
Fig. S4.
Fig. S4.
Serine/threonine kinase screening. The 190 serine/threonine kinases screened are listed in Dataset S1. Enzyme assays using recombinant PAGE4 protein as the substrate and radioactive ATP were performed as described in Materials and Methods. The red asterisks indicate HIPK1 and HIPK3 in the panel.
Fig. 3.
Fig. 3.
Characterization of CLK2-phosphorylated PAGE4 by MALDI mass spectrometry. (A) Mass spectrum of CLK2-phosphorylated PAGE4 obtained by coexpression in E. coli BL21DE3 cells. (B) Mass spectrum of Myc-DDK–tagged PAGE4 isolated by immunoprecipitation from LNCaP cells. a.u., arbitrary units.
Fig. 4.
Fig. 4.
PAGE4 phosphorylation sites from NMR. (A) PAGE4 amino acid sequence highlighting the primary HIPK1 phosphorylation site (blue) and CLK2 phosphorylation sites (blue and red). Boxed regions denote key structural features. (B) Two-dimensional 1H-15N HSQC spectrum of HIPK1-PAGE4 with assignments for backbone amides. Assignments in crowded regions are omitted for clarity. (C) Two-dimensional 1H-15N HSQC spectrum of CLK2-PAGE4 with tentative assignments for likely CLK2 phosphorylation sites (red). Circled positions highlight where there is a significant loss of peak intensity relative to HIPK1-PAGE4, indicating CLK2 phosphorylation at that residue.
Fig. S5.
Fig. S5.
Scatter plots representing frequency and intensity of the immunohistochemistry for protein detection. CLK2 and HIPK1 positivity was quantified, and the values are expressed in frequency (%) of positive cells and intensity (pixel count) of the positive signal. CLK2 and HIPK1 are significantly more expressed in the cancer areas than in the benign adjacent prostate tissue. Lines representing the median and P values were obtained by using the Wilcoxon nonparametric test for paired samples.
Fig. S6.
Fig. S6.
CLK2 protein expression in distinct regions from the same PCa sample. The upper (A and B) and lower (C and D) pairs of pictures represent two patients. In some of the cancer samples evaluated, it was possible to observe that different cores (distinct regions of the same tumor) presented differences in CLK2 levels as revealed by the intensity of staining. (Magnification: 20×, 0.5 μm/pixel resolution.)
Fig. S7.
Fig. S7.
Relative expression of PAGE4, CLK2, and HIPK1 mRNA in organ-confined PCa determined by qRT-PCR. (A) Scatter plots represent relative gene expression in samples from men with organ-confined (localized) prostate cancer (LPCa). (B) Histogram represents PAGE4 (blue), CLK2 (green), and HIPK1 (red) expression. Error bars represent SD, and qRT-PCR assays were performed in triplicate. ΔCt is the target gene expression (CLK2, HIPK1, and PAGE4) relative to GAPDH expression, where ΔCt = (Ct target gene – Ct GAPDH). Ct is the PCR cycle at which the amplification reaches the established threshold.
Fig. 5.
Fig. 5.
CLK2-PAGE4 attenuates c-Jun transactivation. GAL4-cJun (aa 1–223) was cotransfected with either PAGE4 cDNA alone or with PAGE4- and CLK2-expressing cDNAs into PC3 (human prostate cancer cell line 3) cells. Luciferase (LUC) activity from a GAL4-binding site driving reporter construct was measured as described in the main text. Mock control (lane 1) represents background luminescence, and Luc (lane 2) represents background due to luciferase reporter. Potentiation of c-Jun transactivation in the absence of PAGE4 (lane 3) is compared with potentiation in the presence (lane 4) of PAGE4, and the effect of PAGE4 hyperphosphorylation by CLK2 (CLK2-PAGE4) on c-Jun potentiation is shown in lane 5.
Fig. 6.
Fig. 6.
Conformational expansion of PAGE4 upon hyperphosphorylation by CLK2. (A) Experimental X-ray scattering data for the WT-PAGE4 (bottom curve, cyan/blue), HIPK1-PAGE4 (middle curve, light green/dark green), and CLK2-PAGE4 (top curve, pink/red). For each of the variants, the two colors denote independent data collections probing lower-q and medium-q ranges of the scattering data. The curves are offset for clarity. (Inset) Guinier fits of the lowest q data that yield model-free estimates of the ensemble-averaged radii of gyration for the three variants. (B) smFRET measurements. (Upper) Distributions of smFRET efficiency measurements for PAGE4 with donor and acceptor sites at positions 18 and 63 WT-PAGE4 (black), HIPK1-PAGE4 (green), and CLK2-PAGE4 (red). (Lower) Donor and acceptor sites are at positions 63 and 102 for WT-PAGE4 (black), HIPK1-PAGE4 (green), and CLK2-PAGE4 (red). (C) PRE data for CLK2-PAGE4 (black) with an MTSL spin label at C63. Results are compared with earlier observations (28) for WT-PAGE4 (red) and HIPK1-PAGE4 (green).
Fig. 7.
Fig. 7.
PAGE4 binding to c-Jun/c-Fos monitored by NMR spectroscopy. (A) Regions from 2D 1H-15N HSQC spectra for 15N-labeled WT-PAGE4, HIPK1-PAGE4, and CLK2-PAGE4 as a function of unlabeled Jun/Fos concentration. Ratios of WT-PAGE4 to c-Jun/c-Fos are 1:0 (black) and 1:12.4 (red). Ratios of HIPK1-PAGE4 or CLK2-PAGE4 to c-Jun/c-Fos are 1:0 (black), 1:4 (red), and 1:8 (green). (B) Plot of CSP, Δδtotal, versus residue for c-Jun/c-Fos titrations with HIPK1-PAGE4 (black), CLK2-PAGE4 (red), and WT-PAGE4 (green). (Inset) Binding curves for HIPK1-PAGE4 (○) and CLK2-PAGE4 (●).
Fig. 8.
Fig. 8.
Modeling the PAGE4/AP-1/AR/CLK2 regulatory circuit. (A) Regulatory circuit for PAGE4/AP-1/AR/CLK2 interactions. Dashed red lines denote enzymatic reactions, and solid black lines denote nonenzymatic reactions. CLK2 and HIPK1, the two enzymes involved, are shown in dotted rectangles. (B) Dynamics of the circuit showing sustained and damped oscillations for HIPK1-PAGE4 (PAGE4M, shown in blue), CLK2-PAGE4 (PAGE4H, shown in red), and CLK2 (shown in green). Parameters are given in Fig. S9. (C) Distribution of androgen dependence for an isogenic population over a spectrum, as indicated by the shade of green. Dark green boxes denote highly androgen-dependent (i.e., ADT-sensitive) cells, and white boxes denote androgen-independent cells.
Fig. S8.
Fig. S8.
AR negatively regulates CLK2 expression in androgen-dependent LNCaP PCa cells. Gene expression microarray data were extracted from the National Center for Biotechnology Information Gene Expression Omnibus (https://www.ncbi.nlm.nih.gov/geoprofiles; GDS4113/203229_s_at) and analyzed. AR expression was knocked down using a specific shRNA, and changes in gene expression were interrogated using Affymetrix protocols and hybridized to the HG U133 Plus 2.0 array set. As can be seen, although AR-specific shRNA derepressed CLK2 mRNA, the control shRNA (shCont) did not. In contrast, knocking down the AR with the specific shRNA repressed prostate-specific antigen (PSA) expression, a direct target of the AR in LNCaP cells. However, the control shRNA did not repress PSA expression. R1881, synthetic androgen used to stimulate AR.
Fig. S9.
Fig. S9.
Sensitivity analysis. Dynamics of the circuit when the parameters of the model are varied by ±10% individually.

Comment in

References

    1. Anfinsen CB. Principles that govern the folding of protein chains. Science. 1973;181(4096):223–230. - PubMed
    1. Dyson HJ, Wright PE. Intrinsically unstructured proteins and their functions. Nat Rev Mol Cell Biol. 2005;6(3):197–208. - PubMed
    1. Oldfield CJ, Dunker AK. Intrinsically disordered proteins and intrinsically disordered protein regions. Annu Rev Biochem. 2014;83:553–584. - PubMed
    1. Peng Z, et al. Exceptionally abundant exceptions: Comprehensive characterization of intrinsic disorder in all domains of life. Cell Mol Life Sci. 2015;72(1):137–151. - PMC - PubMed
    1. Barabasi A-L. Scale-free networks: A decade and beyond. Science. 2009;325(5939):412–413. - PubMed

Publication types

MeSH terms