. 2017 Apr 4;114(14):3672-3677.
doi: 10.1073/pnas.1701053114. Epub 2017 Mar 13.

Naturally occurring fluorescence in frogs

Affiliations

Naturally occurring fluorescence in frogs

Carlos Taboada et al. Proc Natl Acad Sci U S A. .

Abstract

Fluorescence, the absorption of short-wavelength electromagnetic radiation reemitted at longer wavelengths, has been suggested to play several biological roles in metazoans. This phenomenon is uncommon in tetrapods, being restricted mostly to parrots and marine turtles. We report fluorescence in amphibians, in the tree frog Hypsiboas punctatus, showing that fluorescence in living frogs is produced by a combination of lymph and glandular emission, with pigmentary cell filtering in the skin. The chemical origin of fluorescence was traced to a class of fluorescent compounds derived from dihydroisoquinolinone, here named hyloins. We show that fluorescence contributes 18-29% of the total emerging light under twilight and nocturnal scenarios, largely enhancing brightness of the individuals and matching the sensitivity of night vision in amphibians. These results introduce an unprecedented source of pigmentation in amphibians and highlight the potential relevance of fluorescence in visual perception in terrestrial environments.

Keywords: Amphibia; Anura; Hylidae; fluorophore; visual ecology.


Conflict of interest statement

The authors declare no conflict of interest.

Figures

Fig. 1.
Fig. 1.
Fluorescence in the tree frog H. punctatus. (A) Adult male under UV-blue light (400 nm; Upper) and white light (Lower). (B) Fluorescence of dorsum (Left) and venter (Right) of a male. (C) Female under UV blue light excitation (400 nm) and long-pass emission filters (Left: 435 nm; Middle: 516 nm), or under white light and no emission filter (Right). (D) Normalized representative excitation-emission matrices of the dorsal surfaces of female (Left) and male (Right) specimens. Maximum emission signal was detected at 460−470 nm with a shoulder at 510 nm and corresponded to an excitation maximum of 390−430 nm. Photos in B were taken with a band-pass excitation filter attached to the flash and a long-pass emission filter (516 nm) attached to the lens.
Fig. 2.
Fig. 2.
Anatomy of fluorescence in H. punctatus. (A) Fluorescence is observed in the skin and isolated subcutaneous structures. Incident excitation light and fluorescence emission from each tissue layer are attenuated by the structures above and depend on the transmittance of each layer (Lower Left). Fluorescence from subcutaneous structures is almost completely filtered by skin with lymph (Lower Right). (B) Transverse sections of dorsal skin of H. punctatus and Scinax nasicus. (Left) Confocal images of fresh samples using a 405-nm laser line. (Right) Stained histological section of H. punctatus and unstained sections of S. nasicus superimposed to confocal image. Fluorescence emission in H. punctatus is observed from epidermis (e), dermis (d), and glands (gl), whereas in S. nasicus, it is restricted to the pteridine layer (pl) of the dermis. No fluorescence is detected from chromatophores (ch). (Scale bar, 50 µm.) (C) Chromatophores lie immediately beneath epidermis, as seen in the semithin skin section (Lower). (Scale bar, 20 µm.) They impart coloration to skin (Upper, stereomicroscope image of living specimen) (Scale bar, 150 µm.) Fluorescence emission from glands and dermis is filtered by the chromatophores, and hence fluorescence intensity is attenuated mainly in the blue region. A green shoulder is observed in the filtered emission, as in living frogs. Chromatophore attenuation is evident, as unattenuated glandular ducts (gl d) fluoresce more brightly than the rest of the gland (gl; Middle) (Scale bar, 150 µm.)
Fig. 3.
Fig. 3.
Novel natural fluorophores present in H. punctatus. (A) HPLC profile of partially purified subcutaneous lymph showing peaks corresponding to Hyloin-L1 (H-L1) and Hyloin-L2 (H-L2). Monitoring was performed by UV detection in the range 320−400 nm and by total ion current (TIC). (B) Purified Hyloin-L1 at neutral pH under white (Upper Left) and UV (Upper Right) light, showing characteristic fluorescence. The compound is highly solvatochromic (Lower) and matches the living animals’ fluorescence emission spectra at neutral pH. (C) Structures of two hyloins identified from lymph by combination of NMR and MS/MS data. Hyloin-G1 (H-G1; G stands for glandular), found in glandular secretions is an amide derivative of Hyloin-L1. (D) Molecular network of hyloin clusters based on LC-MS/MS (ESI+) spectral similarities. Many hyloin variants are detected either in its acidic (Upper) or in its amide derivative form (Lower). (E) HPLC profile of glandular secretions from H. punctatus and another hylid, H. prasinus, monitored as in A. No compounds with detectable absorbance in this region could be traced in the other hylid species studied.
Fig. 4.
Fig. 4.
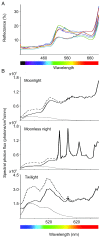
Contribution of fluoresced photons to total emerging light in H. punctatus. (A) Reflectance spectra of the dorsal surface of six specimens. (B) Spectral photon flux (photons/cm2/s/nm) emerging from the dorsal surfaces of one of the specimens under three different natural illuminants. Reflected light (solid line; reflectance × irradiance for every λ), fluoresced light (dotted line; calculated with the empirical quantum yield and the methodology described in SI Appendix), and the sum of both components (dashed line) show a large contribution of fluorescence to the total amount of photons for all the analyzed scenarios. Maximum contribution corresponds to the blue/green range (420−550 nm).

References

    1. Lagorio MG, Cordon GB, Iriel A. Reviewing the relevance of fluorescence in biological systems. Photochem Photobiol Sci. 2015;14(9):1538–1559. - PubMed
    1. Sparks JS, et al. The covert world of fish biofluorescence: A phylogenetically widespread and phenotypically variable phenomenon. PLoS One. 2014;9(1):e83259. - PMC - PubMed
    1. Gruber DF, Sparks JS. First observation of fluorescence in marine turtles. Am Mus Novit. 2015;3845:1–8.
    1. Hausmann F, Arnold KE, Marshall NJ, Owens IPF. Ultraviolet signals in birds are special. Proc R Soc Lond B Biol Sci. 2003;270(1510):61–67. - PMC - PubMed
    1. Stradi R, Pini E, Celentano G. The chemical structure of the pigments in Ara macao plumage. Comp Biochem Physiol B Biochem Mol Biol. 2001;130(1):57–63. - PubMed

Publication types