. 2017 Mar 28;114(13):3473-3478.
doi: 10.1073/pnas.1617636114. Epub 2017 Mar 13.

Transcriptional landscape of the human cell cycle

Affiliations

Transcriptional landscape of the human cell cycle

Yin Liu et al. Proc Natl Acad Sci U S A. .

Abstract

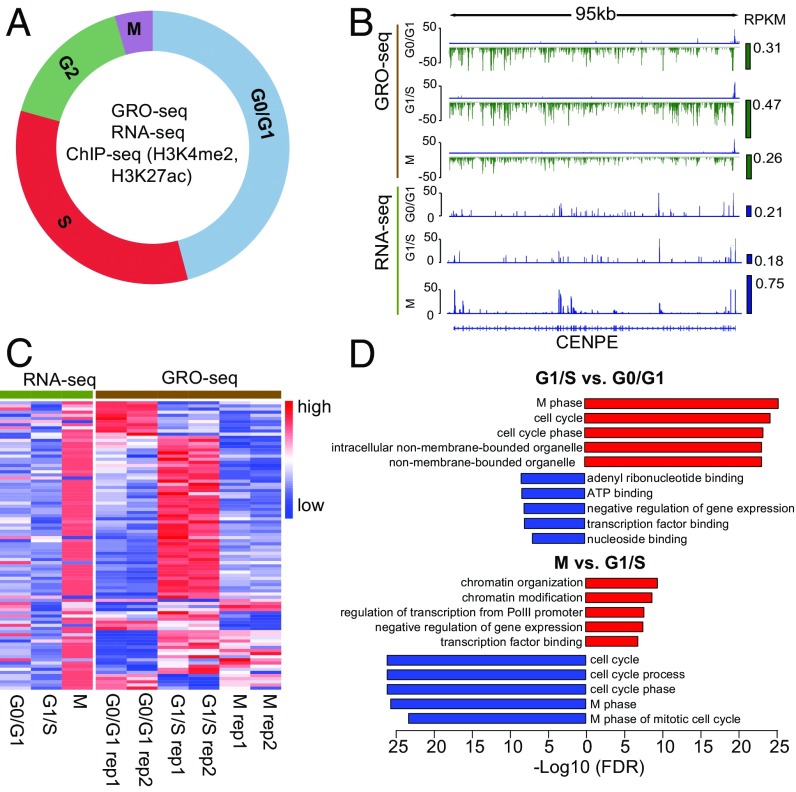
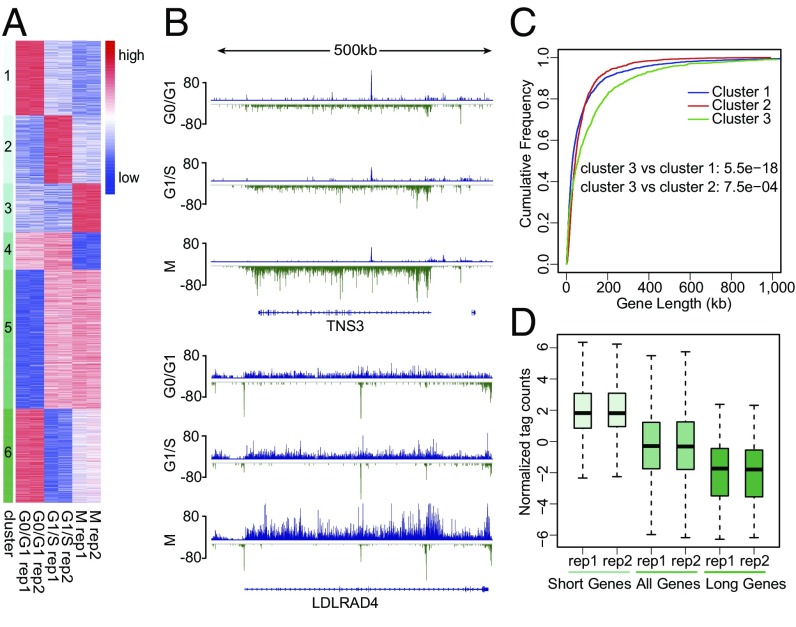
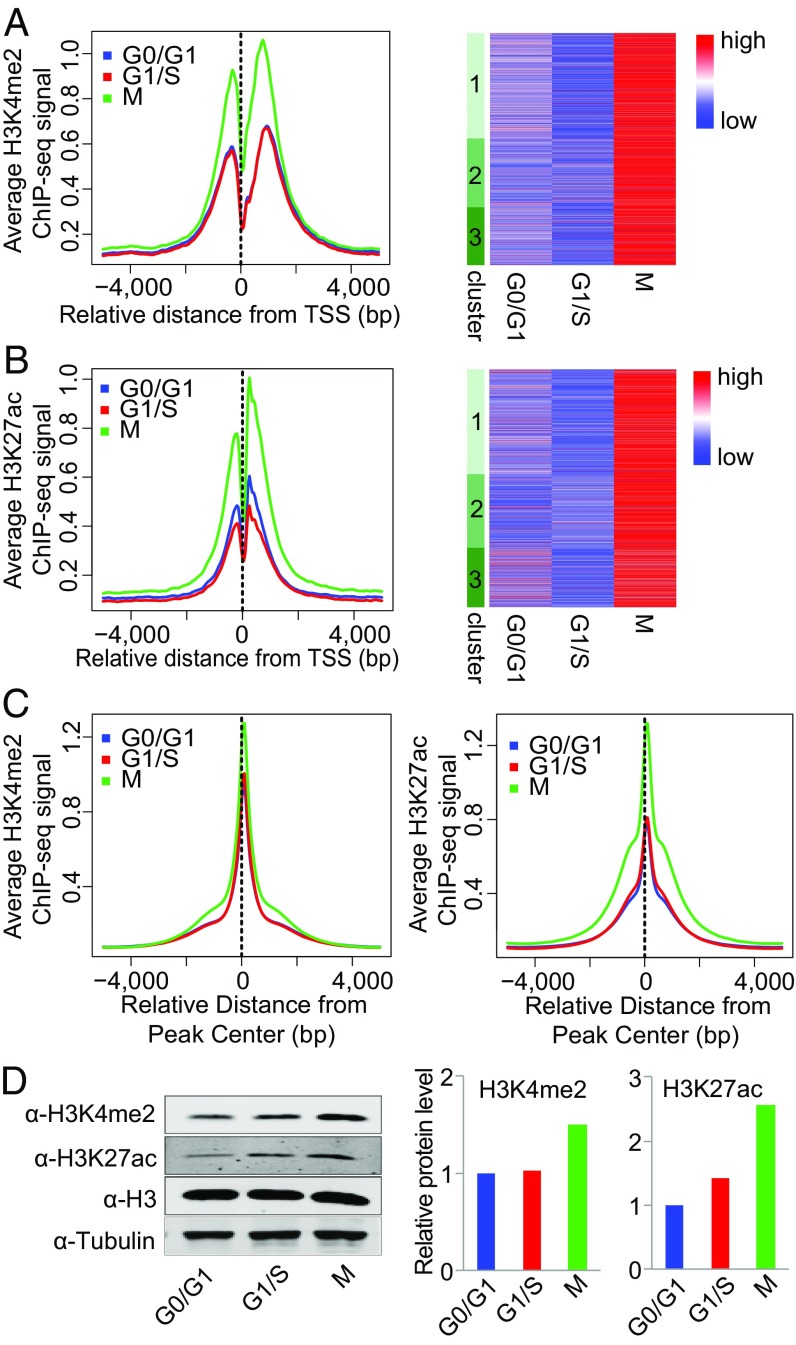
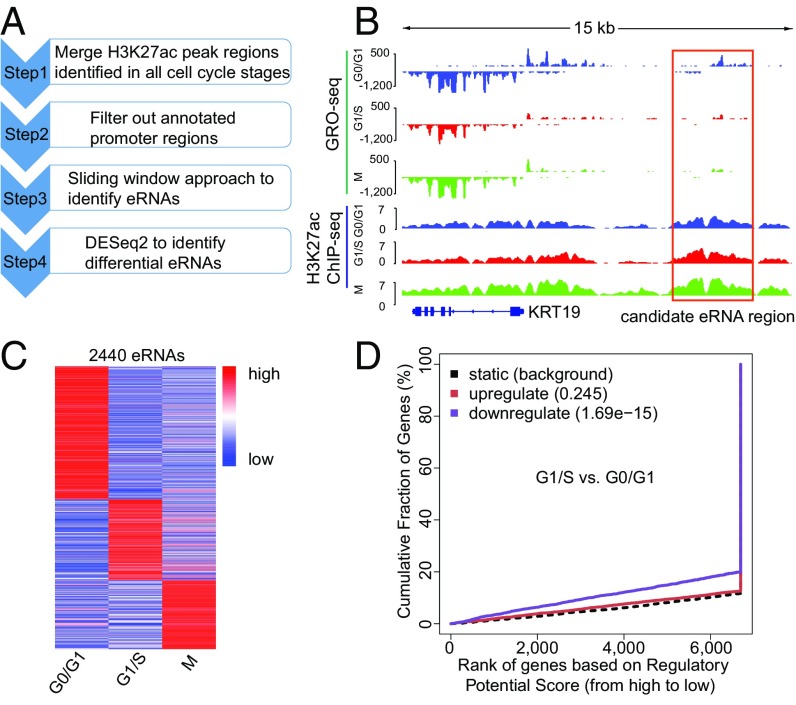
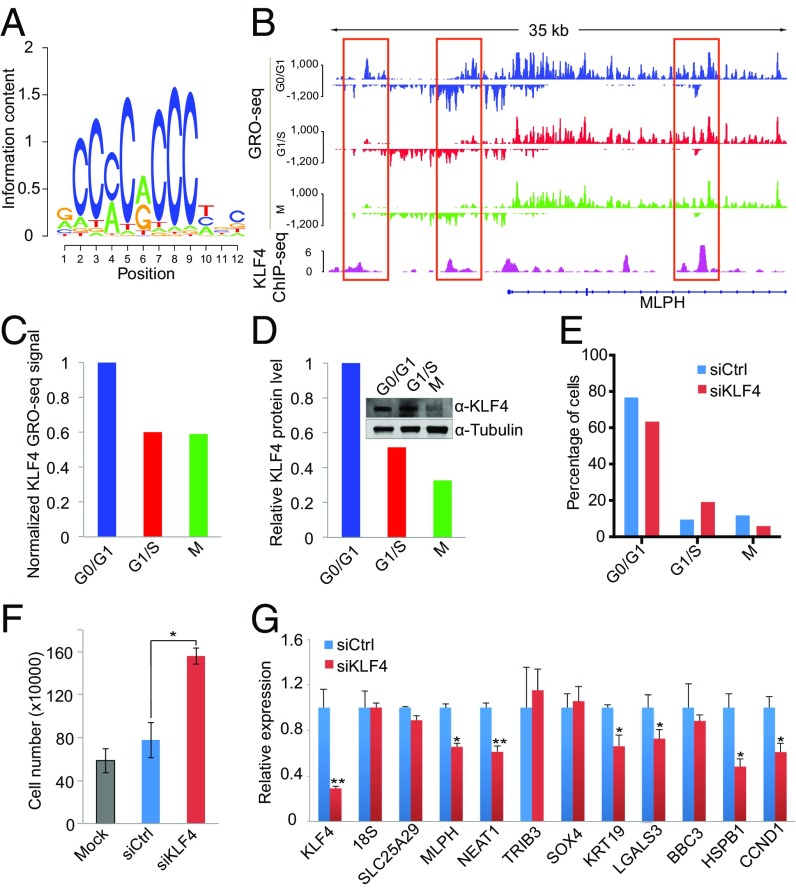
Steady-state gene expression across the cell cycle has been studied extensively. However, transcriptional gene regulation and the dynamics of histone modification at different cell-cycle stages are largely unknown. By applying a combination of global nuclear run-on sequencing (GRO-seq), RNA sequencing (RNA-seq), and histone-modification Chip sequencing (ChIP-seq), we depicted a comprehensive transcriptional landscape at the G0/G1, G1/S, and M phases of breast cancer MCF-7 cells. Importantly, GRO-seq and RNA-seq analysis identified different cell-cycle-regulated genes, suggesting a lag between transcription and steady-state expression during the cell cycle. Interestingly, we identified genes actively transcribed at early M phase that are longer in length and have low expression and are accompanied by a global increase in active histone 3 lysine 4 methylation (H3K4me2) and histone 3 lysine 27 acetylation (H3K27ac) modifications. In addition, we identified 2,440 cell-cycle-regulated enhancer RNAs (eRNAs) that are strongly associated with differential active transcription but not with stable expression levels across the cell cycle. Motif analysis of dynamic eRNAs predicted Kruppel-like factor 4 (KLF4) as a key regulator of G1/S transition, and this identification was validated experimentally. Taken together, our combined analysis characterized the transcriptional and histone-modification profile of the human cell cycle and identified dynamic transcriptional signatures across the cell cycle.

Keywords: GRO-seq; cell cycle; epigenetics; nascent RNA; transcriptional regulation.


Conflict of interest statement

The authors declare no conflict of interest.

Figures

Fig. 1.
Fig. 1.
GRO-seq and RNA-seq identify different cell-cycle–regulated genes. (A) Illustration of transcriptional dynamics analysis across the cell-cycle stages in MCF-7 cells. GRO-seq and ChIP-seq experiments were performed in two biological replicates, and RNA-seq was performed without replicates. (B) Transcription and expression of CENPE as measured by GRO-seq and RNA-seq at different cell-cycle stages. Green and blue bars on the right side of the signal tracks represent the CENPE transcription and expression levels as measured by reads per kilobase per million mapped reads (RPKM). (C) Transcription (GRO-seq) and expression (RNA-seq) of curated mitotic genes. The genes specifically up-regulated at G2/M were curated from published datasets (Materials and Methods). Read counts of each gene were normalized among the three cell-cycle stages so that their mean equals 0 and the SD equals 1, with red representing higher signal and blue representing lower signal. (D) GO analysis of cell-cycle-stage–specific genes identified by GRO-seq analysis. Bar length represents the −log10 FDR. Red bars indicate terms enriched for up-regulated genes; blue bars indicate terms enriched for down-regulated genes. The top five enriched terms are shown for each comparison.
Fig. 2.
Fig. 2.
Active transcription at early M phase. (A) Clustering of differentially transcribed genes at different cell-cycle stages identified by GRO-seq analysis. Genes are classified into six clusters using unsupervised k-means clustering. (B) Representative long genes up-regulated at M phase. Blue and green bars represent the GRO-seq signal from the plus and minus strands, respectively. Signals were normalized to a total of 10 million reads, and replicates were combined. (C) Empirical cumulative distribution of gene length. Blue, red, and green traces represent the groups of genes with higher GRO-seq signal at G0/G1, G1/S, and M phases, respectively. (D) GRO-seq signal of short (top 25% shortest, two far-left boxes), all (middle two boxes), and long (top 25% longest, two far-right boxes) genes that are highly expressed at M phase (red trace in C).
Fig. 3.
Fig. 3.
Global increase in H3K4me2 and H3K27ac signals at early M phase. (A and B) H3K4me2 (A) and H3K27ac (B) ChIP-seq signal at promoter regions across different cell-cycle stages. (Left) Average H3K4me2 (A) and H3K27ac (B) signal (RPKM) of genes in clusters 1, 2, and 3. (Right) Heatmap of H3K4me2 (A) and H3K27ac (B) signals of genes in clusters 1, 2, and 3. (C, Left) Average H3K4me2 ChIP-seq signal at all H3K4me2 peak regions. (Right) Average H3K27ac ChIP-seq signal at all H3K27ac peak regions. (D, Left) Western blot of H3K4me2 and H3K27ac at different cell-cycle stages. H3 and tubulin were used as loading controls. (Right) Bar plots represent the quantitative value (normalized to H3) of H3K4me2 and H3K27ac protein levels from the Western blot.
Fig. 4.
Fig. 4.
Identification of cell-cycle–regulated eRNAs. (A) Workflow for identification of cell-cycle-stage–specific eRNAs. (B) Example of a candidate eRNA near gene KRT19. (C) Heatmap of 2,440 differential eRNAs. Color shows the relative GRO-seq signal at each eRNA region at three different stages. (D) Correlation between cell-cycle–regulated eRNAs and differentially transcribed genes.
Fig. 5.
Fig. 5.
KLF4 regulates eRNAs and target genes to control G1/S transition. (A) The KLF4 motif was identified as the most significant one enriched in G0/G1-specific eRNA regions. (B) Example of KLF4 eRNAs (marked with red boxes) near the target gene MLPH. (C and D) KLF4 RNA (C) and protein levels (D) across different cell-cycle stages. Tubulin was used as the loading control for Western blot analysis. (E) Flow cytometry cell-cycle analysis of MCF-7 cells in which KLF4 was silenced with siRNAs. (F) Cell growth analysis of MCF-7 cells upon silencing of KLF4. Mock, without transfection. (G) Validation of candidate KLF4 target genes identified through eRNA analysis. RT-PCR was performed for candidate KLF4 target genes upon silencing of KLF4. Error bars indicate the SEM; *P < 0.05; ** P < 0.01 (t test).

References

    1. Okayama H, et al. Cell cycle control in fission yeast and mammals: Identification of new regulatory mechanisms. Adv Cancer Res. 1996;69:17–62. - PubMed
    1. McGill CJ, Brooks G. Cell cycle control mechanisms and their role in cardiac growth. Cardiovasc Res. 1995;30(4):557–569. - PubMed
    1. Piatelli M, Tanguay D, Rothstein T, Chiles T. Cell cycle control mechanisms in B-1 and B-2 lymphoid subsets. Immunol Res. 2003;27(1):31–52. - PubMed
    1. Fraser HB. Cell-cycle regulated transcription associates with DNA replication timing in yeast and human. Genome Biol. 2013;14(10):R111. - PMC - PubMed
    1. Schafer KA. The cell cycle: A review. Vet Pathol. 1998;35(6):461–478. - PubMed

Publication types