. 2017 May 5;372(1719):20160095.
doi: 10.1098/rstb.2016.0095.

Uncertain links in host-parasite networks: lessons for parasite transmission in a multi-host system

Affiliations

Uncertain links in host-parasite networks: lessons for parasite transmission in a multi-host system

Josephine G Walker et al. Philos Trans R Soc Lond B Biol Sci. .

Abstract

For many parasites, the full set of hosts that are susceptible to infection is not known, and this could lead to a bias in estimates of transmission. We used counts of individual adult parasites from historical parasitology studies in southern Africa to map a bipartite network of the nematode parasites of herbivore hosts that occur in Botswana. Bipartite networks are used in community ecology to represent interactions across trophic levels. We used a Bayesian hierarchical model to predict the full set of host-parasite interactions from existing data on parasitic gastrointestinal nematodes of wild and domestic ungulates given assumptions about the distribution of parasite counts within hosts, while accounting for the relative uncertainty of less sampled species. We used network metrics to assess the difference between the observed and predicted networks, and to explore the connections between hosts via their shared parasites using a host-host unipartite network projected from the bipartite network. The model predicts a large number of missing links and identifies red hartebeest, giraffe and steenbok as the hosts that have the most uncertainty in parasite diversity. Further, the unipartite network reveals clusters of herbivores that have a high degree of parasite sharing, and these clusters correspond closely with phylogenetic distance rather than with the wild/domestic boundary. These results provide a basis for predicting the risk of cross-species transmission of nematode parasites in areas where livestock and wildlife share grazing land.This article is part of the themed issue 'Opening the black box: re-examining the ecology and evolution of parasite transmission'.

Keywords: Bayesian hierarchical model; Botswana; bipartite; negative binomial; nematodes; ungulates.


Figures

Figure 1.
Figure 1.
Map of data source locations. Dots represent locations of data sources; black polygon shows the location of MPNP.
Figure 2.
Figure 2.
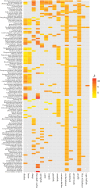
Heat map of the log predicted abundance parameter (βij) for each host–parasite combination, from yellow (low abundance) to red (high abundance). Abundance is estimated using random effects, so host–parasite combinations for which there is little information tend to have intermediate abundance estimates. Predicted abundance is not shown for host–parasite combinations where mean θij < 0.05; species are ordered by summed occurrence (figure 3).
Figure 3.
Figure 3.
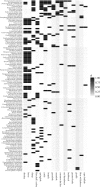
Heat map of the mean predicted occurrence (θij) for each host–parasite combination, ranging from 0 shown in white to 1 shown in black. Intermediate values (pale shading) indicate host–parasite combinations for which there is uncertainty in the model regarding whether the parasite occurs in that host. Species are ordered by summed occurrence. Predicted occurrence equals 1 for all observed interactions (see electronic supplementary material, figure S3).
Figure 4.
Figure 4.
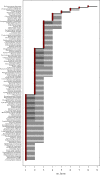
Host breadth of each parasite species predicted by the model. Circle (median), thick line (quartile range), thin line (95% credible interval). X shows observed host breadth. (Online version in colour.)
Figure 5.
Figure 5.
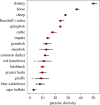
Parasite diversity of each host species predicted by the model. Circle (median), thick line (quartile range), thin line (95% credible interval). X shows observed parasite diversity. (Online version in colour.)
Figure 6.
Figure 6.
Networks weighted by the number of shared parasites for observed network, and predicted lower bound, median and upper bound networks. Nodes are coloured by edge betweenness community; edge width represents the weight of connection.

References

    1. Morgan ER, Milner-Gulland EJ, Torgerson PR, Medley GF. 2004. Ruminating on complexity: macroparasites of wildlife and livestock. Trends Ecol. Evol. 19, 181–188. (10.1016/j.tree.2004.01.011) - DOI - PubMed
    1. Cleaveland S, Laurenson MK, Taylor LH. 2001. Diseases of humans and their domestic mammals: pathogen characteristics, host range and the risk of emergence. Phil. Trans. R. Soc. B 356, 991–999. (10.1098/rstb.2001.0889) - DOI - PMC - PubMed
    1. Woolhouse MEJ, Taylor LH, Haydon DT. 2001. Population biology of multihost pathogens. Science 292, 1109–1112. (10.1126/science.1059026) - DOI - PubMed
    1. Lloyd-Smith JO, George D, Pepin KM, Pitzer VE, Pulliam JRC, Dobson AAP, Hudson PJ, Grenfell BT. 2009. Epidemic dynamics at the human–animal interface. Science 326, 1362–1367. (10.1126/science.1177345) - DOI - PMC - PubMed
    1. Viana M, Mancy R, Biek R, Cleaveland S, Cross PC, Lloyd-Smith JO, Haydon DT. 2014. Assembling evidence for identifying reservoirs of infection. Trends Ecol. Evol. 29, 270–279. (10.1016/j.tree.2014.03.002) - DOI - PMC - PubMed

LinkOut - more resources