

Nonlinear ultrasound imaging of nanoscale acoustic biomolecules
- PMID: 28289314
- PMCID: PMC5315666
- DOI: 10.1063/1.4976105
Nonlinear ultrasound imaging of nanoscale acoustic biomolecules
Abstract
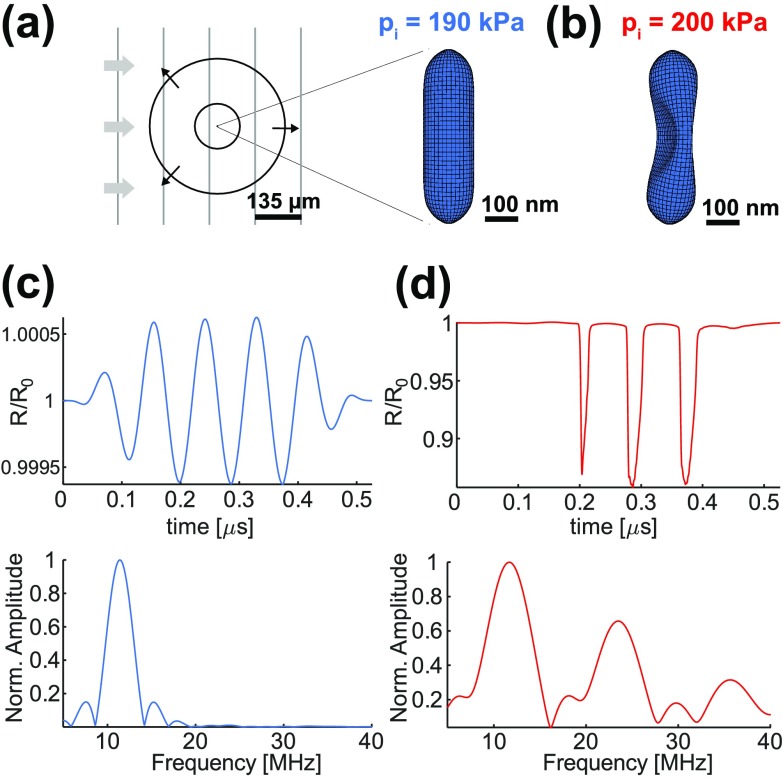
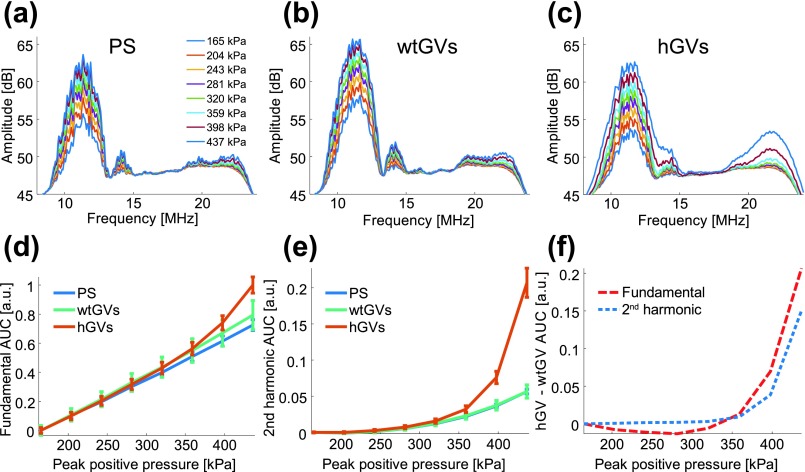
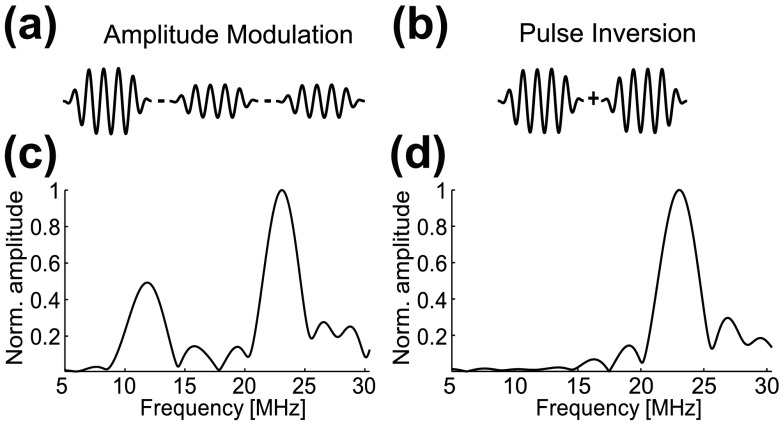
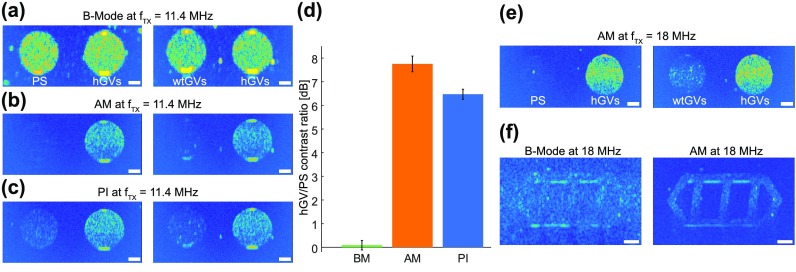
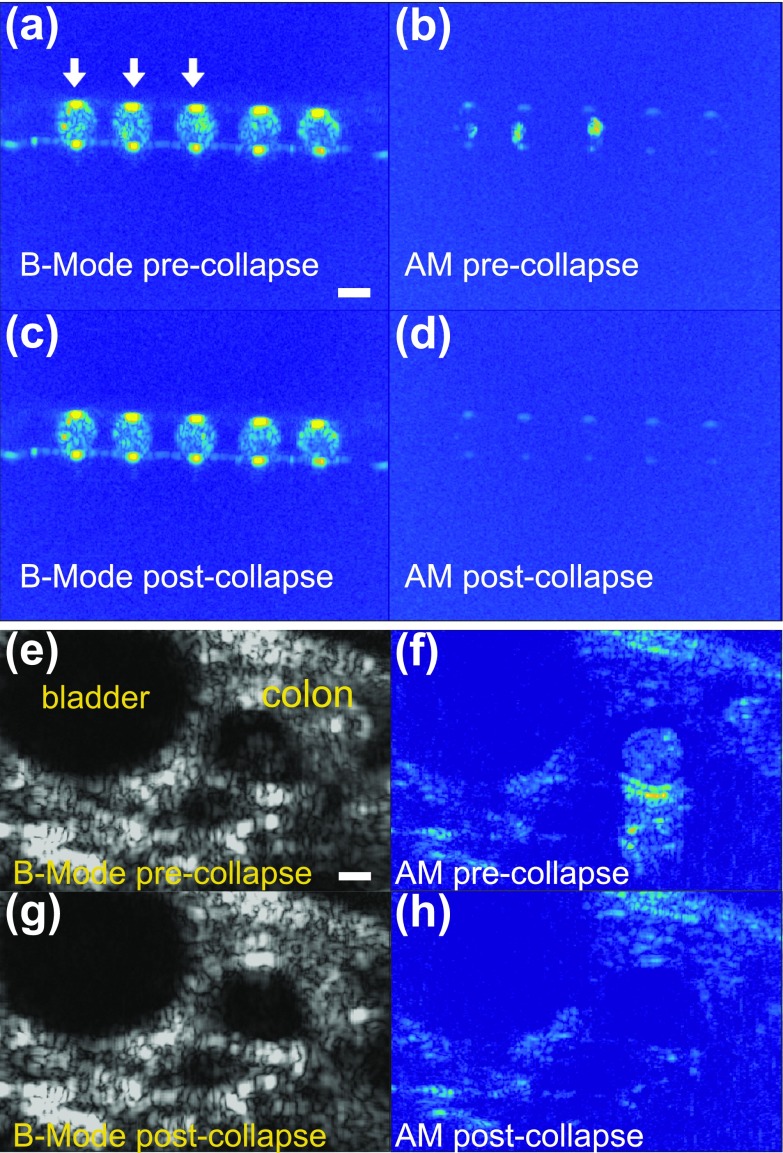
Ultrasound imaging is widely used to probe the mechanical structure of tissues and visualize blood flow. However, the ability of ultrasound to observe specific molecular and cellular signals is limited. Recently, a unique class of gas-filled protein nanostructures called gas vesicles (GVs) was introduced as nanoscale (∼250 nm) contrast agents for ultrasound, accompanied by the possibilities of genetic engineering, imaging of targets outside the vasculature and monitoring of cellular signals such as gene expression. These possibilities would be aided by methods to discriminate GV-generated ultrasound signals from anatomical background. Here, we show that the nonlinear response of engineered GVs to acoustic pressure enables selective imaging of these nanostructures using a tailored amplitude modulation strategy. Finite element modeling predicted a strongly nonlinear mechanical deformation and acoustic response to ultrasound in engineered GVs. This response was confirmed with ultrasound measurements in the range of 10 to 25 MHz. An amplitude modulation pulse sequence based on this nonlinear response allows engineered GVs to be distinguished from linear scatterers and other GV types with a contrast ratio greater than 11.5 dB. We demonstrate the effectiveness of this nonlinear imaging strategy in vitro, in cellulo, and in vivo.
Figures
Similar articles
-
Nonlinear X-wave ultrasound imaging of acoustic biomolecules.Phys Rev X. 2018 Oct-Dec;8(4):041002. doi: 10.1103/physrevx.8.041002. Epub 2018 Oct 4. Phys Rev X. 2018. PMID: 34040818 Free PMC article.
-
Harmonic imaging for nonlinear detection of acoustic biomolecules.APL Bioeng. 2024 Nov 12;8(4):046110. doi: 10.1063/5.0214306. eCollection 2024 Dec. APL Bioeng. 2024. PMID: 39540107 Free PMC article.
-
Harmonic imaging for nonlinear detection of acoustic biomolecules.bioRxiv [Preprint]. 2024 Jun 22:2024.06.18.599141. doi: 10.1101/2024.06.18.599141. bioRxiv. 2024. Update in: APL Bioeng. 2024 Nov 12;8(4):046110. doi: 10.1063/5.0214306. PMID: 38948831 Free PMC article. Updated. Preprint.
-
Ultrasound contrast agents from microbubbles to biogenic gas vesicles.Med Rev (2021). 2022 Oct 19;3(1):31-48. doi: 10.1515/mr-2022-0020. eCollection 2023 Feb. Med Rev (2021). 2022. PMID: 37724107 Free PMC article. Review.
-
Achieving Spatial and Molecular Specificity with Ultrasound-Targeted Biomolecular Nanotherapeutics.Acc Chem Res. 2019 Sep 17;52(9):2427-2434. doi: 10.1021/acs.accounts.9b00277. Epub 2019 Aug 9. Acc Chem Res. 2019. PMID: 31397992 Free PMC article. Review.
Cited by
-
Concurrent visual and acoustic tracking of passive and active delivery of nanobubbles to tumors.Theranostics. 2020 Sep 23;10(25):11690-11706. doi: 10.7150/thno.51316. eCollection 2020. Theranostics. 2020. PMID: 33052241 Free PMC article.
-
Biomolecular Ultrasound and Sonogenetics.Annu Rev Chem Biomol Eng. 2018 Jun 7;9:229-252. doi: 10.1146/annurev-chembioeng-060817-084034. Epub 2018 Mar 26. Annu Rev Chem Biomol Eng. 2018. PMID: 29579400 Free PMC article. Review.
-
Characterizing Single Polymeric and Protein Nanoparticles with Surface Plasmon Resonance Imaging Measurements.ACS Nano. 2017 Jul 25;11(7):7447-7456. doi: 10.1021/acsnano.7b03859. Epub 2017 Jul 12. ACS Nano. 2017. PMID: 28692253 Free PMC article.
-
Biomolecular Ultrasound Imaging of Phagolysosomal Function.ACS Nano. 2020 Sep 22;14(9):12210-12221. doi: 10.1021/acsnano.0c05912. Epub 2020 Sep 14. ACS Nano. 2020. PMID: 32902951 Free PMC article.
-
Nonlinear X-wave ultrasound imaging of acoustic biomolecules.Phys Rev X. 2018 Oct-Dec;8(4):041002. doi: 10.1103/physrevx.8.041002. Epub 2018 Oct 4. Phys Rev X. 2018. PMID: 34040818 Free PMC article.
References
-
- Liang H.-D., Alison Noble J., and Wells P. N. T., Interface Focus (4), 475 (2011).10.1098/rsfs.2011.0042 - DOI
Grants and funding
LinkOut - more resources
Full Text Sources
Other Literature Sources
Miscellaneous