. 2017 Feb 27:11:45.
doi: 10.3389/fncel.2017.00045. eCollection 2017.

Loss of Saltation and Presynaptic Action Potential Failure in Demyelinated Axons

Affiliations

Loss of Saltation and Presynaptic Action Potential Failure in Demyelinated Axons

Mustafa S Hamada et al. Front Cell Neurosci. .

Abstract

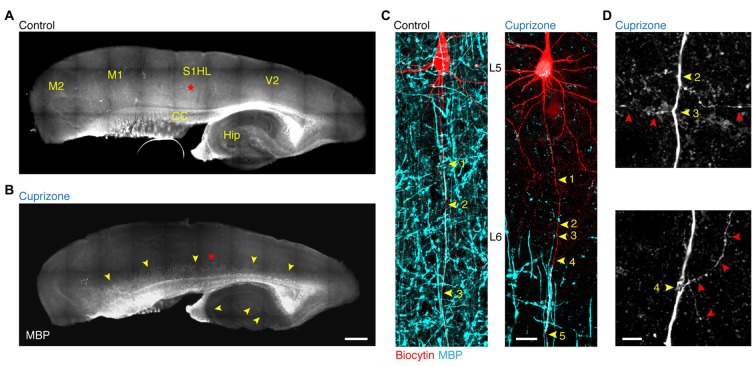
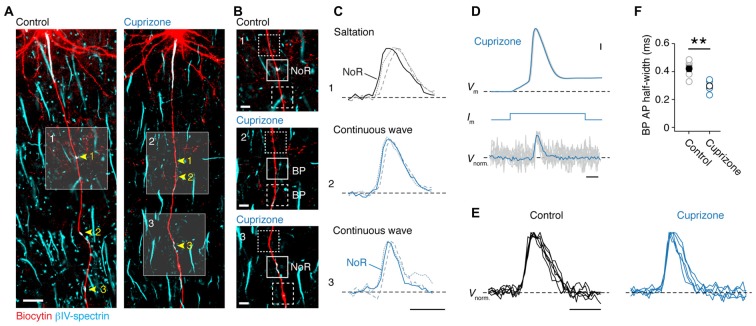
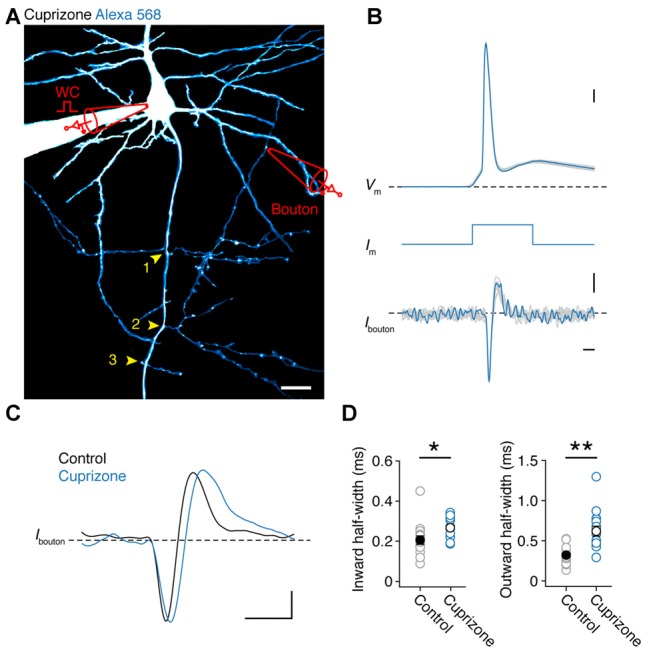
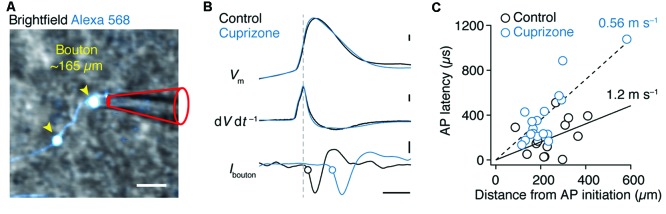
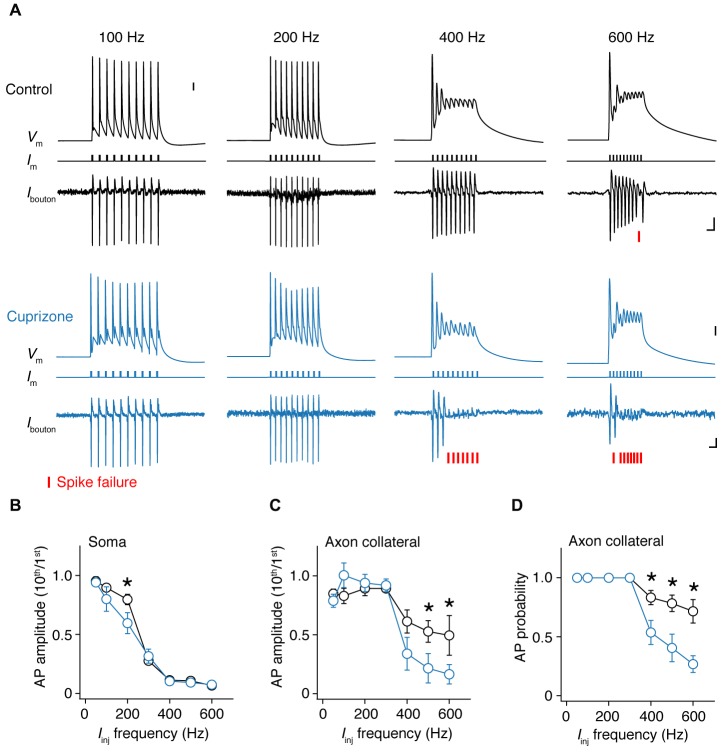
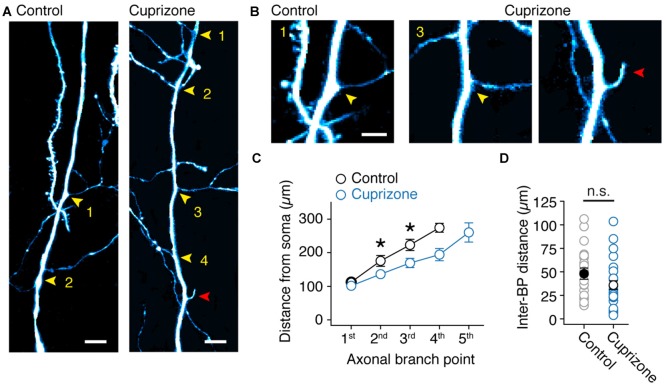
In cortical pyramidal neurons the presynaptic terminals controlling transmitter release are located along unmyelinated axon collaterals, far from the original action potential (AP) initiation site, the axon initial segment (AIS). Once initiated, APs will need to reliably propagate over long distances and regions of geometrical inhomogeneity like branch points (BPs) to rapidly depolarize the presynaptic terminals and confer temporally precise synaptic transmission. While axon pathologies such as demyelinating diseases are well established to impede the fidelity of AP propagation along internodes, to which extent myelin loss affects propagation along BPs and axon collaterals is not well understood. Here, using the cuprizone demyelination model, we performed optical voltage-sensitive dye (VSD) imaging from control and demyelinated layer 5 pyramidal neuron axons. In the main axon, we find that myelin loss switches the modality of AP propagation from rapid saltation towards a slow continuous wave. The duration of single AP waveforms at BPs or nodes was, however, only slightly briefer. In contrast, by using two-photon microscopy-guided loose-seal patch recordings from axon collaterals we revealed a presynaptic AP broadening in combination with a reduced velocity and frequency-dependent failure. Finally, internodal myelin loss was also associated with de novo sprouting of axon collaterals starting from the primary (demyelinated) axon. Thus, the loss of oligodendrocytes and myelin sheaths bears functional consequences beyond the main axon, impeding the temporal fidelity of presynaptic APs and affecting the functional and structural organization of synaptic connectivity within the neocortex.

Keywords: action potential; axon; axon collaterals; boutons; demyelination; node of Ranvier.


Figures

Figure 1
Figure 1
Demyelination of the main axon of thick-tufted layer 5 pyramidal neurons. (A,B) Overview fluorescent image of a myelinated (A) demyelinated (B) parasagittal brain section immunolabeled for myelin basic protein (MBP). Red asterisks, indicate the locations of the recorded thick-tufted layer 5 neuron shown in (C). Note that cuprizone-induced gray matter demyelination (yellow arrowheads) occurs across the entire cerebral cortex. S1HL, primary somatosensory hindlimb cortex; V2, secondary visual cortex; M1, primary motor cortex; M2, secondary motor cortex; CC, corpus collosum; Hip, hippocampus. Scale bar, 700 μm, (C) z-projected confocal images of layer 5 axons co-labeled for biocytin (red) and MBP expression (cyan). Yellow arrowheads, indicate branch points (BPs) along the main axon. Scale bar, 20 μm. (D) Magnified z-projected confocal images of BPs of the demyelinated primary axon shown in (C). Yellow arrowheads, BPs. Red arrowheads, trajectory of the primary and secondary axon collaterals. Scale bar, 5 μm.
Figure 2
Figure 2
Loss of saltatory propagation and narrowing of nodal action potentials (APs) in demyelinated axons. (A) Z-projected confocal images of primary layer 5 axons immuno-labeled for (biocytin, red) and βIV-spectrin (cyan). Nodes of Ranvier (noR) in myelinated (left) and BPs in demyelinated (right) axons are highlighted. Scale bar, 20 μm. (B) Zoomed in regions of interest indicated by white squares in (A). Examples of normal noR pattern in control mice (top) and BPs from cuprizone treated mice: lacking βIV-spectrin (middle) and βIV-spectrin enriched (bottom). Scale bar, 5 μm. (C) Top: normalized voltage-sensitive dye (VSD) traces from noR (solid line), preceding internode (dotted line) and following internode (dashed line). Middle and bottom: normalized VSD traces from BP (solid line), more proximal area (dotted line) and more distal area (dashed line). Scale bar, 0.5 ms. (D) Align and overlay of nine example (out of 100) somatic APs and their corresponding BP spikes (VSD recorded at 20 kHz, gray) and the average of all 100 recorded traces (black). Somatic single APs (top) were elicited through brief (3 ms; middle) square current pulse. BP, branch point. Scale bar, 0.5 ms; 10 mV. (E) Normalized VSD traces from control (5 noR; n = 5 cells) and cuprizone-treated mice (6 BPs; n = 5 cells). Scale bar, 0.5 ms. (F) Comparison of BP AP half-widths in control and cuprizone treated mice obtained from VSD data. APs in cuprizone treated mice are significantly narrower (control, n = 5 noR; cuprizone, n = 6 BPs; Mann-Whitney (M-W) test, **P = 0.0087). Individual cells plotted as open circles.
Figure 3
Figure 3
Presynaptic bouton recordings reveal AP broadening in axon collaterals. (A) 2P fluorescence overview image of a demyelinated layer 5 pyramidal neuron loaded with Alexa 568 (200 μM), Yellow arrows, BP locations. Image has been modified for clarity by subtracting the background noise extensively to highlight the collateral tree. A loose-seal recording is indicated schematically. Scale bar, 20 μm. (B) Temporally aligned overlay of eight somatic APs and their corresponding bouton axonal spikes. Bouton loose-seal patch APs (bottom) were recorded by repetitively eliciting somatic single APs (top) through brief (3 ms; middle) square current pulse. Scale bar, 0.5 ms; 10 mV; 5 pA. (C) Example traces of aligned APs recorded in control (black) and demyelinated (blue) axon collaterals (~149 μm from the AP initiation). Scale bar, 1 ms; 5 pA. (D) Plots of the average half-widths of the inward and outward current components of the recorded bouton APs. Cuprizone, blue circles, n = 16 boutons from 14 cells. Control, gray circles, n = 15 boutons from 14 cells. Individual recordings plotted as open circles. M-W test, *P = 0.0010, **P = 0.0002, respectively. Data are presented as mean ± SEM.
Figure 4
Figure 4
Reduced conduction velocity in axon collaterals of demyelinated layer 5 axons. (A) Magnified 2P scan overlaid with the brightfield image from a demyelinated layer 5 axon a distance of ~165 μm from the soma. Scale bar, 2 μm. (B) Top, somatically evoked single APs from control and demyelinated layer 5 neurons. Middle, time derivative of the somatic APs aligned at peak amplitude. Bottom, loose-seal patch recording of bouton APs recorded at ~300 μm from the soma of respective neurons. Note the delay of the AP in demyelinated axon due to reduced conduction velocity as a consequence of myelin loss. Closed circles indicate the 20% onset of the local spike maxima. Scale bar, 0.5 ms; 10 mV; 1 kV s−1; 5 pA. (C) Axosomatic latency plotted vs. total measured bouton distance (measured from the AP initiation site, 26 μm). Control (n = 13 boutons from 13 cells; open circles) and cuprizone data sets (n = 17 boutons from 15 cells; blue open circles) are fitted with a linear function.
Figure 5
Figure 5
Frequency-dependent AP failures in presynaptic boutons of demyelinated axons. (A) Simultaneous somatic whole-cell and axonal loose-seal recording from control (black) and demyelinated neurons (blue) during somatic current injections (1 ms pulses) at increasing frequencies. Note the increased failure rate in demyelinated axons. Asterisks, spike failure. Scale bar, 5 ms; 10 mV; 10 pA. Somatic capacitive transients are blanked for clarity reasons. (B) Normalized somatic AP amplitude vs. injected current frequency. t-test, *P = 0.0432. (C) Collateral AP amplitude vs. evoked injected current frequency. M-W test, *P = 0.0446 (500 Hz); *P = 0.0426 (600 Hz). (D) Relationship between AP probability vs. somatic step frequency in control (n = 16 boutons from 16 cells; black open circles) and demyelinated axons (n = 14 boutons from 14 cells; black open circles). Data presented as average ± SEM. M-W test, P = 0.0185 (400 Hz); P = 0.0098 (500 Hz); P = 0.0063 (600 Hz).
Figure 6
Figure 6
Sprouting of new axon collaterals in demyelinated axons. (A) Fluorescent 2P images of the proximal BPs in control and demyelinated layer 5 axons. Note the larger number of BPs in demyelinated axon compared to control. Yellow arrowheads, BPs. Red arrowhead, putative de novo axon outgrowth. Scale bar, 10 μm. (B) Magnified 2P images of the same images shown in (A). Yellow arrowheads, BPs; Red arrowhead, putative de novo axon outgrowth. Scale bar, 5 μm. (C) Plot of the BP locations within the first 350 μm of primary axon (measured from the soma). M-W test, *P = 0.0301 (control, n = 11 BPs; cuprizone, n = 13 BPs; 2nd branch point); *P = 0.0079 (control, n = 10 BPs; cuprizone, n = 11 BPs; 3rd branch point). Data presented as mean ± SEM. (D) Plot of the average inter-BP distance. Control, black open circles, n = 24 inter-BP distances from 11 cells. Cuprizone, blue open circles, n = 28 inter-BP distances from 12 cells. M-W test P = 0.1670.

References

    1. Apostolides P. F., Milstein A. D., Grienberger C., Bittner K. C., Magee J. C. (2016). Axonal filtering allows reliable output during dendritic plateau-driven complex spiking in CA1 neurons. Neuron 89, 770–783. 10.1016/j.neuron.2015.12.040 - DOI - PubMed
    1. Arroyo E. J., Xu T., Grinspan J., Lambert S., Levinson S. R., Brophy P. J., et al. . (2002). Genetic dysmyelination alters the molecular architecture of the nodal region. J. Neurosci. 22, 1726–1737. - PMC - PubMed
    1. Bagchi B., Al-Sabi A., Kaza S., Scholz D., O’Leary V. B., Dolly J. O., et al. . (2014). Disruption of myelin leads to ectopic expression of KV1.1 channels with abnormal conductivity of optic nerve axons in a cuprizone-induced model of demyelination. PLoS One 9:e87736. 10.1371/journal.pone.0087736 - DOI - PMC - PubMed
    1. Black J. A., Waxman S. G., Smith K. J. (2006). Remyelination of dorsal column axons by endogenous Schwann cells restores the normal pattern of Nav1.6 and Kv1.2 at nodes of Ranvier. Brain 129, 1319–1329. 10.1093/brain/awl057 - DOI - PubMed
    1. Bostock H., Sears T. A. (1978). The internodal axon membrane: electrical excitability and continuous conduction in segmental demyelination. J. Physiol. 280, 273–301. 10.1113/jphysiol.1978.sp012384 - DOI - PMC - PubMed

LinkOut - more resources