. 2017 Feb 27:8:192.
doi: 10.3389/fimmu.2017.00192. eCollection 2017.

Murine Cytomegalovirus Infection Induces Susceptibility to EAE in Resistant BALB/c Mice

Affiliations

Murine Cytomegalovirus Infection Induces Susceptibility to EAE in Resistant BALB/c Mice

Jelena Milovanovic et al. Front Immunol. .

Abstract

In contrast to C57BL/6 mice, BALB/c mice are relatively resistant to the induction of experimental autoimmune encephalomyelitis (EAE) after challenge with MOG35-55 peptide. Here, we provide the first evidence that infection with murine cytomegalovirus (MCMV) in adulthood abrogates this resistance. Infected BALB/c mice developed clinical and histological signs similar to those seen in susceptible C57BL/6 mice. In addition to CD4+ cells, large proportion of cells in the infiltrate of diseased BALB/c mice was CD8+, similar with findings in multiple sclerosis. CD8+ cells that responded to ex vivo restimulation with MOG35-55 were not specific for viral epitopes pp89 and m164. MCMV infection favors proinflammatory type of dendritic cells (CD86+CD40+CD11c+) in the peripheral lymph organs, M1 type of microglia in central nervous system, and increases development of Th1/Th17 encephalitogenic cells. This study indicates that MCMV may enhance autoimmune neuropathology and abrogate inherent resistance to EAE in mouse strain by enhancing proinflammatory phenotype of antigen-presenting cells, Th1/Th17, and CD8 response to MOG35-55.

Keywords: BALB/c mice; T cells; antigen-presenting cells; experimental autoimmune encephalomyelitis; murine cytomegalovirus infection.


Figures

Figure 1
Figure 1
BALB/c mice infected with murine cytomegalovirus (MCMV) and immunized with MOG35–55 develop experimental autoimmune encephalomyelitis (EAE). Eight-week-old BALB/c mice were infected (foot-pad injection) with MCMV and 10 days after were immunized with MOG35–55 peptide in CFA and pertussis toxin (BALB/c MCMV + MOG35–55). Control mice C57BL/6 and BALB/c were immunized with MOG35–55 peptide in CFA and pertussis toxin without previous infection (C57BL/6 MOG35–55 and BALB/c MOG35–55). (A) EAE scores up to day 15 post-EAE induction (four separate experiments, n = 29/group). (B) Mean maximal clinical score up to day 15 post-EAE induction (four separate experiments, n = 29/group). (C) The mean value of the mononuclear cells isolated from central nervous system (CNS) of BALB/c MCMV + MOG35–55 and BALB/c MOG35–55 mice (three independent experiments, n = 24/group). (D) Mean histological scores were calculated from a total of five sections per group (two separate experiments, n = 8/group). (E) The representative images of brain cortex (a), brain stem (b), cerebellum (c) of BALB/c MCMV + MOG35–55; brain cortex (d), brain stem (e), cerebellum (f) of BALB/c MCMV-infected mice (BALB/c MCMV); and brain cortex (g), brain stem (h), cerebellum (i) of BALB/c MOG35–55 mice. (F) The representative images of spinal cords of BALB/c MCMV + MOG35–55 (a–c); BALB/c MCMV (d); and BALB/c MOG35–55 mice (e). (G) Representative sections of CD3 spinal cord immunohistochemistry of BALB/c MCMV + MOG35–55 (a,b); BALB/c MCMV (c); and BALB/c MOG35–55 mice (d), arrows in left panels indicate the area presented in magnified sections in right panels. All pictures are representative of two separate experiments (n = 16/group). Data were analyzed by Student’s t-test and presented as mean + SE: *P < 0.05 and ***P < 0.001.
Figure 2
Figure 2
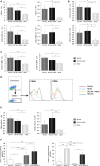
BALB/c murine cytomegalovirus (MCMV) + MOG35–55 mice have increased number of inflammatory CD4+ and CD8+ cells. Eight-week-old BALB/c mice were infected with MCMV and 2 weeks after were immunized with MOG35–55 peptide. After 15 days, mice were perfused, central nervous system was harvested, and mononuclear cells were isolated and restimulated ex vivo with PMA and ionomycin before performing intra cellular staining. (A) Total cell numbers of CD45+CD4+, CD45+CD8+ cells. (B) Representative FACS images of percentages and (C) total cell numbers of CD4+IFN-γ+, CD4+TNF-α+, CD4+IL-17+, CD8+IFN-γ+, CD8+TNF-α+ and CD8+IL-17+ cells. Total cell numbers of CD8+ cell- and CD4+ cell-expressing transcriptional factors T-bet and RORγt (D) and chemokine receptors CXCR3 and CCR6 (E). Data from three separate experiments with 22 mice/group are presented as mean + SE. Data were analyzed with Student’s t-test: *P < 0.05, **P < 0.005, and ***P < 0.001.
Figure 3
Figure 3
CD8 T cells in the central nervous system (CNS) of BALB/c murine cytomegalovirus (MCMV) + MOG35–55 mice express markers of cytolytic activity and contribute to autoimmune reactions in CNS. CD4+ cells were depleted 10 days after MCMV infection and 5 days before immunization with MOG35–55 (anti-CD4), control mice were infected and immunized but received saline instead of depleting antibody (saline). (A) Experimental autoimmune encephalomyelitis (EAE) scores up to day 22 post-EAE induction in anti-CD4 and saline mice, data are presented as mean + SE from one experiment with five mice per group. (B) Percentages and absolute numbers of CD8+granzyme B+ and CD8+perforin+ cells among mononuclear cells isolated from CNS 15 days post-immunization with MOG35–55 peptide of BALB/c mice infected with MCMV 10 days earlier (MCMV + MOG35–55) and previously untreated BALB/c mice (MOG35–55). Data are presented as mean + SE, from two separate experiments with 14 mice/group. (C) Percentages of CD4+IFN-γ+ and CD8+IFN-γ+ cells and (D) representative flow images of IFN-γ, pp89, and m164 expression in CD8+ population among mononuclear cells isolated from CNS of MCMV-infected and MOG35–55-immunized BALB/c mice and MOG35–55-immunized BALB/c and C57BL/6 mice in vitro restimulated with MOG35–55 peptide. Percentages are presented as mean + SE (representative experiment with six mice per group). Data were analyzed with Student’s t-test and Kruskal–Wallis: *P < 0.05, **P < 0.005.
Figure 4
Figure 4
BALB/c mice with latent murine cytomegalovirus (MCMV) infection develop experimental autoimmune encephalomyelitis and longlasting infiltrates in central nervous system. Mice were infected with MCMV, and 3 months later they were immunized with MOG35–55 peptide, and disease was evaluated for 60 days. (A) Mean clinical score and (B) representative images of spinal cord sections 60 days after immunization with MOG35–55 peptide in MCMV + MOG35–55 group (a–c) and MOG35–55 group (d–f). (C) Representative flow cytometric images presenting percentages of IL-17- and IFN-γ-expressing CD4+ and CD8+ cells among mononuclear cells isolated from brains 60 days after immunization with MOG35–55 peptide. Presented data are from representative experiment with seven mice per group.
Figure 5
Figure 5
Murine cytomegalovirus (MCMV) infection favors inflammatory phenotype of antigen-presenting cells. Mononuclear cells were isolated from inguinal lymph nodes 2 days after immunization with MOG35–55 peptide (MOG35–55) and from lymph nodes of mice 10 days after their MCMV infection (MCMV). Flow cytometric analysis of dendritic cells phenotype was done. (A) Percentages and absolute numbers of CD11c+ dendritic cells and CD11c+CD11bPDCA1+ dendritic cells, (B) CCR2-expressing CD11c+ cells, and (C) CD86+ and CD40+ dendritic cells are presented as mean + SE (10 mice per group). (D) Representative histograms of CD40 and CD86 expression in CD11c+ population. (E) Percentages and absolute numbers of IL-12+ dendritic cells presented as mean + SE (10 mice per group). (F) Mononuclear cells were isolated from central nervous system of saline-treated, MOG35–55-immunized, MCMV-infected, and MCMV-infected and MOG35–55-immunized mice, 15 days after MOG35–55 immunization percentages of classically (CD11c+) and alternatively (CD206+) microglia are presented as mean + SE (8–10 mice per group). Data were analyzed with Student’s t-test and ANOVA: *P < 0.05, **P < 0.005, and ***P < 0.001.

Similar articles

Cited by

References

    1. Hemmer B, Nessler S, Zhou D, Kieseier B, Hartung HP. Immunopathogenesis and immunotherapy of multiple sclerosis. Nat Clin Pract Neurol (2006) 2(4):201–11.10.1038/ncpneuro0154 - DOI - PubMed
    1. Sibley WA, Bamford CR, Clark K. Clinical viral infections and multiple sclerosis. Lancet (1985) 2(8441):1313–5. - PMC - PubMed
    1. Johnson RT. The virology of demyelinating diseases. Ann Neurol (1994) 36(Suppl):S54–60. - PMC - PubMed
    1. Soldan SS, Jacobson S. Role of viruses in etiology and pathogenesis of multiple sclerosis. Adv Virus Res (2001) 56:517–55.10.1016/S0065-3527(01)56037-6 - DOI - PMC - PubMed
    1. Ascherio A, Munger KL. Environmental risk factors for multiple sclerosis. Part I: the role of infection. Ann Neurol (2007) 61(4):288–99.10.1002/ana.21117 - DOI - PubMed