. 2017 Mar 9;2(5):e88747.
doi: 10.1172/jci.insight.88747.

Preferential TNF α signaling via TNFR2 regulates epithelial injury and duct obstruction in experimental biliary atresia

Affiliations

Preferential TNF α signaling via TNFR2 regulates epithelial injury and duct obstruction in experimental biliary atresia

Pranavkumar Shivakumar et al. JCI Insight. .

Abstract

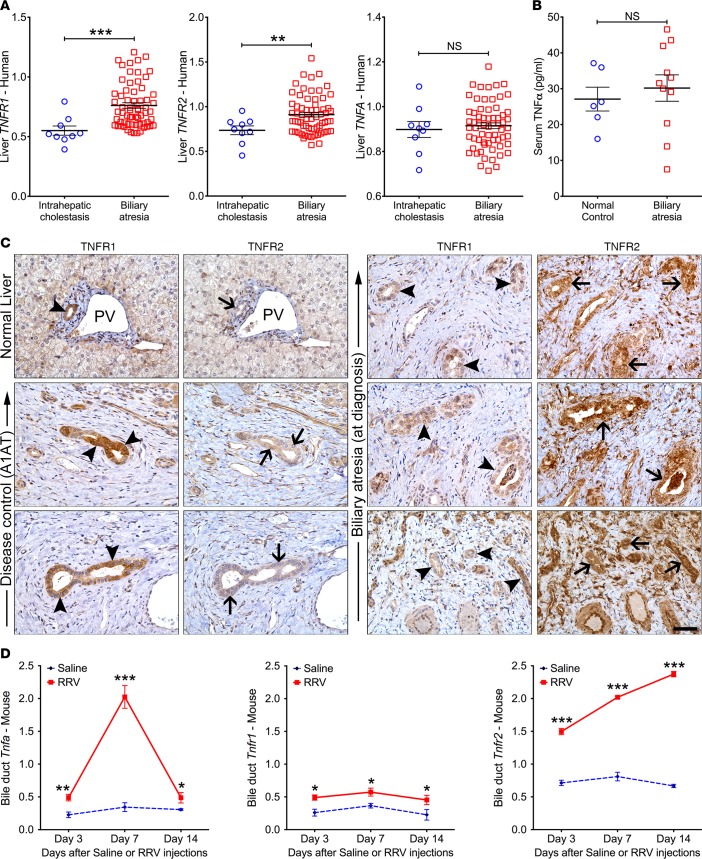
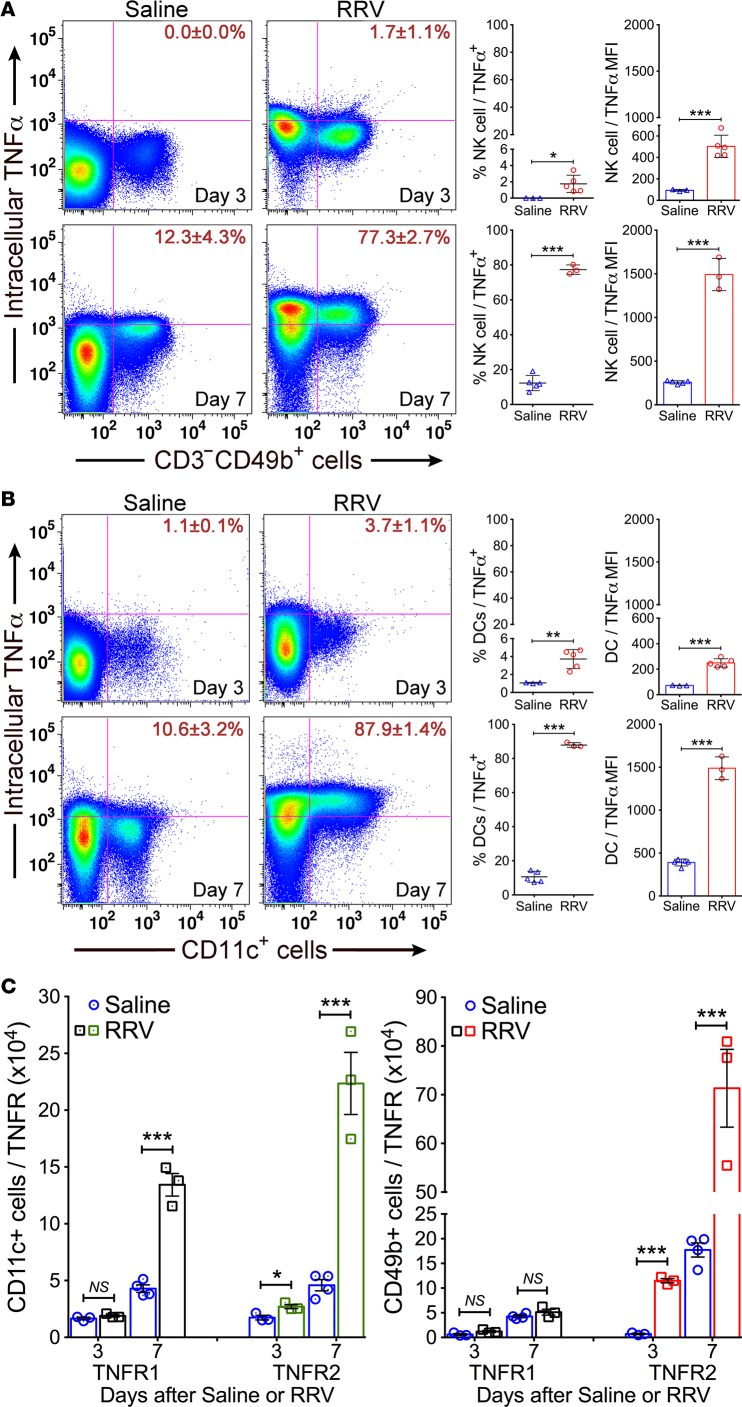
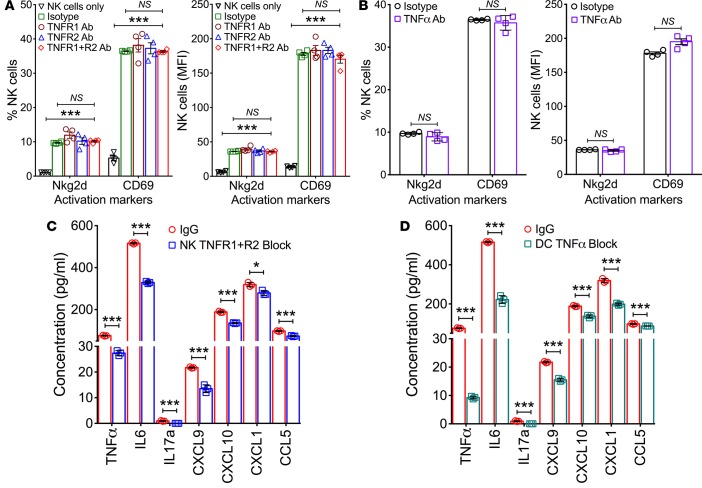
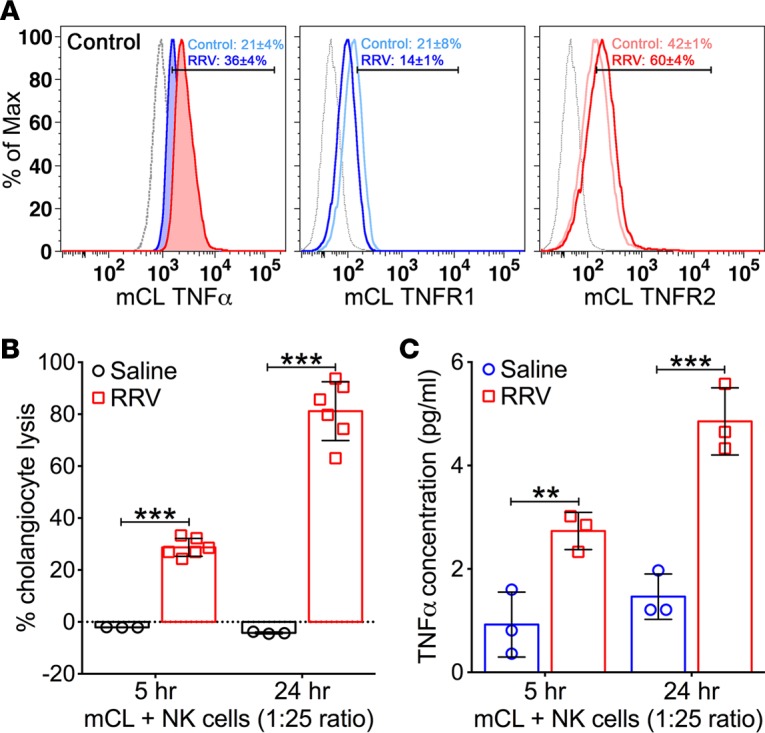
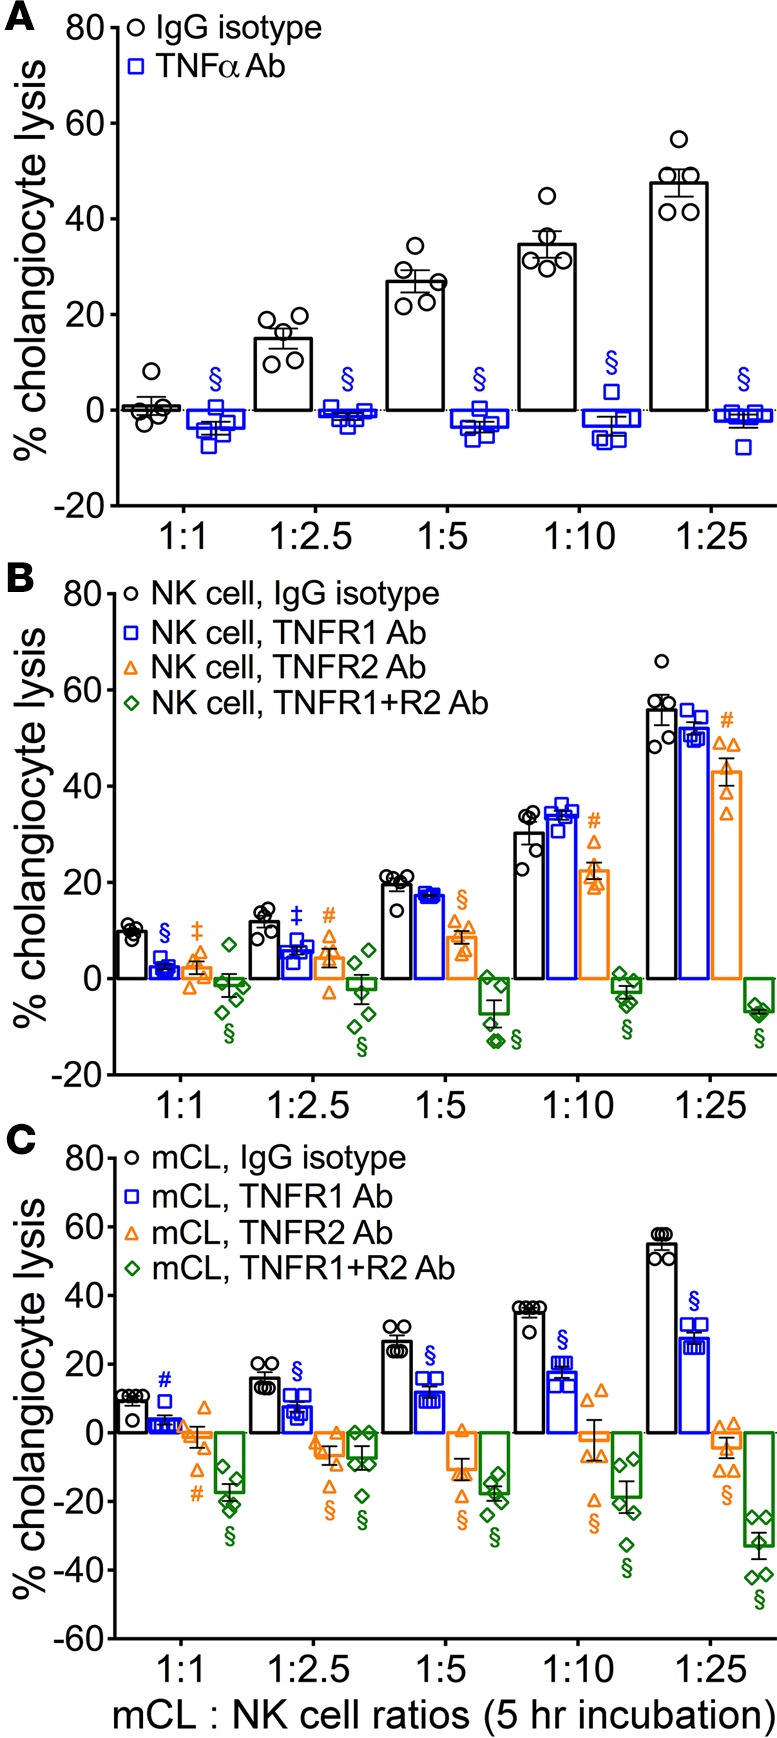
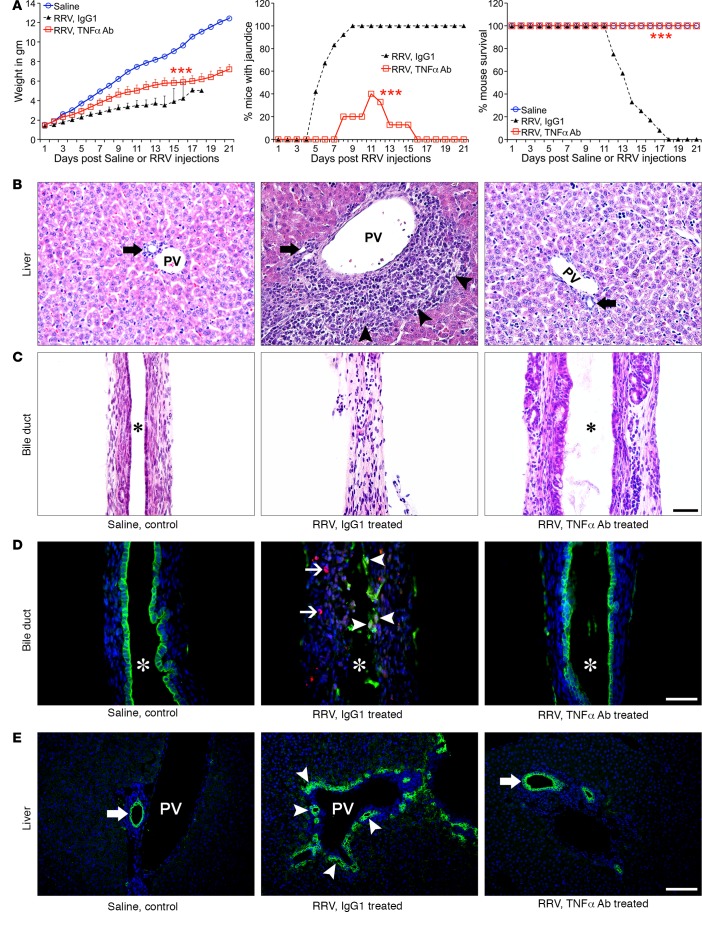
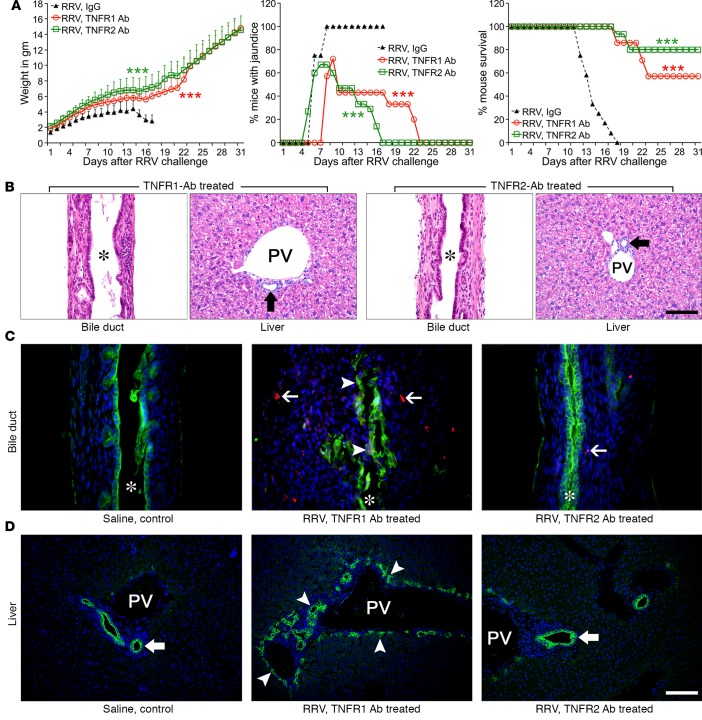
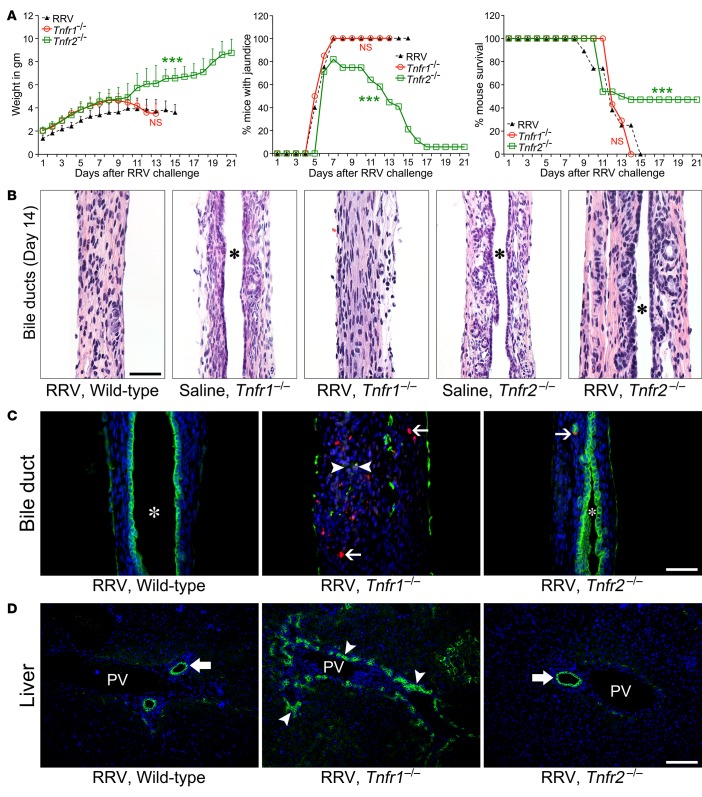
Biliary atresia is an obstructive cholangiopathy of infancy that progresses to end-stage cirrhosis. Although the pathogenesis of the disease is not completely understood, previous reports link TNFα to apoptosis of the bile duct epithelium in the presence of IFNγ. Here, we investigate if TNFα signaling regulates pathogenic mechanisms of biliary atresia. First, we quantified the expression of TNFA and its receptors TNFR1 and TNFR2 in human livers and found an increased expression of the receptors at the time of diagnosis. In mechanistic experiments using a neonatal mouse model of rhesus rotavirus-induced (RRV-induced) biliary atresia, the expression of the ligand and both receptors increased 6- to 8-fold in hepatic DCs and NK lymphocytes above controls. The activation of tissue NK cells by RRV-primed DCs was independent of TNFα-TNFR signaling. Once activated, the expression of TNFα by NK cells induced lysis of 55% ± 2% of bile duct epithelial cells, which was completely prevented by blocking TNFα or TNFR2, but not TNFR1. More notably, antibody-mediated or genetic disruption of TNFα-TNFR2 signaling in vivo decreased apoptosis and epithelial injury; suppressed the infiltration of livers by T cells, DCs, and NK cells; prevented extrahepatic bile duct obstruction; and promoted long-term survival. These findings point to a key role for the TNFα/TNFR2 axis on pathogenesis of experimental biliary atresia and identify new therapeutic targets to suppress the disease phenotype.


Conflict of interest statement

Conflict of interest: The authors have declared that no conflict of interest exists.

Figures

Figure 1
Figure 1. Expression of TNFα and TNFRs in humans and mice with biliary atresia.
(A) Liver mRNA expression for TNFA, TNFR1, and TNFR2 from microarray analysis of livers from infants with biliary atresia (n = 64) and intrahepatic cholestasis (n = 14) at diagnosis normalized to age-matched normal controls. (B) Scatter plots of serum TNFα levels in infants with biliary atresia at diagnosis (n = 11) and healthy infants (n = 6). (C) Representative immunohistochemical panels identify TNFR1+ signals (arrowheads) in livers from normal and disease controls (α-1 antitrypsin deficient, A1AT) relative to the less intense signals for TNFR2 (arrows). In contrast, TNFR2 stains strongly in patients with biliary atresia. PV, portal vein. (D) mRNA expression levels of Tnfa, Tnfr1, and Tnfr2 in extrahepatic bile ducts from mice at 3, 7, and 14 days after injection of saline or RRV by real-time PCR. Expression was normalized against Hprt. n = 4–5 mice/group/time point. Values expressed as mean ± SD. *P < 0.05,**P < 0.01, ***P < 0.001, 2-tailed parametric unpaired t test with Welch’s correction.
Figure 2
Figure 2. Hepatic NK and DCs express TNFα.
Flow cytometric dot plot analyses showing the percent of (A) NK cells or (B) CD11c+ DCs from saline or RRV-challenged mice expressing TNFα, with an increased expression of intracellular TNFα at the onset of epithelial injury (day 3) and duct obstruction (day 7). Graphs on right show the percent populations and mean fluorescence intensities (MFI) of TNFα on NK and DCs. (C) Total number of DCs and NK cells expressing TNFR1 or -R2 at 3 and 7 days after saline or RRV infection. n = 4–5 specimens/group/time point with pools of 2–3 livers/specimen. Values expressed as mean ± SD. *P < 0.03, **P < 0.01, ***P < 0.001, 2-tailed parametric unpaired t test with Welch’s correction.
Figure 3
Figure 3. Activation markers and cytokine/chemokine expression following blockade of TNFα or TNFR1/2.
Flow cytometric quantification of Nkg2d and CD69 in naive NK cells after coculture with RRV-primed DC in the presence of antibodies against TNFR1 and/or TNFR2 (A) or TNFα (B). Data are shown as % of cells and mean fluorescence intensities (MFI). (C and D) The concentration of individual cytokines/chemokines in the conditioned media from coculture experiments in which anti-TNFR1/2 antibodies were incubated with NK cells (C) or anti-TNFα antibodies with DC (D). n = 6 wells/condition with NK and DCs from pools of 3–4 livers. Values expressed as mean ± SD. *P < 0.05, ***P < 0.001, 2-tailed unpaired t test.
Figure 4
Figure 4. Expression of TNFα and TNFR1/2 in cholangiocytes and NK-mediated cytotoxicity.
(A) Representative flow cytometry histograms show constitutive expression of TNFα, TNFR1, and TNFR2 by the cholangiocyte cell line (mCL) at baseline and after infection with RRV. Isotype stainings are shown as dotted gray lines; n = 6–8 replicates/staining. (B) LDH release assays show increased cholangiocyte lysis at 5 and 24 hours when mCL cells are cocultured with NK cells isolated from neonatal mice 7 days after injection of saline or RRV. n = 3–6 wells/time point. (C) Concentrations of TNFα in conditioned media from the cytotoxicity experiments with mCL and NK cells. Values are shown as mean ± SD. n = 3 wells/time point. **P < 0.01, ***P < 0.001, parametric 2-tailed t test with Welch’s correction.
Figure 5
Figure 5. Blocking antibodies to TNFα and TNFRs prevents cholangiocyte killing.
(A) LDH release by mCL cells after incubation with RRV-primed NK cells for 5 hours. Blocking antibodies to TNFα but not isotype lgG completely abolished cell lysis. B and C use the same experimental approach but use antibodies to TNFR1 and/or TNFR2. Results are representative of 2 independent experiments with NK cells obtained from a pool of 3–4 livers/sample. n = 4–6 wells/ratio/sample. Values depicted as mean ± SD, and levels of significance determined by 2-tailed parametric unpaired t test with Welch’s correction; #P < 0.05,‡P < 0.01, §P < 0.001.
Figure 6
Figure 6. Anti-TNFα antibodies suppress the phenotype and bile duct injury.
(A) Daily treatment with anti-TNFα antibodies after RRV improved growth, recovery from jaundice, and survival of mice when compared with isotype and saline controls. n = 10–20 mice/group; ***P < 0.001 (lgG vs. TNFα Ab). (B and C) Representative H&E-stained sections of livers and extrahepatic bile ducts show suppression of liver inflammation and no bile duct obstruction in mice receiving anti-TNFα antibodies. Arrows denote intrahepatic bile ducts, and arrowheads show portal inflammation. (D) lmmunofluorescence staining for cytokeratin-19 (CK19, green) and activated caspase 3 (Casp3, red) shows dual-positive cells in bile ducts from lgG1- but not in TNFα Ab–treated mice. Arrowheads, CK19+Casp3+ cells; arrows, periductal Casp3 cells. (E) Representative immunostaining panels show decreased cholangiocyte profiles in livers of TNFα-blocked mice. Arrowheads, increased cholangiocyte profiles; arrows, normal ducts; asterisk, duct lumen; PV, portal vein. n = 4–6 mice/treatment group. Magnification of 400×; scale bar: 50 μm.
Figure 7
Figure 7. Improved duct injury, liver inflammation, and apoptosis after antibody blocking of TNFR1 or TNFR2.
(A) Daily treatment with antibodies to TNFR1 or TNFR2 after RRV improved growth, recovery from jaundice, and survival of mice. n = 10–20 mice/group; ***P < 0.001. (B) Representative H&E-stained sections of extrahepatic bile ducts and livers at day 31 after RRV infection show improvement in mice treated with antibodies to TNFR1 or TNFR2. Arrows denote normal intrahepatic bile ducts. (C) lmmunofluorescence staining for cytokeratin-19 (CK19, green) and activated caspase 3 (Casp31, red) shows dual-positive cells in bile ducts from TNFR1 but not TNFR2 Ab–treated mice. Arrowheads, CK19+Casp3+ cells; arrows, periductal Casp3 cells. (D) CK19 immunostaining in livers of TNFR1 and TNFR2 Ab–treated mice. Arrowheads, increased cholangiocyte profiles; block arrows, normal ducts. n = 4-6 mice/treatment group/day. PV, portal vein. Asterisks denote duct lumen. Magnification of 400×; scale bar: 50 μm.
Figure 8
Figure 8. Genetic absence of TNFR2 but not TNFR1 suppresses the phenotype and bile duct injury.
(A) The clinical phenotypes of WT and Tnfr1–/– mice after RRV were similar, but Tnfr2–/– mice had resolution of jaundice over time and improved survival. n = 10–20 mice/group (WT vs. Tnfr1–/–), ***P < 0.001 (WT vs. Tnfr2–/–). (B) Representative H&E stain of longitudinal sections of extrahepatic bile ducts showing normal histology in saline-injected controls in both lines of KO mice, with obstructed duct lumen in Tnfr1–/– mice and patent duct in Tnfr2–/–mice 14 days after RRV. (C) Loss of Tnfr2 prevented caspase activation (Casp3, red) in epithelial (CK19, green) and submucosal cells. Arrowheads, CK19+Casp3+ cells; arrows, submucosal Casp3 cells. (D) Immunostaining for CK19 in livers from Tnfr1–/– and Tnfr2–/– mice. Arrowheads, increased cholangiocyte profiles; arrows, normal ducts. Asterisk denotes duct lumen. n = 4–6 mice/treatment group/day. Magnification of 400×; scale bar: 50 μm.

References

    1. Bessho K, Bezerra JA. Biliary atresia: will blocking inflammation tame the disease? Annu Rev Med. 2011;62:171–185. doi: 10.1146/annurev-med-042909-093734. - DOI - PMC - PubMed
    1. Saxena V, Shivakumar P, Sabla G, Mourya R, Chougnet C, Bezerra JA. Dendritic cells regulate natural killer cell activation and epithelial injury in experimental biliary atresia. Sci Transl Med. 2011;3(102):102ra94. - PMC - PubMed
    1. Shivakumar P, Sabla GE, Whitington P, Chougnet CA, Bezerra JA. Neonatal NK cells target the mouse duct epithelium via Nkg2d and drive tissue-specific injury in experimental biliary atresia. J Clin Invest. 2009;119(8):2281–2290. doi: 10.1172/JCI38879. - DOI - PMC - PubMed
    1. Shivakumar P, et al. Effector role of neonatal hepatic CD8+ lymphocytes in epithelial injury and autoimmunity in experimental biliary atresia. Gastroenterology. 2007;133(1):268–277. doi: 10.1053/j.gastro.2007.04.031. - DOI - PMC - PubMed
    1. Mack CL, Tucker RM, Sokol RJ, Kotzin BL. Armed CD4+ Th1 effector cells and activated macrophages participate in bile duct injury in murine biliary atresia. Clin Immunol. 2005;115(2):200–209. doi: 10.1016/j.clim.2005.01.012. - DOI - PMC - PubMed

Publication types

Substances