. 2017 Mar 9;2(5):e90651.
doi: 10.1172/jci.insight.90651.

RCAN1-4 is a thyroid cancer growth and metastasis suppressor

Affiliations

RCAN1-4 is a thyroid cancer growth and metastasis suppressor

Chaojie Wang et al. JCI Insight. .

Abstract

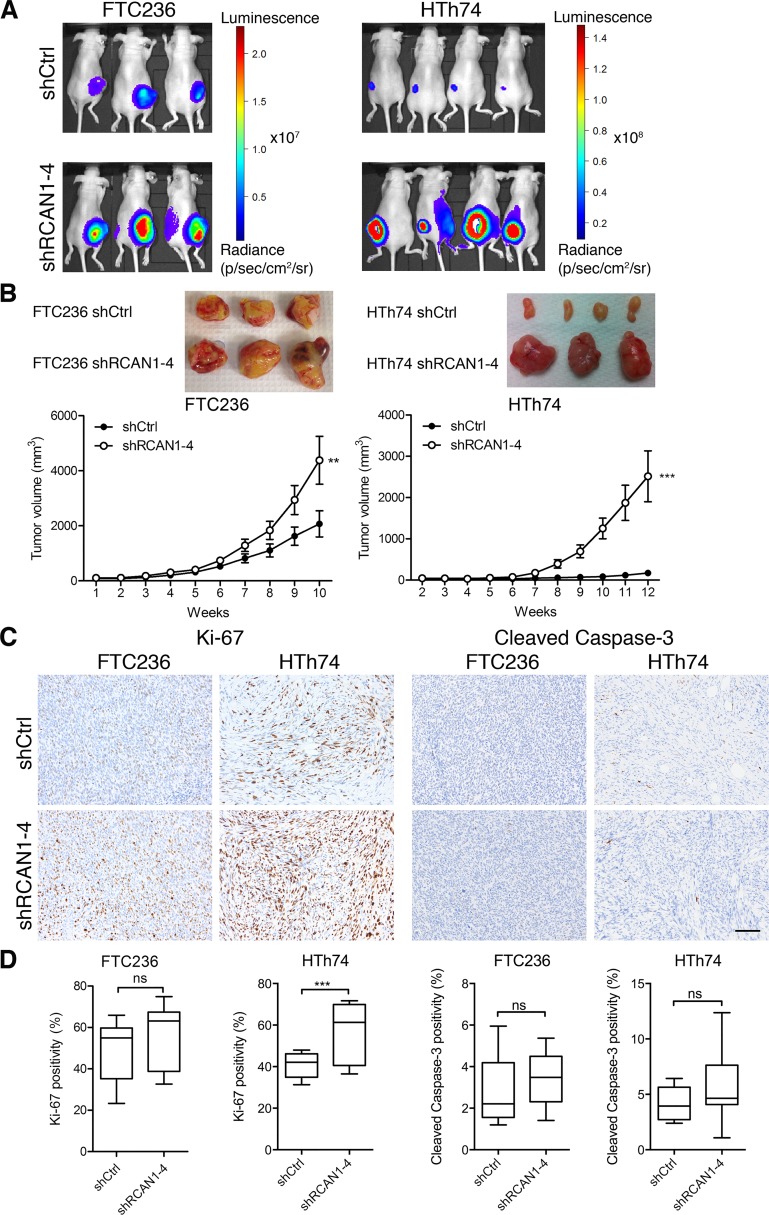
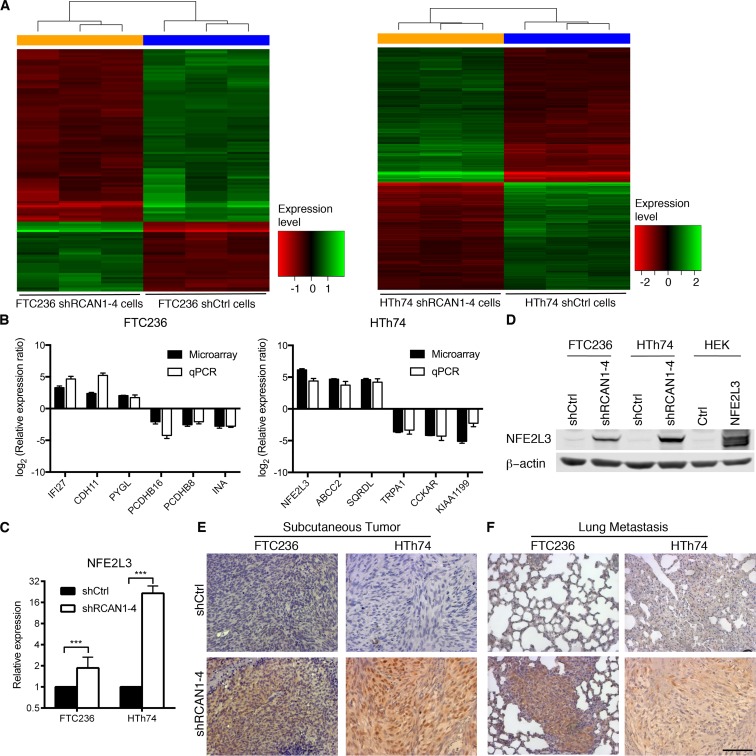
Metastasis suppressors are key regulators of tumor growth, invasion, and metastases. Loss of metastasis suppressors has been associated with aggressive tumor behaviors and metastatic progression. We previously showed that regulator of calcineurin 1, isoform 4 (RCAN1-4) was upregulated by the KiSS1 metastatic suppression pathway and could inhibit cell motility when overexpressed in cancer cells. To test the effects of endogenous RCAN1-4 loss on thyroid cancer in vivo, we developed RCAN1-4 knockdown stable cells. Subcutaneous xenograft models demonstrated that RCAN1-4 knockdown promotes tumor growth. Intravenous metastasis models demonstrated that RCAN1-4 loss promotes tumor metastases to the lungs and their subsequent growth. Finally, stable induction of RCAN1-4 expression reduced thyroid cancer cell growth and invasion. Microarray analysis predicted that nuclear factor, erythroid 2-like 3 (NFE2L3) was a pivotal downstream effector of RCAN1-4. NFE2L3 overexpression was shown to be necessary for RCAN1-4-mediated enhanced growth and invasiveness and NEF2L3 overexpression independently increased cell invasion. In human samples, NFE2L3 was overexpressed in TCGA thyroid cancer samples versus normal tissues and NFE2L3 overexpression was demonstrated in distant metastasis samples from thyroid cancer patients. In conclusion, we provide the first evidence to our knowledge that RCAN1-4 is a growth and metastasis suppressor in vivo and that it functions in part through NFE2L3.


Conflict of interest statement

Conflict of interest: The authors have declared that no conflict of interest exists.

Figures

Figure 1
Figure 1. RCAN1-4 knockdown promotes cell 3D spheroid growth in vitro.
(A) Endogenous RCAN1-4 expression was analyzed by Western blot in 6 established thyroid cancer cell lines stably expressing luciferase. (B) RCAN1-4 knockdown efficiency of shRCAN1-4 stable cells was confirmed using Western blot. (C) Cells were seeded in 6-well plates in triplicate, and viable cells were counted at 24, 48, and 72 hours after seeding. Each data point represents the mean ± standard error of 3 independent experiments. (D) Cells were seeded on Corning spheroid 96-well microplates and incubated for 2 or 3 days for FTC236 and HTh74 cells, respectively. Cell viability was determined; the data were normalized to the corresponding shCtrl cells. Error bars represent SEM. A linear mixed model was used to determine the statistical significance. ***P < 0.001.
Figure 2
Figure 2. RCAN1-4 knockdown promotes cancer cell invasion in vitro.
(A) shCtrl and shRCAN1-4 cells were seeded on Matrigel-coated 8-μm pore invasion membranes and incubated with gradient medium (FTC236: 1% gradient for 24 hours; HTh74: 10% gradient for 36 hours). Representative images of the invaded cells are shown. Scale bar: 100 μm. (B) The number of invaded cells was counted for each image field using ImageJ software. Data represent the mean ± SEM of 3 independent experiments, with 4 fields counted per experiment. A linear mixed model was used to determine the statistical significance. ***P < 0.001.
Figure 3
Figure 3. RCAN1-4 knockdown promotes tumor growth in vivo.
(A) shCtrl and shRCAN1-4 cells (1 × 10⁶) were injected into athymic nude mouse flanks. Tumor size was monitored by IVIS and caliper measurements. Representative bioluminescence images are shown. (B) Top: isolated FTC236 and HTh74 tumors after dissection at the end of the study (10 and 12 weeks, respectively). Bottom: tumor growth curves based on caliper measurements. Each data point is the mean tumor volume ± SEM. (C) Representative images of Ki-67 and cleaved caspase-3 staining for the tumors. Scale bar: 100 μm. (D) Box plots of Ki-67 staining (left) and cleaved caspase-3 staining (right) for the tumors. Ten random fields were quantified and averaged for each animal. The horizontal line in the box represents the median. The box boundaries are the Q1 (25%) and Q3 (75%), respectively. Linear mixed models were used to perform all the statistical analyses (n = 7–9). **P < 0.01, ***P < 0.001.
Figure 4
Figure 4. RCAN1-4 knockdown promotes metastasis.
(A) FTC236 and HTh74 cells with stable shCtrl or shRCAN1-4 expression were injected into athymic nude mice through tail veins. Tumor metastases and growth were monitored using IVIS imaging. Representative images of mouse whole body bioluminescence at 5 weeks for FTC236 cells and 12 weeks for HTh74 cells are shown. (B) Mouse whole body bioluminescence at the end of the study was quantified. Data points represent bioluminescence activity for each individual animal. The horizontal line represents the mean and the error bars represent the SEM (n = 10–14). A linear mixed model was used to determine the statistical significance. ***P < 0.001. (C) Representative images of H&E-stained lungs with metastases (arrows). Scale bar: 100 μm.
Figure 5
Figure 5. RCAN1-4 overexpression suppresses cell spheroid growth and invasion in vitro.
8505c rtTA TRE-RCAN1-4 cells and C643 rtTA TRE-RCAN1-4 cells were treated with control (Ctrl) or 0.5 μg/ml doxycycline (Dox) for 24 hours. (A) Induction of RCAN1-4 expression was analyzed by Western blot in these treated cells. Actin was the loading Ctrl. The induced RCAN1-4 was HA tagged (HA-RCAN1-4). (B) The Dox-treated cells were subjected to spheroid growth assay. 8505c-rtTA and C643-rtTA parental cells were used as a Ctrl for Dox effects on spheroid growth. The data were normalized to the Ctrl-treated cells. (C and D) The Dox-treated cells were subjected to Matrigel invasion assay. The number of invaded cells was counted for each image field. Each dot is a data point. The horizontal line represents the mean and the error bars represent the SEM. The rtTA parental cells treated with Dox also were used as a Ctrl for Dox effects on cell invasion. A linear mixed model was used to determine the statistical significance. ***P < 0.001.
Figure 6
Figure 6. Microarray analysis of stable cell lines.
(A) Heatmaps of the differentially expressed genes for FTC236 shCtrl cells versus shRCAN1-4 cells (left; 118 genes) and HTh74 shCtrl cells versus shRCAN1-4 cells (right; 420 genes). (B) Microarray data were validated by qRT-PCR of genes identified in PCA. The top 3 upregulated genes and top 3 downregulated genes from each cell line were chosen. Data are expressed as the log2 value of the relative expression levels. Error bars represent SEM of biological triplicates. (C) qRT-PCR results for in both cell lines. The HTh74 qRT-PCR plot was from the same data as in B. Bars represent SEM. A linear mixed model was used to determine the statistical significance. ***P < 0.001. (D) Western blot analysis of the NFE2L3 expression level in the stable cells for both cell lines. (E and F) NFE2L3 IHC of the xenograft tumors (E) and lung metastases (F) demonstrated overexpression of NFE2L3 in shRCAN1-4 group. Scale bar: 100 μm.
Figure 7
Figure 7. NEF2L3 knockdown suppresses cell invasion.
(A and B) FTC and HTh74 shRCAN1-4 cells were transfected with either scrambled control siRNA (siCtrl) or NFE2L3 siRNA (siNFE2L3). Knockdown of NFE2L3 was confirmed using qRT-PCR (A) and Western blot (B). (C) The siCtrl-transfected and siNFE2L3-transfected cells were subjected to 3D spheroid growth assay. Cell viability was determined using the CellTiter-Glo 3D Cell Viability Kit. Data were normalized to the siCtrl-transfected cells. (D) Cell invasion images showed that siNFE2L3 transfection decreased cell invasion. Scale bar: 100 μm. (E) The number of invaded cells per field was quantified. Data points represent the number of invaded cells per field. The horizontal line represents the mean and the error bars represent the SEM. Linear mixed models were used to determine the statistical significance. ***P < 0.001.
Figure 8
Figure 8. NFE2L3 overexpression increases cell invasion.
(A) shCtrl cells were transfected with either control plasmid (Ctrl) or NFE2L3 plasmid (pNFE2L3). Western blot probed with NFE2L3 primary antibody demonstrated overexpression of NFE2L3 in both FTC236 and HTh74 cells. HEK 293 (HEK) cells were used as a positive control for transfection. (B) Cells were subjected to Matrigel invasion assay. Representative images of invaded cells are shown. Scale bar: 100 μm. (C) Cells from each field were counted. The experiments were repeated at least 3 times. Four fields were counted per experiment. Results are expressed as mean ± SEM. A linear mixed model was used to determine the statistical significance. ***P < 0.001.
Figure 9
Figure 9. NFE2L3 is overexpressed in thyroid cancer samples.
(A) NFE2L3 expression levels of 59 normal samples (Normal) and 503 papillary thyroid cancer samples (PTC) from TCGA thyroid cohort were plotted. Each point represents one sample. The horizontal lines represent mean ± SEM. (B) NFE2L3 IHC staining was performed using tissue samples collected at The Ohio State University. See Supplemental Table 1 for detailed sample information. The IHC staining was scored blindly by three researchers on a 0–3 scale based on staining intensity. The scores corresponding to normal tissue (Normal), tumor center (Tumor), tumor invasive front (Invasive), and metastatic sites (Metastasis) were plotted. Each data point is one sample. The horizontal lines represent mean ± SEM. (C) Representative IHC images from two cases of FTC demonstrate increasing NFE2L3 expression. Scale bar: 100 μm. For TCGA data (A), 1-way ANOVA was used for analysis. For IHC staining data (B), a linear mixed model was used for analysis and Holm’s procedure was used for controlling multiple comparisons. ***P < 0.001.

Similar articles

Cited by

References

    1. Nguyen DX, Bos PD, Massagué J. Metastasis: from dissemination to organ-specific colonization. Nat Rev Cancer. 2009;9(4):274–284. doi: 10.1038/nrc2622. - DOI - PubMed
    1. Stafford LJ, Vaidya KS, Welch DR. Metastasis suppressors genes in cancer. Int J Biochem Cell Biol. 2008;40(5):874–891. doi: 10.1016/j.biocel.2007.12.016. - DOI - PubMed
    1. Steeg PS, et al. Evidence for a novel gene associated with low tumor metastatic potential. J Natl Cancer Inst. 1988;80(3):200–204. doi: 10.1093/jnci/80.3.200. - DOI - PubMed
    1. Rinker-Schaeffer CW, O’Keefe JP, Welch DR, Theodorescu D. Metastasis suppressor proteins: discovery, molecular mechanisms, and clinical application. Clin Cancer Res. 2006;12(13):3882–3889. doi: 10.1158/1078-0432.CCR-06-1014. - DOI - PMC - PubMed
    1. Ozturk S, et al. SDPR functions as a metastasis suppressor in breast cancer by promoting apoptosis. Proc Natl Acad Sci USA. 2016;113(3):638–643. doi: 10.1073/pnas.1514663113. - DOI - PMC - PubMed

Publication types

MeSH terms