. 2017 Mar 9;2(5):e91127.
doi: 10.1172/jci.insight.91127.

Retinoic-acid-orphan-receptor-C inhibition suppresses Th17 cells and induces thymic aberrations

Affiliations

Retinoic-acid-orphan-receptor-C inhibition suppresses Th17 cells and induces thymic aberrations

Christine Guntermann et al. JCI Insight. .

Abstract

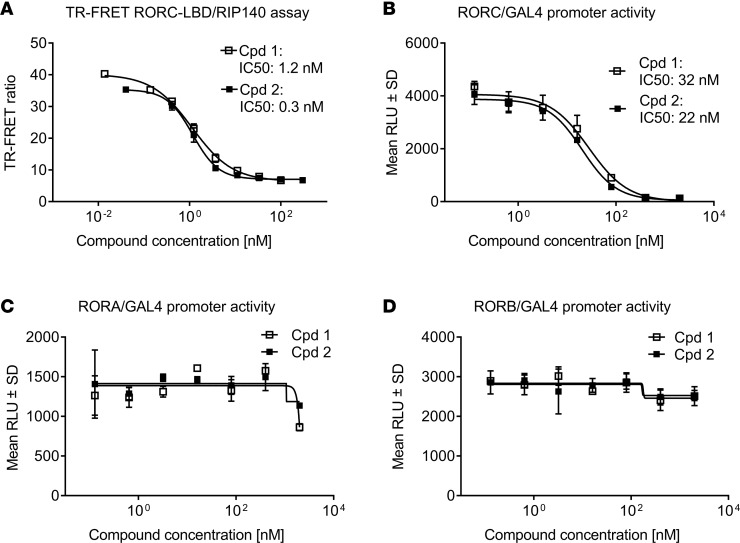
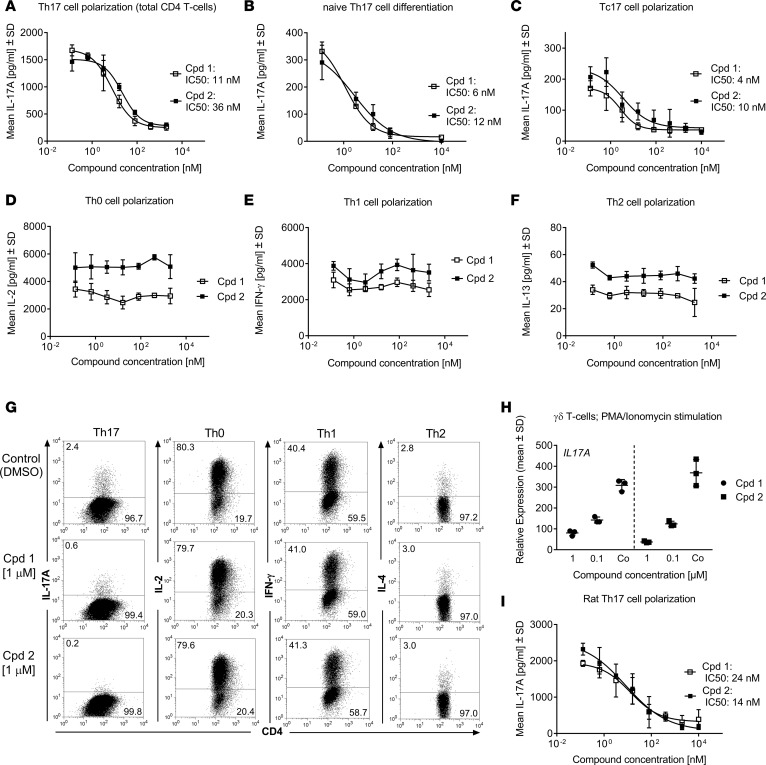
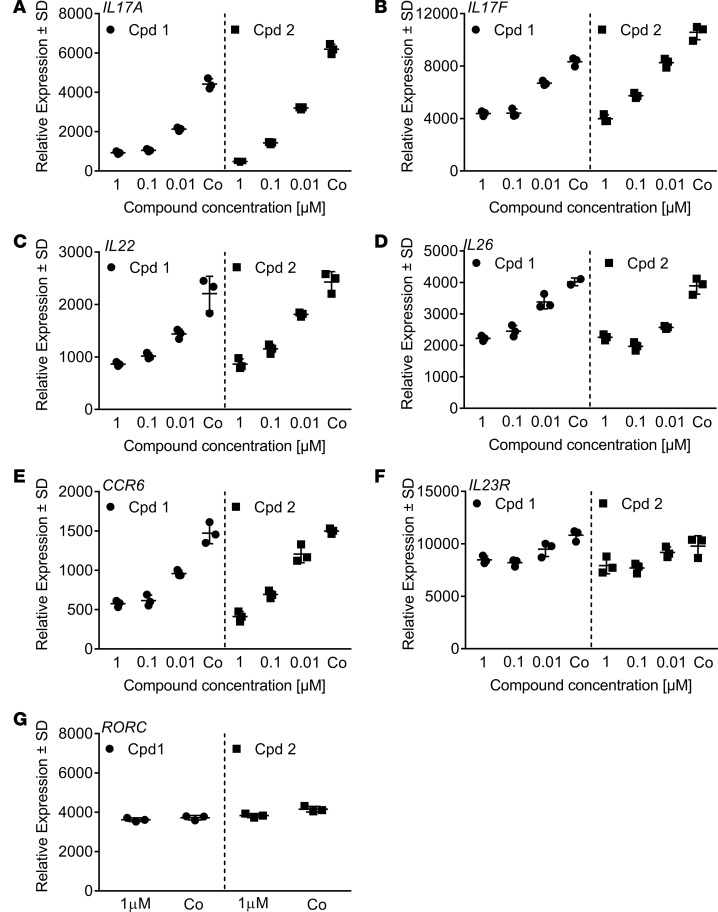
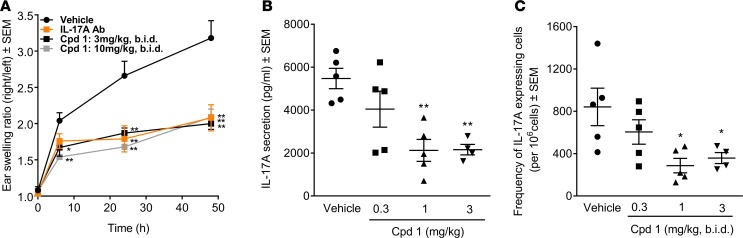
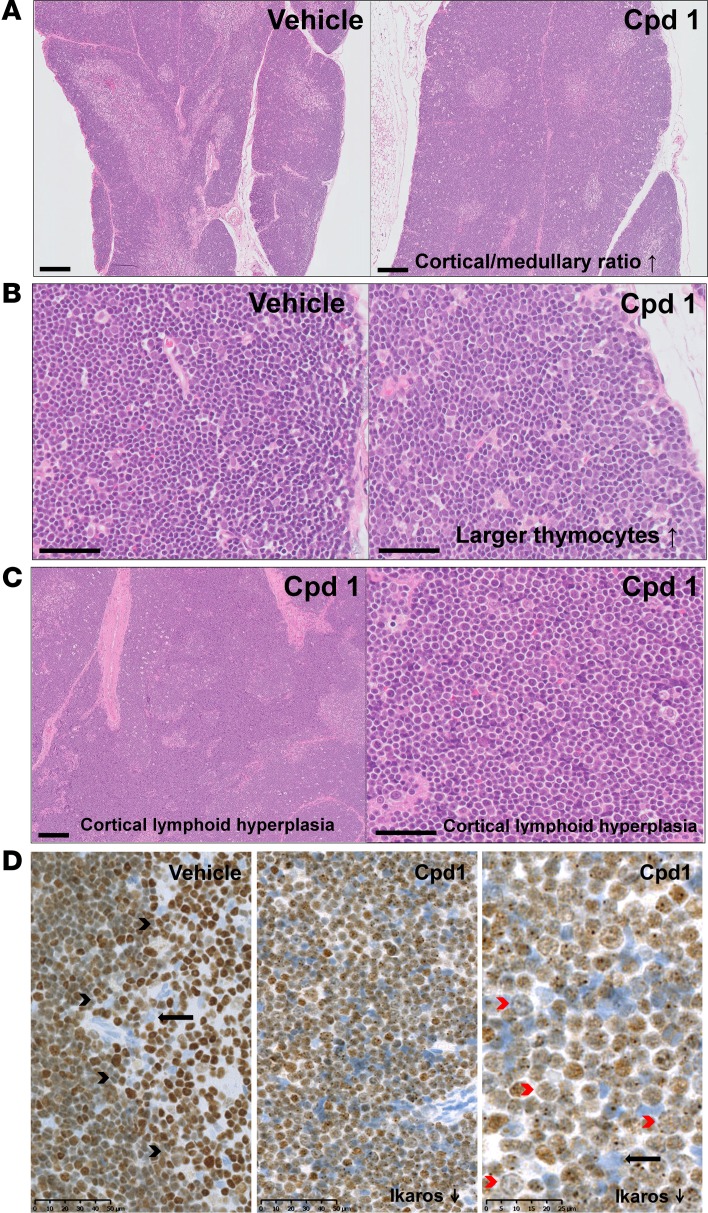
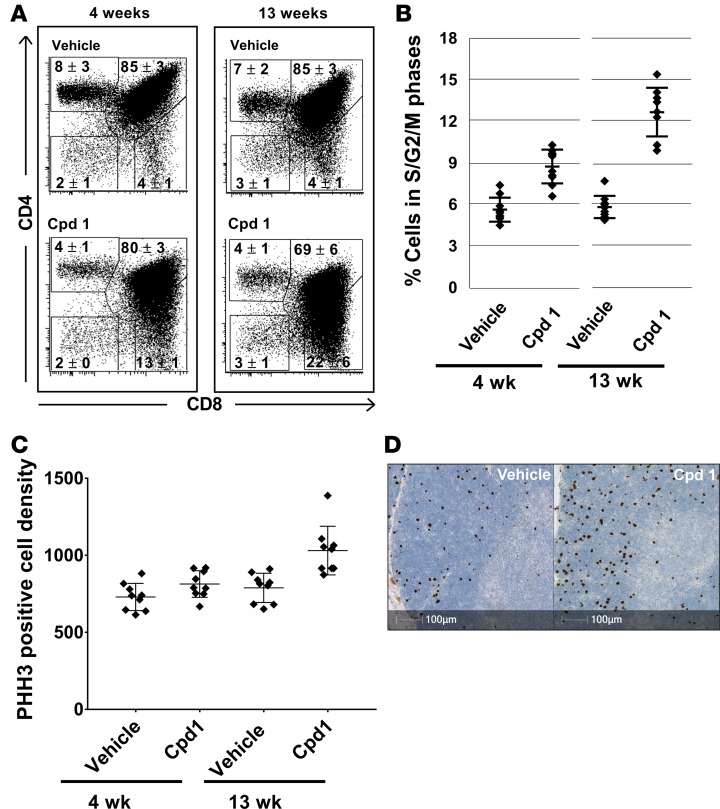
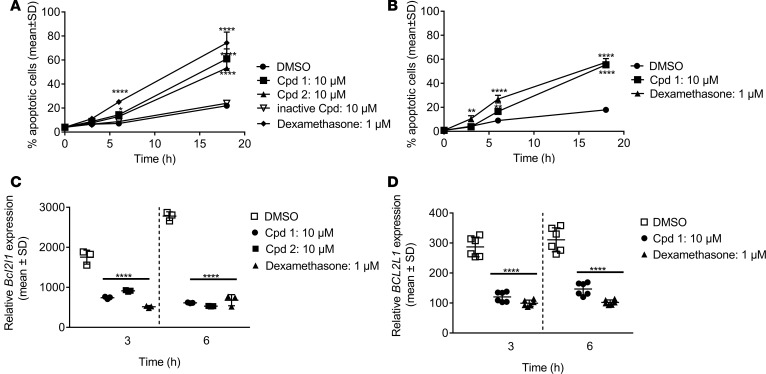
Retinoic-acid-orphan-receptor-C (RORC) is a master regulator of Th17 cells, which are pathogenic in several autoimmune diseases. Genetic Rorc deficiency in mice, while preventing autoimmunity, causes early lethality due to metastatic thymic T cell lymphomas. We sought to determine whether pharmacological RORC inhibition could be an effective and safe therapy for autoimmune diseases by evaluating its effects on Th17 cell functions and intrathymic T cell development. RORC inhibitors effectively inhibited Th17 differentiation and IL-17A production, and delayed-type hypersensitivity reactions. In vitro, RORC inhibitors induced apoptosis, as well as Bcl2l1 and BCL2L1 mRNA downregulation, in mouse and nonhuman primate thymocytes, respectively. Chronic, 13-week RORC inhibitor treatment in rats caused progressive thymic alterations in all analyzed rats similar to those in Rorc-deficient mice prior to T cell lymphoma development. One rat developed thymic cortical hyperplasia with preneoplastic features, including increased mitosis and reduced IKAROS expression, albeit without skewed T cell clonality. In summary, pharmacological inhibition of RORC not only blocks Th17 cell development and related cytokine production, but also recapitulates thymic aberrations seen in Rorc-deficient mice. While RORC inhibition may offer an effective therapeutic principle for Th17-mediated diseases, T cell lymphoma with chronic therapy remains an apparent risk.


Conflict of interest statement

Conflict of interest: MLH works for CiToxLAB performing studies by order of Novartis. ADRE works for Novartis. All other authors work for and own shares or options of Novartis.

Figures

Figure 1
Figure 1. Potency and selectivity of retinoic-acid-orphan-receptor-C (RORC) inhibitors (cpd 1 and cpd 2).
(A) Time resolved Foerster resonance energy transfer (TR-FRET) assay demonstrating concentration-dependent inhibition of RIP140 cofactor displacement from the RORC ligand binding domain (RORC-LBD). Data represent means from duplicate readings from at least 3 independent experiments. (B) Cpds 1 and 2 are potent and selective inhibitors of RORC transcriptional activation in a cellular RORC reporter gene assay. Cpds 1 and 2 did not affect RORA (C) or RORB (D) activity in reporter gene assays. Representative concentration-dependent curves from 3 independent experiments containing triplicate readings are shown. Inhibitory concentrations to achieve 50% of the signal (IC50s) are indicated in the graphs.
Figure 2
Figure 2. Effects of retinoic-acid-orphan-receptor-C (RORC) inhibitors (cpd 1 and cpd 2) on T cells in vitro.
RORC inhibitors (cpd 1 and cpd 2) specifically suppress human Th17 (AB) or Tc17 cell polarization (C), while leaving Th0 (D), Th1 (E), or Th2 (F) signature cytokine production intact. Representative examples of concentration-response curves from 3 experiments with triplicate readings are shown. Total (A) or naive CD4+ (B) or CD8+ (C) T cells derived from blood of human healthy donors were stimulated with anti-CD3 and anti-CD28 antibodies in the presence of Th17-polarizing cytokines for 72 or 96 hours, and IL-17A production was quantified. Alternatively, CD4+ T cells were stimulated with anti-CD3/CD28 only (Th0) (D) and incubated with IL-12 and anti–IL-4 antibody (Th1) (E), or with IL-4 and anti–IFN-γ antibody (Th2) (F). IL-2, IFN-γ, and IL-13 cytokine production by the respective Th subsets was analyzed by ELISA after 48 hours. (G) Human CD4+ T cells were activated under Th17-, Th0-, Th1-, or Th2-polarizing conditions in the presence of RORC inhibitors or DMSO. Production of IL-17A, IL-2, IFN-γ, or IL-4 was analyzed by intracellular staining and flow cytometry. Intracellular cytokines within CD4+ T cell blasts are shown. Data are representative of 2 independent experiments. (H) Human γδ T cells were incubated with RORC inhibitors or DMSO only (Co) and stimulated with PMA/ionomycin for 24 hours. IL17A transcript levels were quantified by RT-PCR. Gene expression was normalized to β-glucuronidase levels and is expressed as arbitrary units. Results are representative of 2 independent experiments. Individual data and mean ± SD from triplicate readings are depicted. (I) CD4+ T cells isolated from splenocytes from male Lewis rats were stimulated with anti-CD3 and anti-CD28 antibodies in the presence of Th17-polarizing cytokines. IL-17A concentrations in supernatants were determined by ELISA. Representative examples of concentration-response curves from 3 experiments with triplicate readings are shown.
Figure 3
Figure 3. Reduced retinoic-acid-orphan-receptor-C–dependent (RORC-dependent) target gene expression by cpds 1 and 2.
CD4+ Th17 cells were treated with compounds (10 nM–1 μM) or with DMSO only (Co) during 72 hours, mRNA was extracted, and transcript levels were quantified by RT-PCR. Gene expression was normalized to β-glucoronidase levels and expressed as arbitrary units. (AG) All graphs are representative of 3 independent experiments. Individual data and mean ± SD from triplicate readings are shown. The DMSO control shown in the cpd 1 panel in D consisted of 2 readings.
Figure 4
Figure 4. Impaired methylated BSA–induced (mBSA-induced) delayed-type hypersensitivity (DTH) responses in female Lewis rats by the retinoic-acid-orphan-receptor-C (RORC) inhibitor cpd 1.
Rats were immunized with mBSA/CFA. Two weeks later, the right ears of the animals were challenged with mBSA, while the left ears were treated with vehicle (5% glucose). Immediately prior to challenge, bis in die (b.i.d.) dosing of cpd 1 was started at the indicated doses and continued until the end of the studies. (A) Ear swelling was monitored for 48 hours. An IL-17A–specific antibody (10 mg/kg s.c. dosed 1 day before mBSA challenge) was used as a reference in another group of rats. The mean ± SEM of the thickness ratios between mBSA-challenged and vehicle-treated ears are shown (n = 5). Cpd 1 blood concentration 2 hours after the last dosing was 334 and 1,286 nM at 3 and 10 mg/kg b.i.d., respectively. (B and C) Draining lymph node cells were prepared 48 hours after mBSA challenge and stimulated ex vivo with mBSA. (B) IL-17A concentration in supernatants and (C) frequencies of IL-17A–secreting cells were quantified by ELISA and ELISpot after 72 and 24 hours, respectively. Individual data and mean ± SEM are depicted (n = 4–5). Cpd 1 concentrations in the draining lymph nodes 2 hours after the last dosing were 104, 353, and 1,054 nM at 0.3, 1, and 3 mg/kg b.i.d., respectively. *P < 0.05; **P < 0.01; Dunnett’s test.
Figure 5
Figure 5. Histopathological analysis of thymic alterations in rats treated with retinoic-acid-orphan-receptor-C (RORC) inhibitor cpd 1 for 13 weeks compared with vehicle control.
(A) Subgross view of H&E-stained sections of thymus from vehicle- (left) or cpd 1–treated (right) rats. Cpd 1–induced increase in thymic cortical/medullary ratio (scale bar: 200 μm). (B) Higher magnification showing the cpd 1–induced increase of relative presence of larger thymocytes in cpd 1–treated (right) compared with vehicle-treated (left) rat (scale bar: 40 μm). (C) H&E-stained section of thymus from cpd 1–treated rat showing cortical lymphoid hyperplasia. Subgross view revealed that the normal cortico-medullary demarcation was focally lost (left, scale bar: 200 μm) and a monomorphic population of large round cells was present (right, scale bar: 50 μm). (D) IKAROS expression in thymus from vehicle- (left) or cpd 1–treated rat showing cortical lymphoid hyperplasia (middle and right). IKAROS expression was reduced in the cortical hyperplastic area. Black arrowheads point to cortical-medullary demarcation, red arrowheads point to lymphoid cells that lost IKAROS, and arrows point to unstained epitheloid cell. n = 9–10.
Figure 6
Figure 6. Thymocyte changes in rats treated with retinoic-acid-orphan-receptor-C (RORC) inhibitor cpd 1 for 4 and 13 weeks.
(A) Inhibition of RORC in rats causes reduced CD4 expression levels on CD4+CD8+ double-positive thymocytes resulting in increased frequencies of CD8+ single-positive thymocytes. Thymocytes prepared from rats treated with vehicle or cpd 1 for 4 and 13 weeks were stained with fluorochrome-labeled antibodies against CD4 and CD8 and analyzed by flow cytometry. Representative cytograms are shown (n = 9–10). Average frequencies ± SD for the cell populations defined by the shown regions are indicated. (B) Inhibition of RORC in rats causes increased frequencies of thymocytes in the S/G2/M cell cycle phases. Thymocytes prepared from rats treated with vehicle or cpd 1 for 4 and 13 weeks were fixed, stained with propidium iodide, and analyzed by flow cytometry. Individual data and mean ± SD are depicted (n = 9–10). (C and D) Inhibition of RORC in rats causes increased thymocyte mitosis, mostly in the cortical areas. Thymus sections from rats treated with vehicle or cpd 1 for 4 and 13 weeks were stained by IHC with an antibody against phosphohistone H3 (PHH3) and counterstained with Hematoxylin II and Bluing agent. The result of a digital quantitative analysis is shown in C (unit cells/mm2; individual data and mean ± SD are depicted; n = 9–10). Representative stainings of thymus sections from rats treated with vehicle or cpd 1 for 13 weeks are shown in D.
Figure 7
Figure 7. Inhibition of retinoic-acid-orphan-receptor-C (RORC) accelerates spontaneous apoptosis in mouse and cynomolgus monkey thymocytes in vitro.
Freshly isolated thymocytes from C57BL/6 mice (A and C) or cynomolgus monkey (B and D) were cultured either without addition of compound or in the presence of RORC inhibitors or dexamethasone for up to 18 hours. (A and B) At different time intervals, cells were analyzed for Annexin V binding by flow cytometry. The percentage of CD4+CD8+ double-positive thymocytes that underwent apoptosis induced by the RORC inhibitors was calculated and plotted. (C and D) Following 3 and 6 hours incubation time, cells were analyzed for (C) Bcl2l1 or (D) BCL2L1 mRNA expression by qPCR. Representative examples of (C) triplicate readings from 3 mice or (D) triplicate readings of assay duplicates from 1 cynomolgus monkey are shown. Individual data and means ± SD are depicted. *P < 0.05; **P < 0.01; ****P < 0.0001; Dunnett’s test.

References

    1. Jetten AM. Retinoid-related orphan receptors (RORs): critical roles in development, immunity, circadian rhythm, and cellular metabolism. Nucl Recept Signal. 2009;7:e003. - PMC - PubMed
    1. Huh JR, Littman DR. Small molecule inhibitors of RORγt: targeting Th17 cells and other applications. Eur J Immunol. 2012;42(9):2232–2237. doi: 10.1002/eji.201242740. - DOI - PMC - PubMed
    1. Kojetin DJ, Burris TP. REV-ERB and ROR nuclear receptors as drug targets. Nat Rev Drug Discov. 2014;13(3):197–216. doi: 10.1038/nrd4100. - DOI - PMC - PubMed
    1. Xiao S, et al. Small-molecule RORγt antagonists inhibit T helper 17 cell transcriptional network by divergent mechanisms. Immunity. 2014;40(4):477–489. doi: 10.1016/j.immuni.2014.04.004. - DOI - PMC - PubMed
    1. Skepner J, et al. Pharmacologic inhibition of RORγt regulates Th17 signature gene expression and suppresses cutaneous inflammation in vivo. J Immunol. 2014;192(6):2564–2575. doi: 10.4049/jimmunol.1302190. - DOI - PubMed

Publication types

Substances