Case Reports
. 2017 Mar 9;2(5):e91225.
doi: 10.1172/jci.insight.91225.

Elucidation of MRAS-mediated Noonan syndrome with cardiac hypertrophy

Affiliations
Case Reports

Elucidation of MRAS-mediated Noonan syndrome with cardiac hypertrophy

Erin M Higgins et al. JCI Insight. .

Abstract

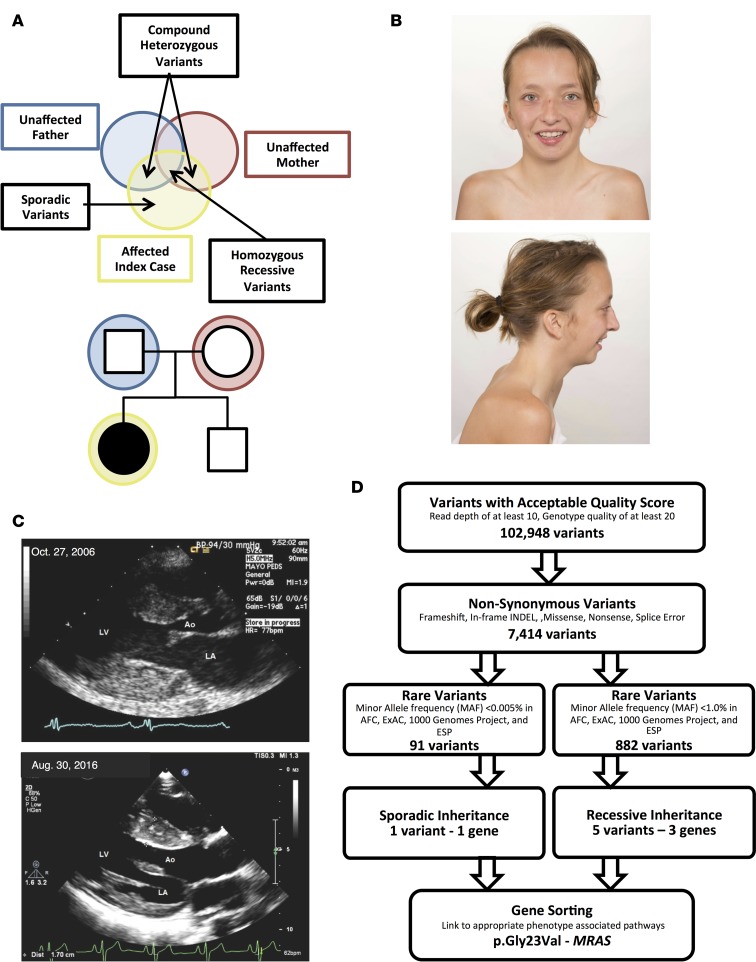
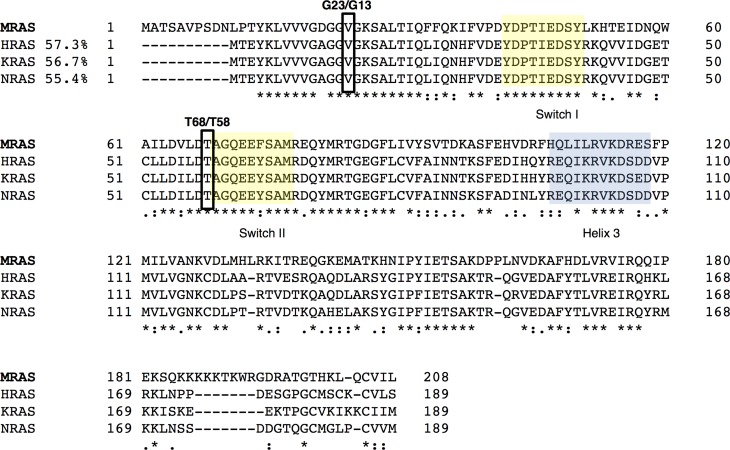
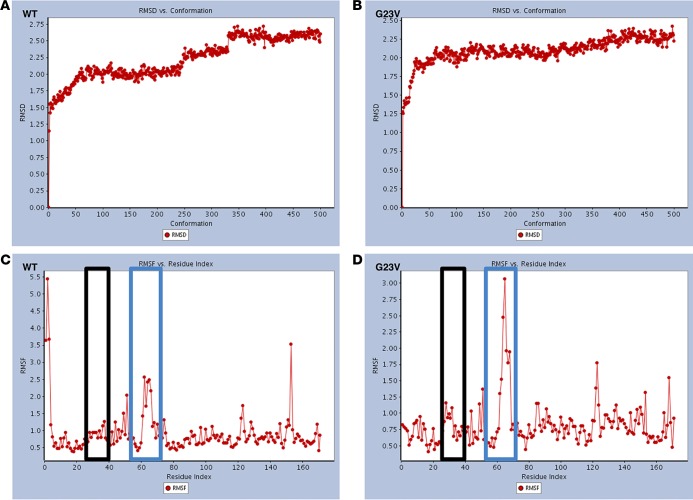
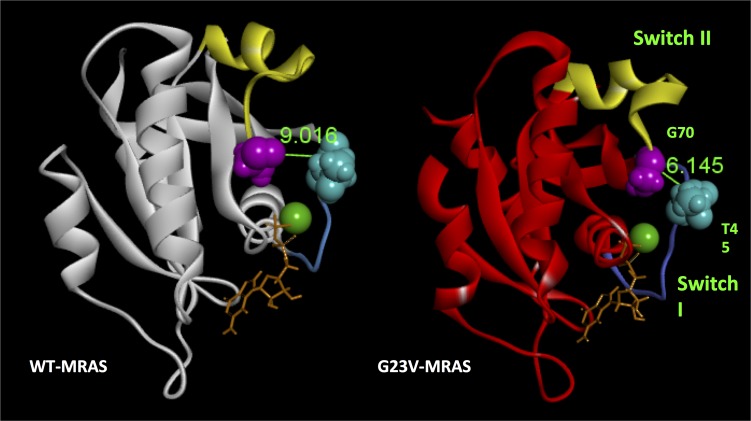
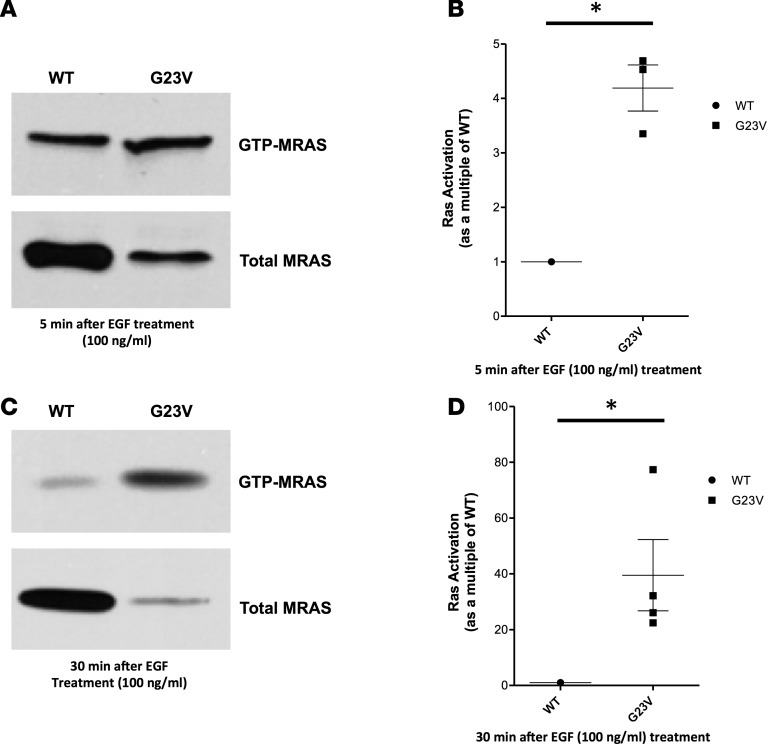
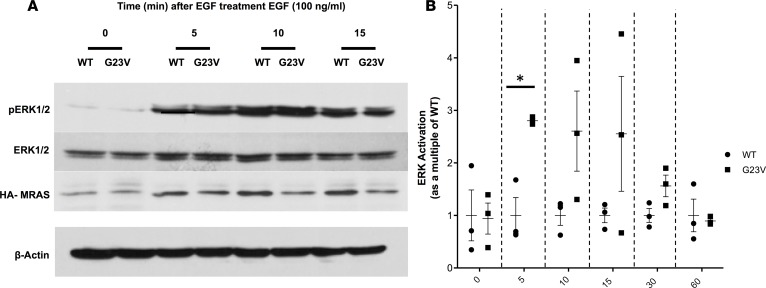
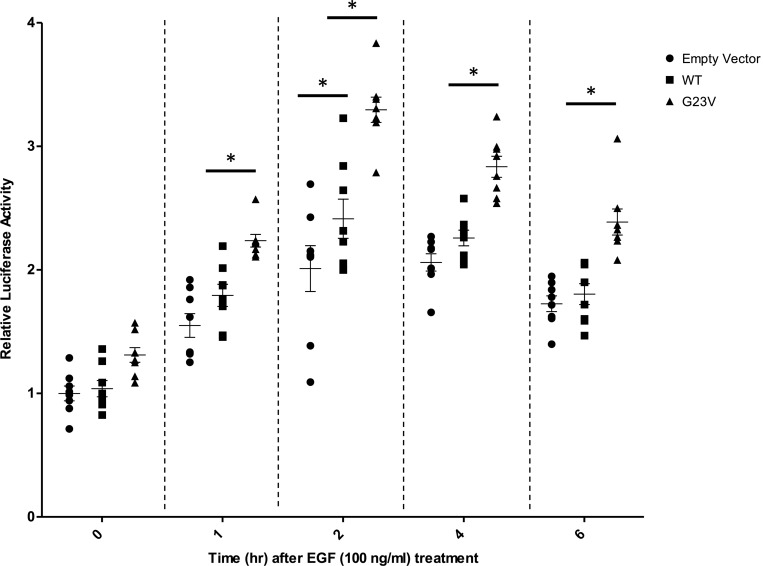
Noonan syndrome (NS; MIM 163950) is an autosomal dominant disorder and a member of a family of developmental disorders termed "RASopathies," which are caused mainly by gain-of-function mutations in genes encoding RAS/MAPK signaling pathway proteins. Whole exome sequencing (WES) and trio-based genomic triangulation of a 15-year-old female with a clinical diagnosis of NS and concomitant cardiac hypertrophy and her unaffected parents identified a de novo variant in MRAS-encoded RAS-related protein 3 as the cause of her disease. Mutation analysis using in silico mutation prediction tools and molecular dynamics simulations predicted the identified variant, p.Gly23Val-MRAS, to be damaging to normal protein function and adversely affect effector interaction regions and the GTP-binding site. Subsequent ectopic expression experiments revealed a 40-fold increase in MRAS activation for p.Gly23Val-MRAS compared with WT-MRAS. Additional biochemical assays demonstrated enhanced activation of both RAS/MAPK pathway signaling and downstream gene expression in cells expressing p.Gly23Val-MRAS. Mutational analysis of MRAS in a cohort of 109 unrelated patients with phenotype-positive/genotype-negative NS and cardiac hypertrophy yielded another patient with a sporadic de novo MRAS variant (p.Thr68Ile, c.203C>T). Herein, we describe the discovery of mutations in MRAS in patients with NS and cardiac hypertrophy, establishing MRAS as the newest NS with cardiac hypertrophy-susceptibility gene.


Conflict of interest statement

Conflict of interest: D.J. Tester and M.J. Ackerman receive royalties from Transgenomic for the FAMILION genetic tests. M.J. Ackerman is a consultant for or is on the advisory board of Boston Scientific, Gilead Sciences, Invitae, Medtronic, MyoKardia, and St. Jude Medical.

Figures

Figure 1
Figure 1. Whole exome sequencing and familial genomic triangulation for the elucidation of a genetic substrate for Noonan syndrome.
(A) Noonan syndrome pedigree with presumed sporadic or autosomal recessive (compound heterozygous or homozygous) inheritance pattern showing the case-parent trio with the affected index case (black circle) and unaffected family members (white symbols). (B) Clinical appearance of the patient at 17 years old, showing facial characteristics of Noonan syndrome, such as long facies and low-set posteriorly rotated ears. Images were obtained and published with both patient’s and parents’ permission. (C) Parasternal long-axis view of the index case’s echocardiogram performed at age 8 (October 27, 2006) and age 17 (August 30, 2016). The echocardiogram shows left ventricular hypertrophy with maximal septal thickness of 18 and 17 mm for these 2 echocardiograms, respectively (Ao, aorta; LA, left atrium; LV, left ventricle). (D) A flow diagram of the variant filtering process following whole exome sequencing, and results for both a sporadic and autosomal recessive inheritance model.
Figure 2
Figure 2. Multiple sequence alignment of MRAS in comparison with HRAS, KRAS, and NRAS paralogs.
Multiple sequence alignment was performed using T-COFFEE as previously described (62). Note that, in spite of differences in the sequence among these proteins (HRAS: 57.3%; NRAS: 56.7%; KRAS: 55.4%), the regions corresponding to the switch I and II and helix 3, which are critical for the activation of these proteins, are highly conserved. Additionally, sequence alignment demonstrated that the MRAS variants aligned to critical and conserved regions, matching previously identified disease-associated variants in one or more of the MRAS paralogs.
Figure 3
Figure 3. Root-mean-square deviation and root-mean-square fluctuation values of both WT-MRAS and p.Gly23Val-MRAS during the molecular dynamic simulations.
(A and B) Root-mean-square deviation (RMSD) values for WT-MRAS (A) and p.Gly23Val-MRAS (B). (C and D) Root-mean-square fluctuation (RMSF) values for WT-MRAS (C) and p.Gly23Val-MRAS (D) are used here as a measure of the flexibility of different regions of the protein during the 20-ns molecular dynamic simulations (MDS). The black boxes represent the switch I region and the blue boxes represent the switch II region. The dynamics of these regions are critical for the transition from state I to state II.
Figure 4
Figure 4. Changes of the switch region and remodeling of the active site of p.Gly23Val-MRAS after molecular dynamic simulations.
WT-MRAS (white) and p.Gly23Val-MRAS (red) variants are shown after 20-ns molecular dynamic simulations. Mutation-associated remodeling of the switch I and switch II regions as well as the nucleotide-binding site are noticeable by comparison. This missense mutation results in a marked attenuation of the distance between the T45 and G70 residues by 2.871A, resulting in these two residues being brought closer to the phosphate groups of the bound nucleotide and the magnesium ion.
Figure 5
Figure 5. Ras activation assay.
Full-length, hemaglutinin-tagged (HA-tagged) WT-MRAS or p.Gly23Val-MRAS was expressed in HEK293T/17 cells. Cells were stimulated with EGF (100 ng/ml) for either 5 or 30 minutes. Cells were collected in 1× Mg2+ Lysis/Wash Buffer (MLB), and active MRAS was pulled down by incubation of cell lysates with GST-Raf–Ras-binding domain (GST-Raf-RBD) prebound to glutathione sepharose. Following resuspension of beads in 4× Laemmli sample buffer, bound proteins were subjected to electrophoresis and blotted with an anti-HA tag antibody. (A) Total MRAS, detected immunologically with anti-HA in the whole-cell lysates collected from cells treated with EGF (100 ng/ml) for 5 minutes, and activated MRAS, detected immunologically with anti-HA. Immunoblots are representative for 3 independent experiments. (B) MRAS activation as a multiple of WT-MRAS activation 5 minutes after EGF (100 ng/ml) treatment. p.Gly23Val-MRAS precipitated a 4-fold increase (SD: 0.73, SEM: 0.42) in GTP loading compared with cells transfected with WT-MRAS. Data are presented as mean ± SEM. n = 3 per group. *P < 0.05 by 2-tailed Student’s t test. (C) Total MRAS, detected immunologically with anti-HA in the whole-cell lysates collected from cells treated with EGF (100 ng/ml) for 30 minutes, and activated MRAS, detected immunologically with anti-HA. Immunoblots are representative for 3 independent experiments. (D) MRAS activation as a multiple of WT-MRAS activation 30 minutes after after EGF (100 ng/ml) treatment. p.Gly23Val-MRAS precipitated a 40-fold increase (SD: 25.53, SEM: 12.77) in GTP loading compared with cells transfected with WT-MRAS. Data are presented as mean ± SEM. n = 4 per group. *P < 0.05 by 2-tailed Student’s t test.
Figure 6
Figure 6. ERK activation assay.
Full-length, hemaglutinin-tagged (HA-tagged) WT-MRAS or p.Gly23Val-MRAS was expressed in HEK293T/17 cells. Serum-starved cells were stimulated with EGF (100 ng/ml) and collected in 4× Laemmli sample buffer. Following sonication of the cell lysates, proteins were subjected to electrophoresis and blotted with the indicated antibody. The fraction of ERK that was phosphorylated was calculated for each sample at each time point. (A) Representative immunoblots for 3 independent experiments. (B) ERK activation in cells transfected with p.Gly23Val-MRAS as a multiple of ERK activation in cells transfected with WT-MRAS and normalized for MRAS expression. ERK activation for p.Gly23Val-MRAS–expressing cells was calculated as a multiple of ERK activation in WT-MRAS–expressing cells from 3 separate experiments and demonstrated that the phosphorylation of ERK was accentuated significantly in cells transfected with p.Gly23Val-MRAS 5 minutes after EGF stimulation (P = 0.006). Overall, ERK activation remained lower in cells expressing WT-MRAS compared with p.Gly23Val-MRAS for the remainder of the time course; however, this difference was not statistically significant (10 minutes: P = 0.1; 15 minutes: P = 0.2; 30 minutes: P = 0.08; 60 minutes: P = 0.8). Data are presented as mean ± SEM. n = 3 per group. *P < 0.0083 by 2-tailed Student’s t test with Bonferroni multiple-significance-test correction.
Figure 7
Figure 7. Serum response element reporter assay.
Full-length, hemaglutinin-tagged WT-MRAS or p.Gly23Val-MRAS was coexpressed in MEF cells along with the serum response element reporter plasmid. Serum-starved cells were stimulated with EGF (100 ng/ml) for the indicated time intervals and collected in 1X passive lysis buffer (PLB). The luciferase activity was measured and normalized to protein concentration, as measured by bicinchoninic acid assay. Luciferase activity was calculated relative to the empty vector construct from 4 independent experiments. While there was a significant difference between cells expressing WT-MRAS compared with cells transfected with an empty vector only at the 2-hour time point (P < 0.01), luciferase expression was significantly higher (P < 0.01) at all but the 0-hour time point in cells transfected with p.Gly23Val-MRAS. Data are presented as mean ± SEM. n = 8 per group. *P < 0.01 by 2-way ANOVA with Tukey’s multiple comparison test.

References

    1. Mendez HM, Opitz JM. Noonan syndrome: a review. Am J Med Genet. 1985;21(3):493–506. doi: 10.1002/ajmg.1320210312. - DOI - PubMed
    1. Allanson JE. Noonan syndrome. J Med Genet. 1987;24(1):9–13. doi: 10.1136/jmg.24.1.9. - DOI - PMC - PubMed
    1. Noonan JA. Hypertelorism with Turner phenotype. A new syndrome with associated congenital heart disease. Am J Dis Child. 1968;116(4):373–380. doi: 10.1001/archpedi.1968.02100020377005. - DOI - PubMed
    1. Burch M, Sharland M, Shinebourne E, Smith G, Patton M, McKenna W. Cardiologic abnormalities in Noonan syndrome: phenotypic diagnosis and echocardiographic assessment of 118 patients. J Am Coll Cardiol. 1993;22(4):1189–1192. doi: 10.1016/0735-1097(93)90436-5. - DOI - PubMed
    1. Prendiville TW, et al. Cardiovascular disease in Noonan syndrome. Arch Dis Child. 2014;99(7):629–634. doi: 10.1136/archdischild-2013-305047. - DOI - PubMed

Publication types