Review
. 2017 Mar 28;11(3):2313-2381.
doi: 10.1021/acsnano.6b06040. Epub 2017 Mar 14.

Diverse Applications of Nanomedicine

Beatriz PelazChristoph Alexiou  1 Ramon A Alvarez-Puebla  2   3 Frauke Alves  4 Anne M AndrewsSumaira AshrafLajos P Balogh  5 Laura Ballerini  6 Alessandra Bestetti  7 Cornelia BrendelSusanna Bosi  8 Monica Carril  9   10 Warren C W Chan  11 Chunying Chen  12 Xiaodong Chen  13 Xiaoyuan Chen  14 Zhen Cheng  15 Daxiang Cui  16 Jianzhong Du  17 Christian DullinAlberto Escudero  18 Neus Feliu  19 Mingyuan Gao  20 Michael George  21 Yury Gogotsi  22 Arnold GrünwellerZhongwei Gu  23 Naomi J Halas  24 Norbert HamppRoland K HartmannMark C Hersam  25 Patrick Hunziker  26   27 Ji JianXingyu Jiang  12 Philipp Jungebluth  28 Pranav Kadhiresan  11 Kazunori Kataoka  29 Ali Khademhosseini  30 Jindřich Kopeček  31 Nicholas A Kotov  32 Harald F Krug  33 Dong Soo LeeClaus-Michael Lehr  34   35 Kam W Leong  36 Xing-Jie Liang  12   37 Mei Ling Lim  19 Luis M Liz-Marzán  9   10   38 Xiaowei Ma  37 Paolo Macchiarini  39 Huan MengHelmuth Möhwald  40 Paul Mulvaney  7 Andre E NelShuming Nie  41 Peter Nordlander  24 Teruo Okano  42 Jose Oliveira  43 Tai Hyun Park  44 Reginald M Penner  45 Maurizio Prato  8   9   10 Victor Puntes  3   46   47 Vincent M Rotello  48 Amila Samarakoon  11 Raymond E Schaak  49 Youqing ShenSebastian Sjöqvist  19 Andre G Skirtach  40   50 Mahmoud G SolimanMolly M Stevens  51 Hsing-Wen Sung  52 Ben Zhong Tang  53 Rainer Tietze  1 Buddhisha N Udugama  11 J Scott VanEpps  32 Tanja Weil  54   55 Paul S WeissItamar Willner  56 Yuzhou Wu  55   57 Lily Yang  43 Zhao YueQian ZhangQiang Zhang  58 Xian-En Zhang  59 Yuliang Zhao  12 Xin Zhou  60 Wolfgang J Parak  9
Affiliations
Review

Diverse Applications of Nanomedicine

Beatriz Pelaz et al. ACS Nano. .

Abstract

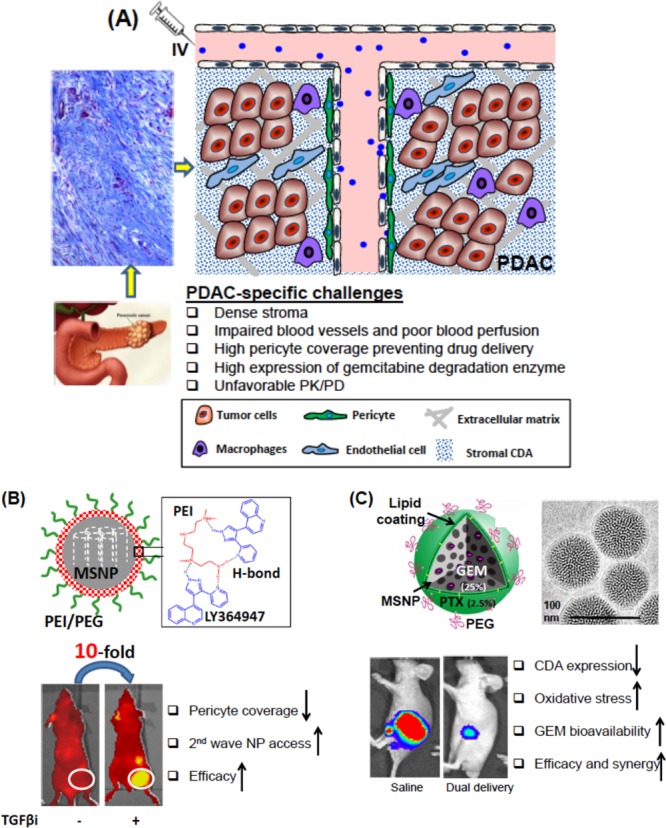
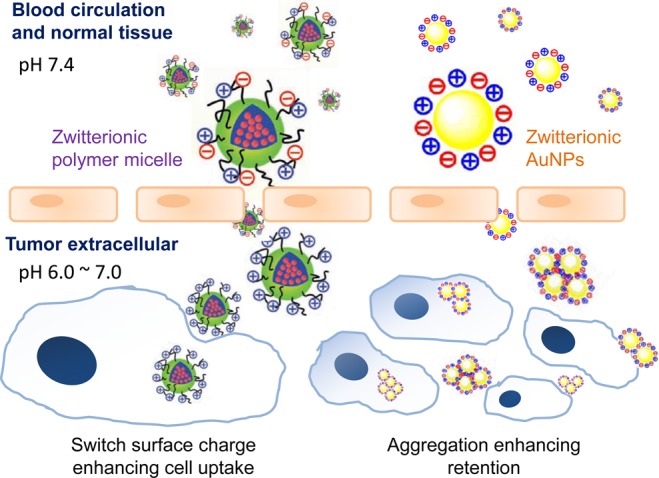
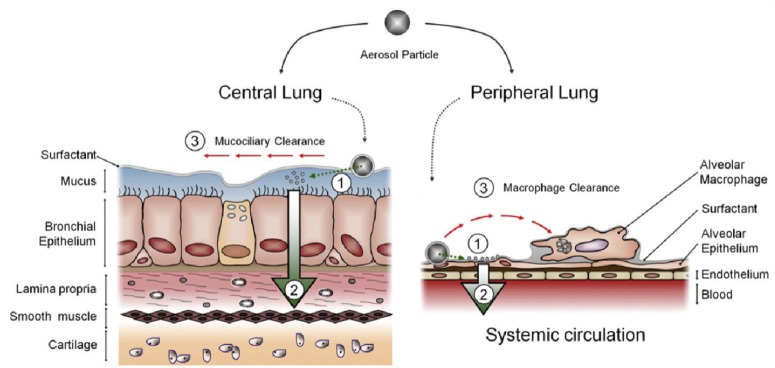
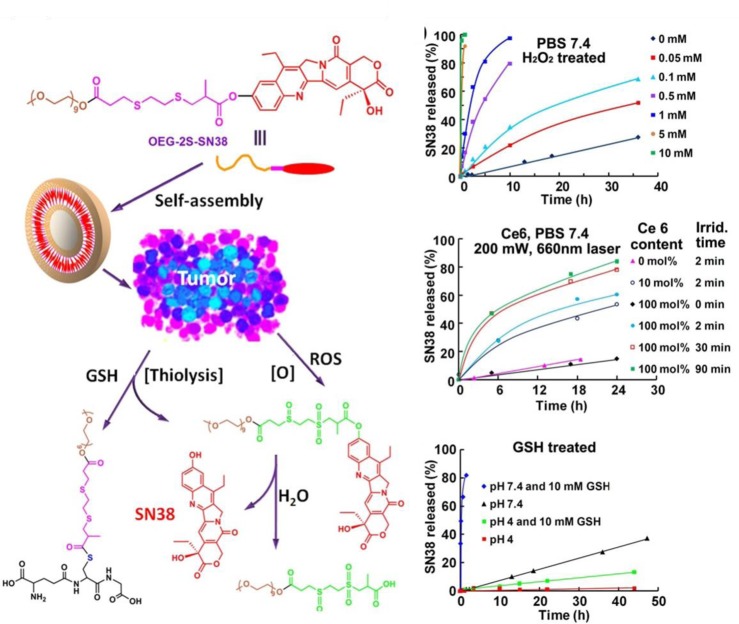
The design and use of materials in the nanoscale size range for addressing medical and health-related issues continues to receive increasing interest. Research in nanomedicine spans a multitude of areas, including drug delivery, vaccine development, antibacterial, diagnosis and imaging tools, wearable devices, implants, high-throughput screening platforms, etc. using biological, nonbiological, biomimetic, or hybrid materials. Many of these developments are starting to be translated into viable clinical products. Here, we provide an overview of recent developments in nanomedicine and highlight the current challenges and upcoming opportunities for the field and translation to the clinic.


Conflict of interest statement

The authors declare no competing financial interest.

Figures

Figure 1
Figure 1
(I) In vitro CT images of (a) lanthanide-doped NaGdF4 upconversion “nanoclusters” (<5 nm) suspended in aqueous solution. (b) CT attenuation plot (given in Hounsfield units, HU) of NaGdF4 NPs in dependence of the concentration of each sample from 0.2 to 10 mg/mL to further investigate the CT contrast effect. (II) Images of a control group before injection of NPs: (c) photograph of a nude mouse loaded with gastric cancer MGC-803 cells; (d) X-ray image, and (e–g) CT images of nude mice from the control group. (III) (h–k) CT images and (IV) (l–n) MRI images of mice after intravenous injection with NaGdF4 UCNPs, making use of passive targeting (EPR effect). The pulse sequence: electromagnetic conversion (EC) = 1/141.7 kHz; repetition time (TR time) = 2000; echo time (TE time) = 65.6/Ef (echo frequency). Parameters of transverse plane: the pulse sequence, EC = 1/141.7 kHz; TR time = 2000; TE time = 43.8/Ef. It took about 6 h to acquire one image. The relaxivity value of NaGdF4 UCNPs at 1.5 T is about 4.5 mMs–1. Adapted with permission from ref (43). Copyright 2015 Royal Society of Chemistry.
Figure 2
Figure 2
Three-dimensional localization of labeled macrophages in a 500 μm thick lung section of a healthy mouse, scanned by holotomography. Three orthogonally oriented slices are shown, together with automatically labeled barium clusters (green), representing macrophages loaded with barium sulfate and alveolar walls in a small region of interest (ROI, yellow). A part of a blood vessel has been marked semi automatically (purple). Adapted with permission from ref (50). Copyright 2015 Nature Publishing Group.
Figure 3
Figure 3
Illustration of multifunctional asymmetrical polymer vesicles for ultrasensitive T1 MRI and effective cancer targeted drug delivery. Adapted from ref (69). Copyright 2015 American Chemical Society.
Figure 4
Figure 4
(A) Synthesis of AuNPs capped with folic acid and 19F contrast agent. Folic acid with a high tumor affinity due to the overexpression of its receptors on the cancer cells was conjugated onto the surface of the AuNPs. 19F contrast agent was covalently conjugated onto the AuNPs via acid-labile hydrazone linkers. (B) pH-triggered release of the 19F contrast agent from the AuNPs to the cytosol via the selective removal of the pH-labile cap in the acidic intracellular compartments of cancer cells. Adapted with permission from ref (82). Copyright 2014 Royal Society of Chemistry.
Figure 5
Figure 5
Design of redox activatable NPs. Adapted with permission from ref (86). Copyright 2015 Wiley-VCH Verlag GmbH & Co.
Figure 6
Figure 6
(A) Schematic model of a 5 nm ND with a fluorescent NV center and a variety of surface terminations after oxidative purification is shown. The diamond core is covered by a layer of surface functional groups that stabilize the NP by terminating its dangling bonds. The surface can also be stabilized by the conversion of sp3 carbon to sp2 carbon. Adapted with permission from ref (118). Copyright 2012 Nature Publishing Group. (B) Plot showing the strength of binding (KL) versus the monolayer capacity (Amax) based on a Langmuir model for DOX, polymyxin B, tetracycline, and vancomycin adsorbed on detonation-produced ND from two sources (ZH and ND) with different surface chemistries: the as-received surface, like in the right picture, carboxylated (−COOH) and aminated (−NH2) surfaces. Adapted with permission from refs ( and 126). Copyright 2016 Elsevier and copyright 2013 American Chemical Society, respectively.
Figure 7
Figure 7
Diagrammatic illustration of the real-time monitoring of cell apoptosis process by DEVDK-TPE, an AIE-active fluorescent bioprobe. Adapted from ref (131). Copyright 2012 American Chemical Society.
Figure 8
Figure 8
Illustration of μWB and multiplexed cLAMP carried out in a variety of forms by means of microcapillaries. (A) Proteins are transferred from a polyacrylamide gel to a polyvinylidene fluoride (PVDF) membrane by electroblotting. (B) μWB chip is assembled by incorporating a polydimethylsiloxane (PDMS) microfluidic network with the blotted PVDF membrane. Panels (A) and (B) adapted from ref (153). Copyright 2010 American Chemical Society. (C) Microfluidic channels are oriented perpendicular to the protein bands on the membrane. Antibodies for specific proteins are introduced in parallel microfluidic channels. Adapted from ref (154). Copyright 2014 American Chemical Society.
Figure 9
Figure 9
Multichannel AuNP fluorescent protein sensor, generating different responses for drug-induced phenotypes. Clustering of the mechanisms was performed using linear discriminant analysis, enabling identification of new drugs as “known” or “novel”. Adapted from ref (160). Copyright 2015 Nature Publishing Group.
Figure 10
Figure 10
(A) Dopamine-functionalized QDs for the photoluminescence (PL) sensing of pH via the pH-dependent oxidation of dopamine to the quinone derivative, and the accompanying electron-transfer quenching of the QDs. (B) Differential interference contrast (DIC) and fluorescence confocal imaging of pH-changes in COS-1 cell subjected to internalized pH-responsive dopamine-functionalized QDs (fluorescence at 550 nm) and co-incorporated red fluorescent Fluorophorex (FLX) 20 nm nanospheres acting as an internal strand, emitting at 680 nm. The calibration curve corresponding to the intracellular fluorescence changes derived from the confocal fluorescence images is displayed at the bottom. Adapted with permission from ref (167). Copyright 2010 Nature Publishing Group.
Figure 11
Figure 11
(A) Schematic analysis of NADH using NB+-functionalized CdSe/ZnS QDs. (B) Calibration curve corresponding to the fluorescence changes of the CdSe/ZnS QDs upon analyzing different concentrations of NADH. (C) Time-dependent fluorescence changes observed upon the glucose (50 mM)-stimulated activation of the metabolism in HeLa cancer cells loaded with NB+-functionalized CdSe/ZnS QDs in (1) untreated HeLa cells, (2) Taxol-treated HeLa cells. Inset: Time-dependent confocal microscopy images of a HeLa cell (without Taxol treatment) upon triggering the metabolism with glucose 50 mM. Adapted with permission from ref (169). Copyright 2008 John Wiley & Sons, Inc.
Figure 12
Figure 12
(A) Schematic pH-stimulated fluorescence changes of fluorescein isothiocyanate (FITC)-functionalized C-dots. (B) Fluorescence spectra of the FITC-modified C-dots at different pH values. (C) Confocal microscopy images (fluorescence, FL, and bright-field BF) following the spatial pH changes in L929 cells loaded with the FITC-modified C-dots. Adapted with permission from ref (170). Copyright 2013 IOP Publishing.
Figure 13
Figure 13
Carbon-dot-based sensor for the intracellular sensing of Zn2+ ions. Adapted from ref (177). Copyright 2014 Royal Society of Chemistry.
Figure 14
Figure 14
Chemically modified polymer NPs for intracellular sensing: (I) NPs function as optically responsive ligands. (II) Particles functionalized with an analyte recognition unit and an optical-transducing element. The recognition event activates the optical transducer.
Figure 15
Figure 15
(A) Chemically modified boronate ester-functionalized BPAN NPs for intracellular fluorescence probing H2O2. (B) Fluorescence spectra changes of the modified polymer NPs upon interaction with increasing amounts of H2O2: 0, 20, 40, 60, and 80 μM. Adapted from ref (185). Copyright 2012 American Chemical Society.
Figure 16
Figure 16
Bifunctional recognition/dye polymer NPs for sensing: (A) Sensing of H2O2via the HRP-driven oxidation of Amplex-Red to the fluorescent Resorufin product. (B) Sensing of glucose by the depletion of O2 by the GOx-mediated oxidation of glucose, using Ru(bpy)32+ as auxiliary fluorescent probe.
Figure 17
Figure 17
(A) Scheme showing prion mutation and prion ultradetection in human blood. Surface-enhanced Raman spectra (SERS) of (a) natural and (b) spiked human blood; (c) natural and (d) spiked human plasma; (e) spiked human plasma after spectral subtraction of the matrix (human plasma); (f) the scrambled prion. Adapted with permission from ref (199). Copyright 2011 National Academy of Sciences. (B) (a) Optical spectra and SERS (mapped at 1548 cm–1, as marked with the arrow below) images of 3T3 cells in the presence of capsules. The SERS spectra (bottom) show the signals for the colored circles in the image (top). (b) Optical images and intracellular NO formation over time (obtained through the I1583/(I1583 + I1548) relation) for three different samples upon NO induction with hydrogen peroxide (H2O2). A control sample without the presence of H2O2 is also shown for comparison. Representative normalized SERS spectra obtained at different times are shown. The SERS dashed (blue) and dotted (red) spectra represent the reference vibrational pattern for aminobezenethiol and hydroxybenzenethiol, respectively. Adapted with permission from ref (206). Copyright 2013 John Wiley & Sons, Inc. (C) (a) Outline of the c-Fos/c-Jun dimerization on the metal surface and the resulting deformation of the Raman label structure. (b) Details of the 1000–1100 cm–1 spectral regions of the SERS of the molecular spring (benzenethiol) interfacing the NP and the protein c-Fos.(c) Spectral shift of the benzenethiol band at ca. 1075 cm–1 as a function of c-Jun concentration (logarithmic scale) in HEPES buffer. Adapted from ref (209). Copyright 2013 American Chemical Society. (D) (a) In vivo cancer targeting and SERS detection by using ScFv-antibody-conjugated AuNPs that recognize the tumor biomarker epidermal growth factor receptor (EGFR). Top: Photographs showing a laser beam focusing on the tumor site or on the anatomic location of liver. Bottom: SERS spectra obtained from the tumor and the liver locations by using (a) targeted and (b) nontargeted NPs. Two nude mice bearing human head and neck squamous cell carcinoma (Tu686) xenograft tumors (3 mm diameter) received 90 mL of ScFv EGFR-conjugated SERS tags or PEGylated SERS tags (460 pM). The NPs were administered via tail vein single injection. SERS spectra were taken 5 h postinjection. In vivo SERS spectra were obtained from the tumor site (red) and the liver site (blue) with 2 s signal integration and at 785 nm excitation. The spectra were background-subtracted and shifted for better visualization. The Raman reporter molecule was malachite green, with distinct spectral signatures as labeled. Adapted with permission from ref (210). Copyright 2008 Nature Publishing Group.
Figure 18
Figure 18
(A) Five-step CAPIR cascade in targeted cancer drug delivery. Reprinted with permission from ref (306). Copyright 2014 John Wiley & Sons, Inc. (B) Needed properties of a nanomedicine capable of accomplishing the cascade.
Figure 19
Figure 19
Scheme of a two-stage microfluidic platform for assembling polymer–lipid hybrid NPs with varying amounts of water. (a) Nanoparticles composed of the lipid shell and PLGA core are produced by injecting the PLGA solution in the first stage and lipid–PEG solution in the second stage (mode 1, P–L NPs). (b) Nanoparticles composed of the lipid shell, interfacial water layer, and PLGA core are produced by injecting the lipid–PEG solution in the first stage and the PLGA solution in the second stage (mode 2, P–W–L NPs). Adapted with permission from ref (316). Copyright 2015 John Wiley & Sons, Inc.
Figure 20
Figure 20
Global structure of therapeutic RNA NPs with BRCAA1 siRNA. (A) Design of the RNA NPs. The left image shows the NP structure as used in animal trials. On the right, an extended structure imaged by atomic force microscopy (AFM) is shown. (B) AFM image of extended 3WJ RNA NPs. The RNA complex as shown in (A) on the left is estimated to be around 10 nm in size. Due to convolution of the tip size (∼10 nm in diameter) in AFM images, features smaller than the size of the tip cannot be resolved. To characterize the structure of the RNA constructs, the 3WJ NPs were extended by 39–60 base pairs (in red color, A, on the right), which is within the persistence length of dsRNA and will not affect the 3WJ folding as described before by Shu et al., to generate the AFM image as shown. Adapted with permission from ref (354). Copyright 2015 Nature Publication Group.
Figure 21
Figure 21
(A) Schematic to show the barriers and challenges that are responsible for failed chemotherapy in PDAC. This includes abundant dysplastic stroma, which serves as a physical and biological barrier, interference in vascular access and the presence of a high local concentration of deaminase activity, which leads to in activation of GEM. Trichrome staining of human PDAC is also shown: blue staining is collagen deposition. (B) Two-wave approach for PDAC treatment. PEI/PEG-MSNP binds to the TGFβ inhibitor, LY364947. The complexation is highly stable in the physiological conditions, but can be disrupted in the acidic stromal environment. NIR-labeled particles retention was increased 10-fold prior to injecting the TGFβi carrier into mice with BxPC3 xenografts (circle), with significantly decreased pericyte coverage on endothelial cells in tumor blood vessel. Reprinted from ref (365). Copyright 2013 American Chemical Society. (C) Schematic describing GEM trapping in MSNP pores, which are sealed off by the LB that contains a subtoxic dose of paclitaxel (PTX). Ratiometric codelivery of GEM/PTX by LB-MSNP inhibits PANC-1 orthotopic tumor growth through increased delivery of GEM at the tumor site. GEM/PTX loaded LB-MSNP leads to CDA inhibition in parallel with increased oxidative stress. Adapted from ref (366). Copyright 2015 American Chemical Society.
Figure 22
Figure 22
Interchange between “stealthy and sticky” for zwitterionic polymer micelles (left) and the mix-charged AuNPs (right). Adapted with permission from ref (373) and (374). Copyright 2012 and 2014 John Wiley & Sons, Inc.
Figure 23
Figure 23
Cellular and noncellular barriers of the lung: after landing on lung lining fluids, (1) the drug (or eventually entire NPs) must cross the pulmonary epithelium (2) in order to reach the underlying tissue or the systemic circulation, respectively. Besides, inhalation, nanopharmaceuticals must also overcome effective clearance processes (3) provided by either mucus in the central lung (bronchi) or by macrophages in the peripheral lung (alveoli). Reprinted with permission from ref (408). Copyright 2014 Elsevier.
Figure 24
Figure 24
SN38 prodrug formed nanocapsule responsive to tumor GSH/ROS heterogeneity, releasing the parent drug SN38 via thiolysis in the presence of GSH or via enhanced hydrolysis due to ROS oxidation of the linker. This process thereby gives rise to high in vitro cytotoxicity and in vivo anticancer therapeutic activity. Reprinted with permission from ref (435). Copyright 2013 John Wiley & Sons, Inc.
Figure 25
Figure 25
ATP-EndoGI sense-and-treat system involving CPT-loaded mesoporous SiO2 NPs: (A) Reconfiguring the DNA capping units via the formation of ATP–aptamer complexes, followed by the Endo GI digestion of these complexes which leads to the recycling of the ATP biomarker and the release of CPT. (B) Cytotoxicity of the ATP/EndoGI-responsive CPT-loaded SiO2 NPs toward (I) MDA-MB 231 cells, (II) MCF-10a cells. Entries (a) correspond to treatment of the cells with unloaded NPs and (b) correspond to CPT-loaded SiO2 NPs. Gray bars correspond to cell viability after 24 h, and black bars represent the cell viabilities after 48 h. Adapted from ref (437). Copyright 2013 American Chemical Society.
Figure 26
Figure 26
(A) Chemical nucleoside modifications frequently used for nucleic acid effectors. In many cases, phosphorothioate (PS) modifications (one of the two nonbridging oxygens of the phosphodiester replaced with sulfur) are incorporated, to improve the pharmacokinetic properties and cellular uptake. (B) LNA gapmers composed of terminal LNA residues and at least 6 central DNA nucleotides enable cleavage of RNA target strands as part of RNA:DNA hybrids by endogenous RNase H activities. (C) In the U1 adaptor approach, a U1 small nuclear ribonucleoprotein (snRNP) (an abundant spliceosomal RNP) is guided to the 3′-terminal exon of a target pre-mRNA via a dual antisense oligonucleotide that simultaneously anneals to the 5′-end of U1 RNA. This blocks polyadenylation via an inhibitory interaction between poly(A) polymerase (PAP) and the U1–70K protein. As a result, the pre-mRNA is still cleaved but not polyadenylated, which induces its degradation. Efficient down-regulation by “U1 interference (U1i)” was observed with target domains of 12–15 nt (with up to 15 LNA residues) and 10–13 nt in the U1 RNA binding domain (good efficiency observed with eight 2′-O-methyl and five LNA residues). A PS backbone was also found to be compatible with U1i., U1A, U1C, U1–70k and the Sm ring proteins are integral components of the U1 snRNP. PAP: poly(A) polymerase; CPSF: cleavage and polyadenylation specificity factor (including the endonucleolytic subunit 73); CA: cleavage site. Adapted with permission from ref (494). Copyright 2009 John Wiley & Sons, Inc.
Figure 27
Figure 27
Exogenous RNA effectors utilizing the RNAi machinery of mammalian cells (siRNA duplexes, shRNAs, miRNA mimics) or interfering with the function of endogenous miRNAs (antimiRs). siRNA duplexes, 19 bp long, mimicking the processing products of the RNase Dicer, are incorporated into the RNA-induced silencing complex (RISC). One of the two siRNA strands (termed the guide strand) is selected by RISC to guide the complex to complementary mRNAs sequences that are cleaved by the endonuclease Ago2 followed by mRNA decay. This catalytic process is highly efficient as one siRNA-programmed RISC can cleave many complementary mRNA molecules. In the case of small shRNA expression vectors, a single or multiple shRNAs are usually transcribed from RNA polymerase III promoters after the DNA vector has reached the nucleus; alternatively, miRNA polycistrons can be transcribed from RNA polymerase II (Pol II) promoters. The miRNA primary transcripts (termed pri-miRNAs), vector-encoded shRNAs or polycistronic miRNA transcripts are processed by Drosha and DGCR8 and are exported as precursor intermediates (pre-miRNAs or shRNAs) from the nucleus by the export factor exportin 5 (Exp. 5). The final maturation to short duplexes is catalyzed by the RNase Dicer in the cytoplasm. siRNA and miRNA pathways differ after guide strand selection by RISC: whereas siRNAs are fully complementary to the target mRNA and induce its cleavage, miRNA strands guide the RISC primarily to the 3′-UTR of their target mRNAs where they form only partial base pairing interactions. The prevailing biological miRNA effects are inhibition of the 5′-cap-dependent initiation of protein biosynthesis and/or induction of mRNA transfer into cytoplasmic “processing (P) bodies”, where the mRNAs are stored or degraded; m7G: 7-methyl-guanosine-5′,5′-triphosphate cap at the 5′ end of mRNAs; An: poly(A) tail at the 3′-end of mRNAs.
Figure 28
Figure 28
(A) Relative catalytic activity of galactosidase in the presence of three different shapes of ZnO NPs. The relative catalytic activity of galactosidase with each of the ZnO NPs was normalized with respect to free enzyme activity. (B) Pictorial representation of pyramid-shaped NPs interacting with the active site of galactosidase. (C–E) Lineweaver–Burk plots of galactosidase activity with various concentrations of ZnO (C) nanopyramids, (D) nanoplates, and (E) nanospheres. Adapted from ref (518). Copyright 2015 American Chemical Society.
Figure 29
Figure 29
Schematic of overall design and possible mechanism of drug-free macromolecular therapeutics for treatment of NHL. Adapted from ref (521). Copyright 2014 American Chemical Society.
Figure 30
Figure 30
Relative absorbance of body tissue components such as water, hemoglobin (Hb), oxygenated hemoglobin (HbO2), and melanin. The window that will allow the deepest penetration is the 600–1200 nm region, in the red-NIR. Adapted from ref (544). Copyright 2001 Nature Publishing Group.
Figure 31
Figure 31
Surgeons delivering laser light through an optical fiber for the treatment of an internal tumor.
Figure 32
Figure 32
Evaluation of tumor response to PTT by bioluminescence imaging. The bioluminescence signal is generated only in living cancer cells, as a result of luciferase activity. (A) Representative mice of each experimental group showing the luciferase activity in the tumor. The mice injected with nanomatryoshkas or nanoshells and treated with laser experienced loss of bioluminescence in the area illuminated by the laser, as seen after therapy. Mice were euthanized when tumor volume reached 1500 mm3 or if the tumor persisted at 60 days after treatment. (B) Luciferase activity in the tumor. The luciferase signal was normalized to the signal before treatment. Adapted from ref (560). Copyright 2014 American Chemical Society.
Figure 33
Figure 33
Bone fixation screw made of a biodegradable polymer (PLLA) reinforced with octadecylamine (ODA)-funtionalized fluorescent nanodiamond NPs (ND-ODA) that provide reinforcement, monitoring of biodegradation, and, eventually, drug delivery. Adapted with permission from ref (603). Copyright 2011 Elsevier.
Figure 34
Figure 34
Left: Scanning electron microscopy (SEM) image of a spinal explant peripheral neuronal fiber on a MWCNT substrate. Note the tight and intimate contacts (red arrows) between the neurite membrane and the MWCNTs. Scale bar: 500 nm. Reprinted from ref (622). Copyright 2012 American Chemical Society. Right: SEM image of cardiac myocyte deposited on a layer of MWNT. Adapted from ref (633). Copyright 2013 American Chemical Society.
Figure 35
Figure 35
Antibacterial polypeptide-grafted chitosan-based vesicles capable of delivering anticancer and antiepileptic drugs simultaneously. Reprinted from ref (694). Copyright 2013 American Chemical Society.
Figure 36
Figure 36
Construction of targeted NPs carrying the PDT drug Pc 4. Quantitative measures of T2 values show that the cells with Fmp-iron oxide (IO) NPs had lower T2 values as compared to those with only SPIONs. Reprinted from ref (717). Copyright 2014 American Chemical Society.
Figure 37
Figure 37
Negatively charged plasmid mixture (encoding Oct4, Sox2, miR302-367) and the positively charged cationized Pleurotus eryngii polysaccharide (CPEPS) self-assembled into NPs, named as CPEPS- OS-miR NPs, which were applied to human umbilical cord mesenchymal stem cells for iPSCs generation. Adapted from ref (733). Copyright 2015 American Chemical Society.
Figure 38
Figure 38
Fluorescence and MR imaging of NP-labeled MSCs targeting gastric cancer cells in vivo. (A) In vivo fluorescence images show that (right) tumor sites of the mice in the test group had fluorescence signals of NP-labeled MSCs postinjection after 7 and 14 days, and (left) tumor sites of the mice in the control group had no fluorescence signal of NPs postinjection after 7 and 14 days. (B) Fluorescence images of major organs show that (left) no signal was detected in the tumor and organs of the control group, and (right) obvious fluorescence signals were detected in the tumor tissues of the test group. (C) MR imaging of NP-labeled MSCs targeting gastric cancer cells after 7 and 14 days postinjection. Adapted with permission from ref (734). Copyright 2012 Ruan et al.
Figure 39
Figure 39
Essential requirements for a nanomedicine to be translational. Adapted with permission from ref (307). Copyright 2012 Elsevier.

Similar articles

Cited by

References

    1. Min Y.; Caster J. M.; Eblan M. J.; Wang A. Z. Clinical Translation of Nanomedicine. Chem. Rev. 2015, 115, 11147–11190. 10.1021/acs.chemrev.5b00116. - DOI - PMC - PubMed
    1. Kim B. Y. S.; Rutka J. T.; Chan W. C. W. Nanomedicine. N. Engl. J. Med. 2010, 363, 2434–2443. 10.1056/NEJMra0912273. - DOI - PubMed
    1. Lobatto M. E.; Fuster V.; Fayad Z. A.; Mulder W. J. M. Perspectives and Opportunities for Nanomedicine in the Management of Atherosclerosis. Nat. Rev. Cancer 2011, 10, 963–963. 10.1038/nrd3614. - DOI - PMC - PubMed
    1. Langer R.; Weissleder R. Nanotechnology. J. Am. Med. Assoc. 2015, 313, 135–136. 10.1001/jama.2014.16315. - DOI - PubMed
    1. Shao K.; Singha S.; Clemente-Casares X.; Tsai S.; Yang Y.; Santamaria P. Nanoparticle-Based Immunotherapy for Cancer. ACS Nano 2015, 9, 16–30. 10.1021/nn5062029. - DOI - PubMed

Publication types