. 2017 Apr;27(4):461-482.
doi: 10.1038/cr.2017.34. Epub 2017 Mar 14.

Blocking the recruitment of naive CD4+ T cells reverses immunosuppression in breast cancer

Affiliations

Blocking the recruitment of naive CD4+ T cells reverses immunosuppression in breast cancer

Shicheng Su et al. Cell Res. 2017 Apr.

Abstract

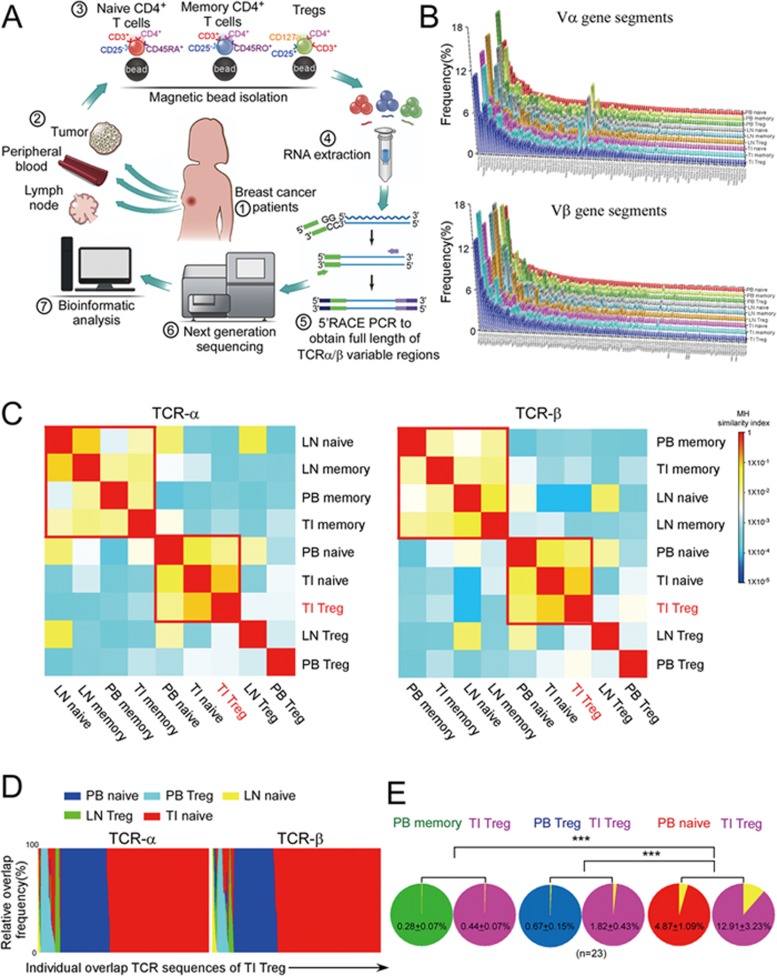
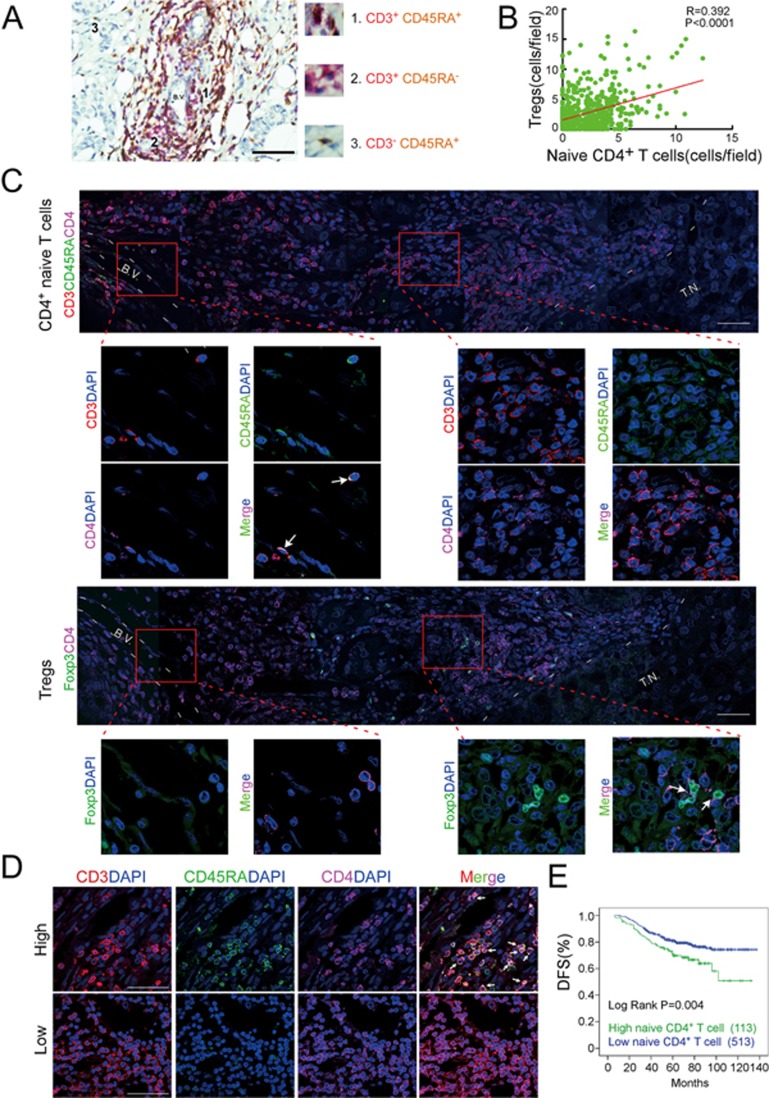
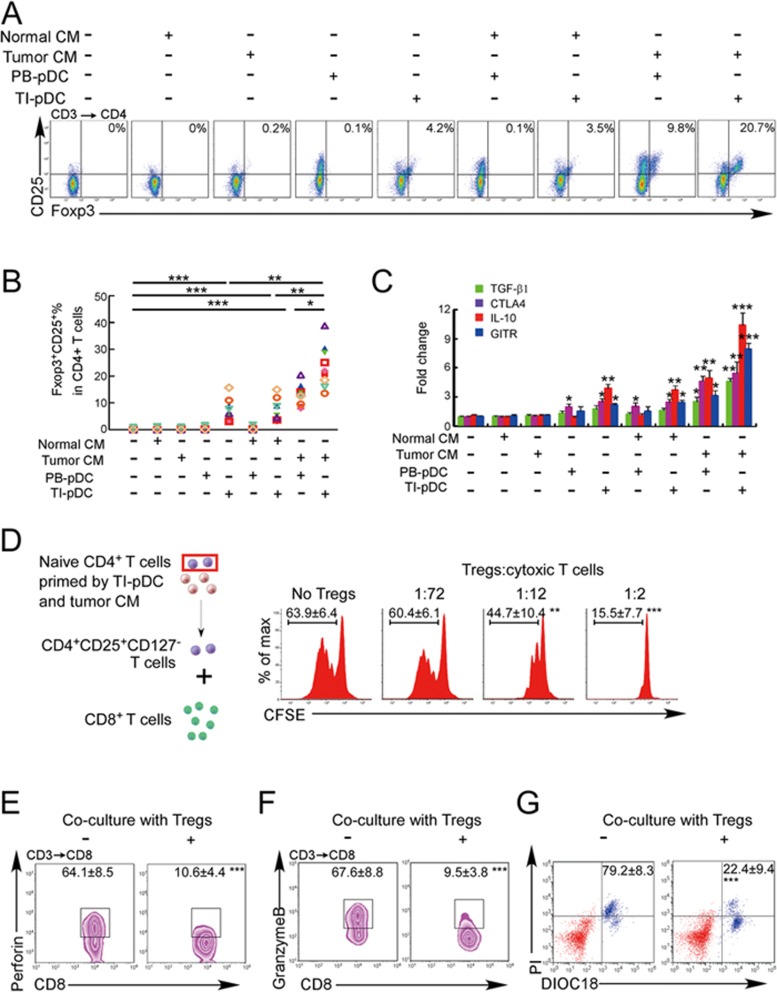
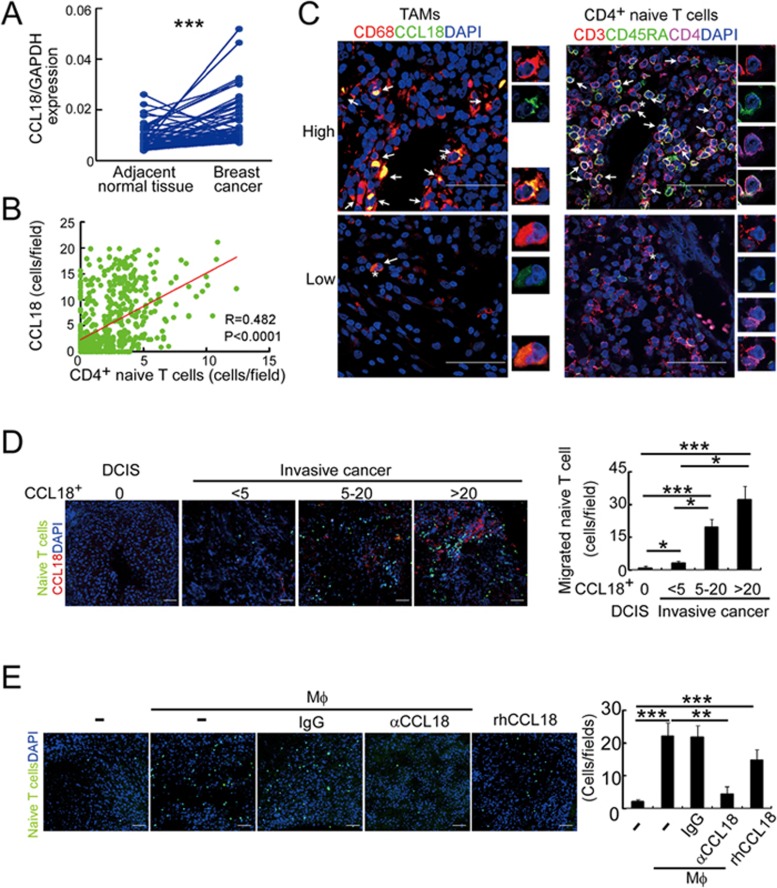
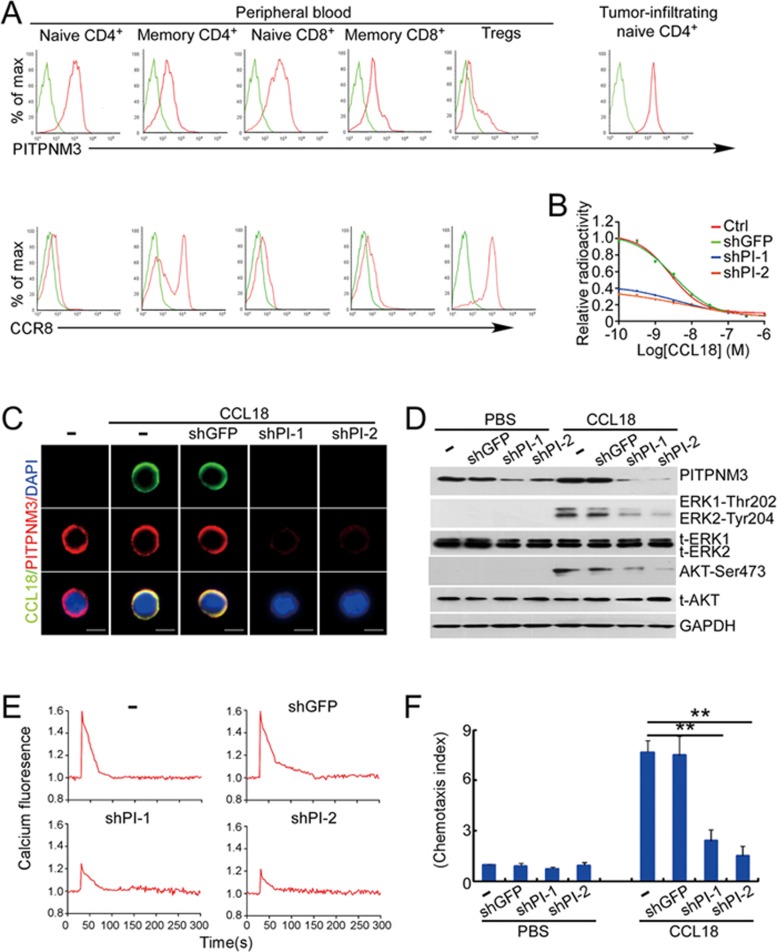
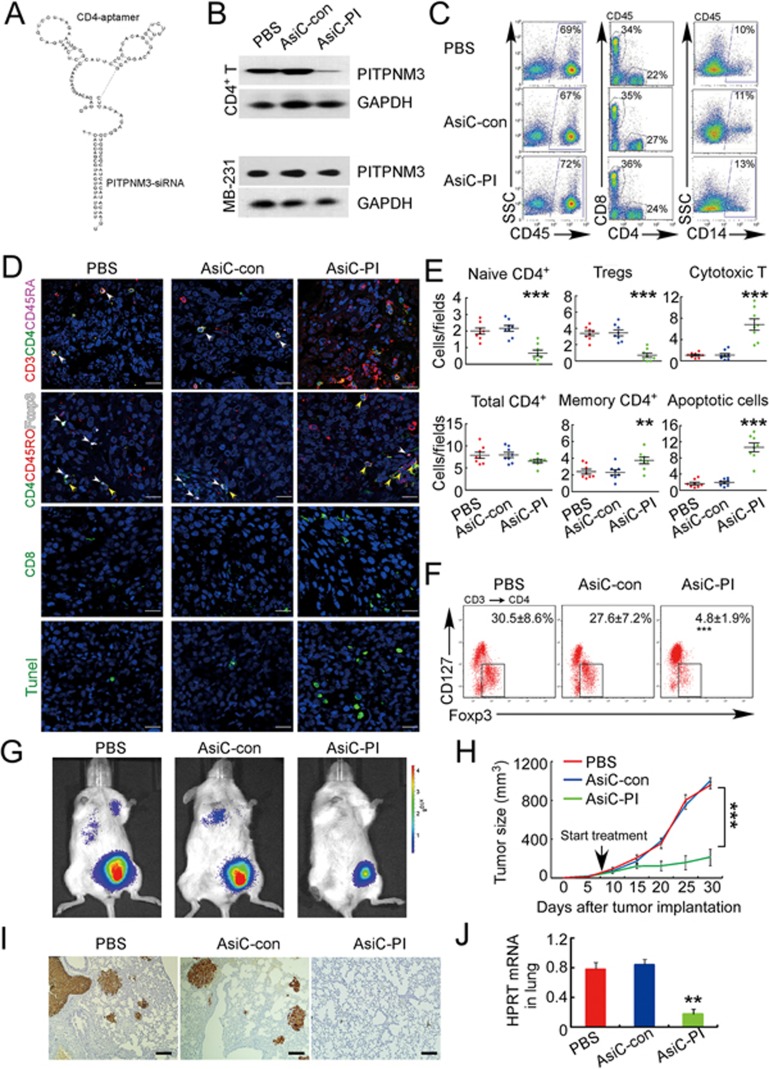
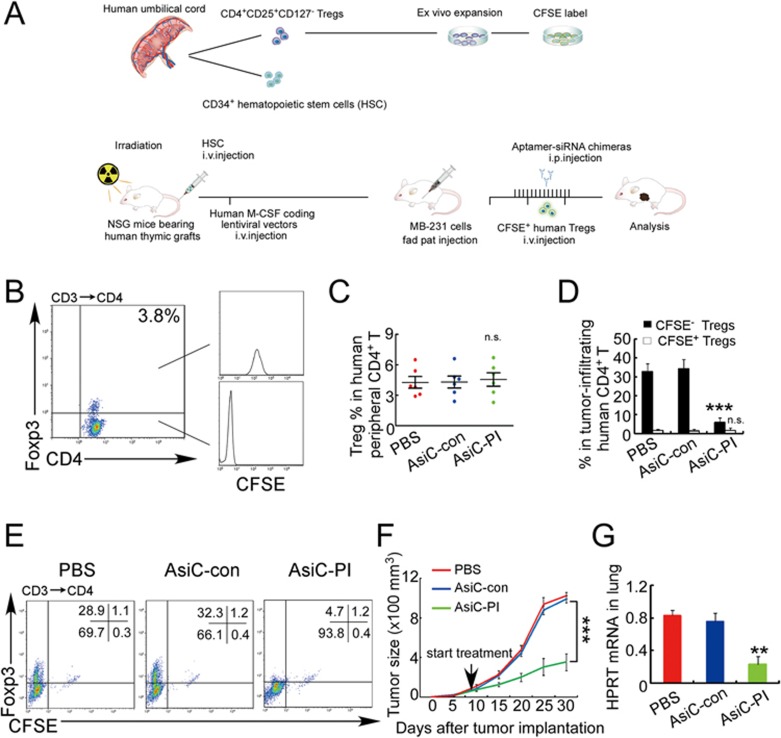
The origin of tumor-infiltrating Tregs, critical mediators of tumor immunosuppression, is unclear. Here, we show that tumor-infiltrating naive CD4+ T cells and Tregs in human breast cancer have overlapping TCR repertoires, while hardly overlap with circulating Tregs, suggesting that intratumoral Tregs mainly develop from naive T cells in situ rather than from recruited Tregs. Furthermore, the abundance of naive CD4+ T cells and Tregs is closely correlated, both indicating poor prognosis for breast cancer patients. Naive CD4+ T cells adhere to tumor slices in proportion to the abundance of CCL18-producing macrophages. Moreover, adoptively transferred human naive CD4+ T cells infiltrate human breast cancer orthotopic xenografts in a CCL18-dependent manner. In human breast cancer xenografts in humanized mice, blocking the recruitment of naive CD4+ T cells into tumor by knocking down the expression of PITPNM3, a CCL18 receptor, significantly reduces intratumoral Tregs and inhibits tumor progression. These findings suggest that breast tumor-infiltrating Tregs arise from chemotaxis of circulating naive CD4+ T cells that differentiate into Tregs in situ. Inhibiting naive CD4+ T cell recruitment into tumors by interfering with PITPNM3 recognition of CCL18 may be an attractive strategy for anticancer immunotherapy.


Figures

Figure 1
Figure 1
The TCR repertoire of breast cancer tumor-infiltrating Tregs is most similar to that of naive CD4+ T cells. (A-D) Full-length TCR-β/α variable regions of Tregs, naive CD4+ T cells and memory CD4+ T cells from peripheral blood (PB), lymph nodes (LN) and primary tumors (tumor-infiltrating, TI) of five breast cancer patients were amplified and sequenced. Pooled data from all five patients were compared. (A) Experimental schematic. (B) Frequencies of Vα/β gene usage in the groups of isolated T cells (V genes were ordered based on decreasing frequency in PB naive CD4+ T cells). (C) Similarity of pooled TCR repertoires, calculated using the Morisita-Horn similarity index, was used to cluster the groups of T cells analyzed. A value between 0 (no similarity) and 1 (identical) was calculated and colored according to the shown scale. (D) Individual overlap sequences of TI Treg identified in other groups of T cells. Individual TCR sequences of TI Tregs were arrayed on the x axis and the relative frequency at which this particular sequence was found in other subsets was plotted on the y axis. (E) Proportion of unique TRBV12-4/TRBJ1-2 sequences shared between TI Tregs and the 3 PB T cell subtypes (Treg, naive and memory CD4 T cells) in 23 breast cancer patient samples (shown are proportion of overlapping sequences (mean ± SEM), ***P < 0.001 by Student's t-test).
Figure 2
Figure 2
Naive CD4+ T cell abundance within breast tumors is associated with increased numbers of Tregs and poor patient prognosis. (A) IHC staining of CD3 (red) and CD45RA (brown) in a representative breast cancer sample. Naive T cells were defined as CD3+CD45+ cells. Scale bar, 50 μm. (B) Correlation of TI naive CD4+ T cell numbers and TI Treg numbers in breast cancer samples (n = 626, Pearson correlation coefficient R and P-value are shown). (C) Representative immunofluorescent staining for naive T cells (CD3 (red), CD45RA (green) and CD4 (purple); upper panels) or Tregs (Foxp3 (green) and CD4 (purple); lower panels) in serial sections from a human breast cancer sample. Arrows indicate CD3+CD4+CD45RA+ naive CD4+ T cells (upper) and CD4+Foxp3+ Tregs (lower). Scale bar, 50 μm. The localization of naive CD4 T cells and Tregs relative to the perivascular space or tumor parenchyma for 626 tumor samples is provided in Supplementary information, Figure S3C. (D) Representative immunofluorescent staining of CD3 (red), CD45RA (green), CD4 (purple) and DAPI (blue) in breast cancer samples with high (upper panel) or low (lower panel) number of naive CD4+ T cells, which are indicated by arrows. Scale bar, 50 μm. (E) Kaplan-Meier survival curve of breast cancer patients with low and high numbers of TI naive CD4+ T cells. BV, blood vessel; TN, tumor nest.
Figure 3
Figure 3
Naive CD4+ T cells are converted to functional Tregs by tumor-infiltrating DCs and tumor conditioned medium (CM). (A-C) Naive CD4+ T cells from peripheral blood of patients with invasive breast carcinoma were co-cultured with or without autologous pDCs isolated from tumor (TI) or peripheral blood (PB) for 9 days in the presence or absence of 30% CM from autologous tumor slices or adjacent normal tissue slices. (A, B) Non-adherent cells from co-cultures were stained for CD3, CD4, CD25 and intracellular Foxp3, and analyzed by flow cytometry. Representative plots of gated CD3+CD4+ cells (A) and quantification of percentage of Foxp3+CD25+ cells among CD3+CD4+ cells (B) are shown (mean ± SEM, n = 19; *P < 0.05, **P < 0.01,***P < 0.001 by Student's t-test). (C) Expression of Treg-associated genes, assessed by qRT-PCR normalized to GAPDH, in sorted CD4+ T cells, relative to expression in cultures without DCs or CM (mean ± SEM, n = 19; *P < 0.05, **P < 0.01,***P < 0.001 compared with naive CD4+ T cells cultured alone by Student's t-test). (D-G) Effect of naive CD4+ T cell-derived Tregs, obtained by co-culture with TI pDCs and tumor CM as above, on function of autologous tumor-specific CD8+ T cells. Tumor-specific CD8+ T cells were generated for each subject by stimulating autologous PB CD8+ T cells with autologous tumor lysate-pulsed autologous DCs. Tregs were recovered from co-cultures by magnetic sorting. (D) CFSE-labeled CD8+ T cells were incubated with tumor lysate-pulsed DCs in the presence of induced Tregs at the indicated ratios and proliferation was assessed by flow cytometry. Numbers denote the percentage of cells undergoing at least one cellular division (mean ± SEM, n = 12, **P < 0.01, ***P < 0.001 compared with CD8+ T cells cultured without Tregs). (E-G) Tumor-specific CD8+ T cells were incubated with autologous primary breast cancer cells for 18 h in the presence or absence of Tregs (CD8:Treg 2:1) and stained for CD3, CD8, intracellular perforin (E) or granzyme B (F) and gated CD3+CD8+ cells were analyzed by flow cytometry. Numbers indicate the percentage of gated cells stained for perforin or granzyme B (mean ± SEM, n = 7; ***P < 0.001 compared with CD8+ T cells cultured without Tregs). (G) Tumor-specific CD8+ T cells were incubated with autologous dioctadecyloxacarbocyanine (DIOC18)-labeled primary breast cancer cells for 18 h in the presence or absence of Tregs (CD8:Treg 2:1) and the death of tumor cells was assessed by propidium iodide (PI) uptake by flow cytometry. The numbers shown indicate the percentage of PI+ tumor cells (mean ± SEM, n = 4; ***P < 0.001 compared with CD8+ T cells cultured without Tregs).
Figure 4
Figure 4
Naive CD4+ T cells are recruited to breast tumors by TAM-secreted CCL18. (A) CCL18 expression in breast cancer tissues and paired adjacent normal breast tissues detected by qRT-PCR relative to GAPDH(n = 52; ***P < 0.001 by Student's t-test). (B) Correlation of numbers of CCL18+ TAM (CD68+CCL18+) and naive CD4+ T (CD3+CD4+CD45RA+) cells in breast cancer samples (n = 626, Pearson's correlation coefficient R and P-value are shown). (C) Representative immunofluorescent staining for CD68 and CCL18 and CD3, CD45RA and CD4 from CCL18-high (upper panel) and CCL18-low (lower panel) breast cancer samples. CCL18+ TAMs and naive CD4+ T cells are indicated by arrows. Asterisk indicates the location of higher magnification images at right. Scale bar, 50 μm. (D) Naive PB CD4+ T cells labeled with CFSE (green) were overlaid on autologous breast tumor slices that were then fixed and stained for CCL18 (red). Representative images (left) and quantification of number of adherent CFSE+ T cells (mean ± SEM; right) are shown (ductal carcinoma in situ (DCIS), n = 4; invasive cancer with CCL18+ cell count < 5, n = 9; 5-20, n = 6; > 20, n = 4; *P < 0.05; ***P < 0.001 by Student's t-test). Scale bar, 50 μm. (E) CFSE-labeled PB naive CD4+ T cells from healthy donors were intravenously injected via tail vein, with or without control IgG or CCL18-neutralizing antibody, into NOD/scid mice bearing subcutaneous MDA-MB-231 breast cancers that were implanted 14 days earlier either alone or with autologous human macrophages. In some mice, the xenografts were injected with rhCCL18. The number of CFSE+ T cells that migrated into the xenografts was measured by immunofluorescence microscopy 48 h after T cells were injected. Shown are representative images (left) and the number of CFSE+ cells/high power field for each condition (mean ± SEM, n = 8 mice per group. **P < 0.01; ***P < 0.001 by Student's t-test). Scale bar, 50 μm.
Figure 5
Figure 5
PITPNM3 is a CCL18 receptor on naive CD4+ T cells. (A) Representative flow cytometry staining for PITPNM3 and CCR8, potential CCL18 receptors, on gated PB T cell subsets and paired TI naive CD4+ T cells of a breast cancer patient. Cells were gated on CD3+CD45RA+CD45ROCD25CD4+/CD8+ for naive CD4+/CD8+ T cells, CD3+CD45RACD45RO+CD25CD4+/CD8+ for memory CD4+/CD8+ T cells and CD3+CD4+CD25+ for Tregs). Quantitation of PITPNM3 and CCR8 expression on T cell subsets for eight breast cancer patients is provided in Supplementary information, Figure S8A. (B-F) Knockdown of PITPNM3 in naive CD4+ T cells inhibits CCL18 binding, signaling and chemotaxis. (B) Binding of 125I-CCL18 to naive CD4+ T cells, knocked down or not for PITPNM3 (shPI-1,2) in the presence of increasing concentrations of unlabeled CCL18. Shown are the representative assays for three independent experiments using PB T cells from three normal donors. (C) Representative fluorescence microscopy images of CCL18 binding to naive CD4+ T cells, knocked down or not for PITPNM3, stained for PITPNM3 and CCL18 3 h after adding CCL18. Scale bar, 5 μm. Shown are the representative images for three independent experiments using PB T cells from three normal donors. (D) Immunoblot of CCL18-treated naive CD4+ T cells, knocked down or not for PITPNM3, showing expression of PITPNM3 and phosphorylated/total (t-) Erk1/2 and Akt, relative to GAPDH as a loading control. Blots are representative of data for three donors. (E) Blunted [Ca2+]i mobilization in CCL18-treated naive CD4+ T cells knocked down for PITPNM3. Data are representative tracings for three donors. (F) Blunted chemotaxis of naive CD4+ T cells to CCL18 in a transwell assay. Data are shown as mean ± SEM. Chemotaxis indices for three independent experiments (**P < 0.01 by Student's t-test).
Figure 6
Figure 6
In vivo knockdown of PITPNM3 in CD4+ T cells reverses immunosuppression and inhibits tumor progression in humanized mice. (A) Humanized mice bearing palpable MDA-MB-231 orthotopic xenografts were intraperitoneally injected daily for 14 days with PBS, 1 nmol CD4-aptamer-control siRNA (AsiC-con) or CD4-aptamer-siRNA targeting PITPNM3 (sequence in A, AsiC-PI) to assess the role of PITPNM3 in TI Tregs, and other T cells and tumor control. Experimental schematic is provided in Supplementary information, Figure S9A. (B) Representative immunoblots showing selective knockdown of PITPNM3 protein in PB CD4+ T cells, but not tumor xenografts (n = 3). (C) PITPNM3 knockdown did not affect the distribution of human CD45+ hematopoietic cells, CD4+ and CD8+ T cells, and CD14+ monocytes in the peripheral blood of humanized mice. Representative flow plots are shown (n = 3). (D, E) Effect of PITPNM3 knockdown on TI naive CD4+, Tregs and CD8+ T cell numbers, and apoptosis by TUNEL assay in xenografts. D shows representative immunofluorescence microscopy images. Top row indicates CD4+ naive T cells by arrows; the second row indicates CD4+CD45RO+Foxp3CD4+ memory T cells (yellow arrows) and Foxp3+ Tregs (white arrows). Scale bar, 50 μm. E shows number of cells of each subtype/high power field in eight mice (**P < 0.01, ***P < 0.001 compared to PBS group by Student's t-test). (F) Flow cytometry analysis of gated human CD3+CD4+ cells isolated from xenografts stained for CD127 and Foxp3. Representative flow plots in each group were shown. Numbers show the proportion of Tregs for eight mice per group (mean ± SEM; ***P < 0.001 compared to PBS group by Student's t-test). (G) Representative bioluminescence imaging of primary tumor and metastases in mice. (H) Primary tumor size (mean ± SEM) in each treatment group (8 mice per group; ***P < 0.001 by two-way ANOVA with Bonferroni multiple comparison tests). (I) Representative lung IHC images stained for human cytokeratin to identify human cancer cell metastases. Scale bar, 50 μm. (J) Quantification of metastatic lung tumors by qRT-PCR analysis of human HPRT mRNA relative to mouse 18S rRNA. Data are shown as mean ± SEM for eight mice per group (**P < 0.01 by Student's t-test).
Figure 7
Figure 7
CD4-aptamer-siRNA targeting PITPNM3 reduces TI Tregs and inhibits tumor progression in humanized mice with circulating human Tregs. Humanized mice, implanted with MDA-MB-231 tumors and concurrently injected intravenously with autologous Tregs, were intraperitoneally injected daily for 14 days after tumors became palpable with PBS, 1 nmol CD4-aptamer-control siRNA (AsiC-con) or CD4-aptamer-siRNA targeting PITPNM3 to assess the role of PITPNM3 in TI Tregs, and other T cells and tumor control. Tregs were administered every 10 days after the initial injection and mice were sacrificed 30 days after tumor cell inoculation. (A) Experimental schematic. (B, C) Peripheral blood cells of humanized mice were stained for human CD3, CD4 and Foxp3, and analyzed by flow cytometry. A representative flow plot (B) and the percentage (mean ± SEM) of PB CD4+ cells that are CFSE+ Tregs in six mice per group (C) are shown. (D, E) Isolated cells from xenografts were stained for human CD3, CD4 and Foxp3. The percentage (mean ± SEM) of six mice per group (D) and representative flow plot (E) of FoxP3+ Tregs are shown. Most Tregs were CFSE (i.e., did not come from infused Tregs) and the number of TI Tregs was reduced by knocking down PITPNM3 in CD4+ T cells (***P < 0.001 compared to the PBS group by Student's t-test). (F) Tumor size (mean ± SEM, n = 6 per group; ***P < 0.001 by two-way ANOVA with Bonferroni multiple comparison tests). (G) Lung metastases assessed by qRT-PCR analysis of human HPRT mRNA relative to mouse 18S rRNA in the lungs. Data are shown as mean ± SEM (n = 6 per group; **P < 0.01 by Student's t-test). NS, not statistically significant by Student's t-test.

Similar articles

Cited by

References

    1. Zitvogel L, Tanchot C, Granier C, Tartour E. Following up tumor-specific regulatory T cells in cancer patients. Oncoimmunology 2013; 2:e25444. - PMC - PubMed
    1. Nishikawa H, Sakaguchi S. Regulatory T cells in cancer immunotherapy. Curr Opin Immunol 2014; 27:1–7. - PubMed
    1. Beyer M, Schultze JL. Regulatory T cells in cancer. Blood 2006; 108:804–811. - PubMed
    1. Curiel TJ, Coukos G, Zou L, et al. Specific recruitment of regulatory T cells in ovarian carcinoma fosters immune privilege and predicts reduced survival. Nat Med 2004; 10:942–949. - PubMed
    1. Telang S, Rasku MA, Clem AL, et al. Phase II trial of the regulatory T cell-depleting agent, denileukin diftitox, in patients with unresectable stage IV melanoma. BMC Cancer 2011; 11:515. - PMC - PubMed

MeSH terms